. 2024 Jul 18;9(18):e170444.
doi: 10.1172/jci.insight.170444.

Respiratory neuropathology in spinocerebellar ataxia type 7

Affiliations

Respiratory neuropathology in spinocerebellar ataxia type 7

Debolina D Biswas et al. JCI Insight. .

Abstract

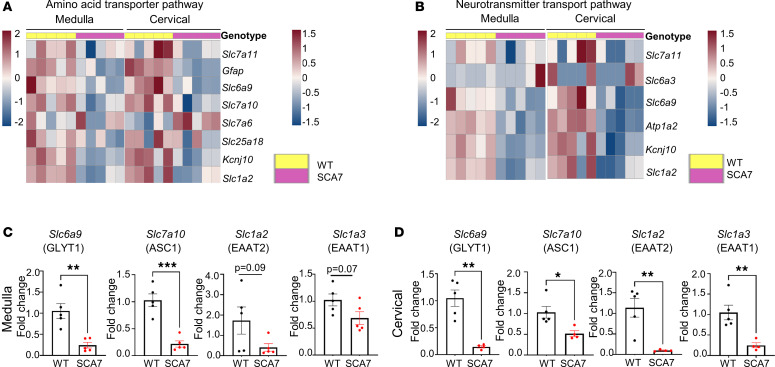
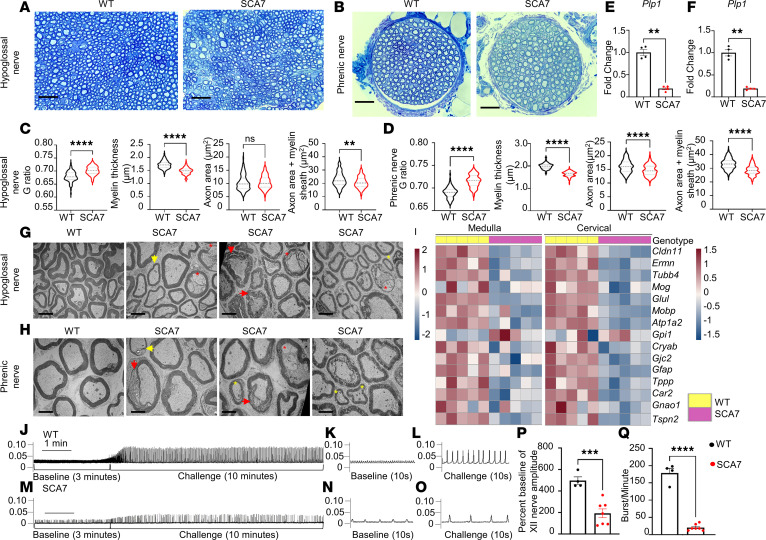
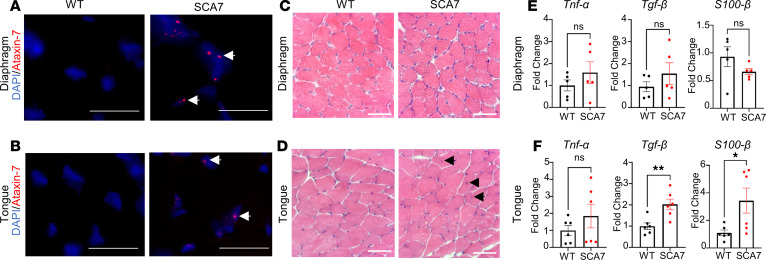
Spinocerebellar ataxia type 7 (SCA7) is an autosomal dominant neurological disorder caused by deleterious CAG repeat expansion in the coding region of the ataxin 7 gene (polyQ-ataxin-7). Infantile-onset SCA7 leads to severe clinical manifestation of respiratory distress, but the exact cause of respiratory impairment remains unclear. Using the infantile-SCA7 mouse model, the SCA7266Q/5Q mouse, we examined the impact of pathological polyQ-ataxin-7 on hypoglossal (XII) and phrenic motor units. We identified the transcript profile of the medulla and cervical spinal cord and investigated the XII and phrenic nerves and the neuromuscular junctions in the diaphragm and tongue. SCA7266Q/5Q astrocytes showed significant intranuclear inclusions of ataxin-7 in the XII and putative phrenic motor nuclei. Transcriptomic analysis revealed dysregulation of genes involved in amino acid and neurotransmitter transport and myelination. Additionally, SCA7266Q/5Q mice demonstrated blunted efferent output of the XII nerve and demyelination in both XII and phrenic nerves. Finally, there was an increased number of neuromuscular junction clusters with higher expression of synaptic markers in SCA7266Q/5Q mice compared with WT controls. These preclinical findings elucidate the underlying pathophysiology responsible for impaired glial cell function and death leading to dysphagia, aspiration, and respiratory failure in infantile SCA7.

Keywords: Expression profiling; Neurological disorders; Neuroscience; Pulmonology; Respiration.


Conflict of interest statement

Conflict of interest: The authors have declared that no conflict of interest exists.

Figures

Figure 1
Figure 1. Accumulation of mutant ataxin-7 in the XII and phrenic respiratory control centers is associated with increased cell death and reduced proinflammatory cytokine expression.
(AH) Representative confocal images from 9-week WT (n = 4) and SCA7 XII (n = 4) (A and B, and E and F) and putative phrenic (C and D, and G and H) respiratory centers immunostaining for anti-ChAT (green)/anti–ataxin-7 (red) (AD), and anti-GFAP (cyan)/anti–ataxin-7 (red) (EH). Cell nuclei were visualized by DAPI (blue). The yellow arrow indicates an accumulation of ataxin-7. Scale bars: 10 μm. (I and J) Quantification of GFAP+DAPI+ cells (in percentage) in XII (I) and putative phrenic (J) respiratory centers from WT (n = 4) and SCA7 (n = 4) mice. **P < 0.001, ***P < 0.001 by 2-tailed Student’s t test. (K and L) Expression of Gfap in the medulla (K) and cervical spinal cord (L) from WT (n = 4) and SCA7 (n = 4) mice by qPCR. **P < 0.001, ***P < 0.001 by unpaired, 2-tailed Student’s t test. (MP) Representative confocal images from 9-week WT (n = 4) (M and N) and SCA7 (n = 4) (O and P) XII (M and O) and phrenic (N and P) respiratory control centers stained with TUNEL (red). Cell nuclei were visualized by DAPI (blue). Scale bars: 20 μm. (Q and R) Representative confocal images from 9-week SCA7 (n = 2) XII respiratory center immunostained for anti-ChAT (green)/TUNEL (red) (Q) and anti-GFAP (cyan)/TUNEL (red) (R). Cell nuclei were visualized by DAPI (blue). Scale bars: 20 μm. (S and T) Expression of proinflammatory (Tnfa, Il1b, Nos2) and antiinflammatory markers (Arg1) in the medulla (S) and cervical spinal cord (T) from WT (n = 4) and SCA7 (n = 4) mice. All data presented as mean ± SEM. *P < 0.05, **P < 0.001 by 2-tailed Student’s t test.
Figure 2
Figure 2. Bulk RNA seq analysis of medulla and cervical of SCA7 exhibits differentially expressed genes that alter biological pathways.
(A) Bulk RNA analysis of the medulla and cervical spinal cord (n = 5 WT and 5 SCA7) shows upregulated and downregulated genes in 9-week SCA7 mice compared with WT mice. (B and C) GO enrichment analysis of 20 most differentially regulated biological pathways in the medulla (B) and cervical spinal cord (C) of 9-week WT and SCA7 (n = 5 WT and 5 SCA7) mice. The x axis marks the enrichment score with a significance cutoff point of P = 0.01.
Figure 3
Figure 3. Accumulation of mutant ataxin-7 alters amino acid transport and neurotransmitter activity in the medulla and cervical spinal cord.
(A and B) Heatmaps showing differentially expressed genes regulating amino acid transporter (A) and neurotransmitter (B) activity pathways in the medulla and cervical spinal cords of 9-week WT (n = 5) and SCA7 (n = 5) mice. (C and D) Expression of Slc6a9, Slc7a10, Slc1a2, and Slc1a3 in the medulla (C) and cervical spinal cord (D) in 9-week WT (n = 5) and SCA7 (n = 5) mice analyzed by qPCR. Data presented as mean ± SEM. *P < 0.05, **P < 0.001, ***P < 0.001 by 2-tailed Student’s t test.
Figure 4
Figure 4. SCA7 mice exhibit significant XII and phrenic nerve pathology.
(A and B) Representative bright-field images of 9-week WT (n = 4) and SCA7 (n = 4) toluidine blue–stained XII (A) and phrenic (B) nerves. Scale bars: 30 μm. (C and D) Graphical representation of g-ratio, myelin thickness, axon area, and total axon area with myelin sheath of XII nerve (C) in 9-week WT (n = 5) and SCA7 (n = 7) mice and phrenic nerve (D) in 9-week WT (n = 6) and SCA7 (n = 7) mice. (E and F) Expression of Plp1 by qPCR in the medulla (E) and cervical spinal cord (F) of 9-week WT (n = 4) and SCA7 (n = 4) mice. (G and H) Transmission electron microscopy images of XII (G) and phrenic (H) nerves from 9-week WT (n = 4) and SCA7 (n = 4) mice. Yellow arrows indicate demyelination, red arrows indicate decompaction of the myelin sheath, yellow asterisks indicate smaller sized axons, and red asterisks indicate accumulation of vacuoles in the axons and Schwann cells surrounding the axons. Scale bars: 2 μm. (I) Heatmap highlights differentially expressed genes regulating myelin sheath activity pathway in 9-week WT (n = 5) and SCA7 (n = 5) medulla and cervical spinal cord (C3–C5 region of the spinal cord). (JO) Representative traces of WT (JL) and SCA7 (MO) XII nerve recordings at baseline (50% O2, 50% N2) and during a respiratory challenge (7% CO2, 21% O2/N2 balance). Expanded time-scale traces of the 10-second recording are shown for baseline (K and N) and challenge (L and O). (P) Graphical representation of XII nerve amplitude at baseline. The graph represents percentage of baseline for the amplitude of XII nerve amplitude of WT (n = 4) and SCA7 (n = 5) mice. Percentage of baseline was calculated as (challenge – baseline)/baseline × 100. (Q) Graphical representation of the frequency of XII nerve burst at baseline of WT (n = 4)and SCA7 (n = 5) mice. Data presented as mean ± SEM. **P < 0.01, ***P < 0.001, ****P < 0.0001 by 2-tailed Student’s t test.
Figure 5
Figure 5. Increase in neuromuscular junction (NMJ) clusters and higher expression of synaptic markers in SCA7 mice.
(A and B) Representative confocal images of 9-week WT (A) and SCA7 (B) diaphragms labeled with anti-ZNP1 (green, presynaptic marker), α-bungarotoxin (red, postsynaptic marker), and anti–neurofilament heavy chain (anti–NF-H, purple). Scale bars: 10 μm. (C) Graphical representation of the average number of NMJ clusters collected from 5 different fields from WT (n = 6) and SCA7 (n = 6) mice, colocalization of presynaptic and postsynaptic markers using Pearson’s correlation coefficient in WT (n = 5) and SCA7 (n = 5) mice, and area of endplates of WT (n = 6) and SCA7 (n = 6) mice at 9 weeks of age. (D and E) Expression of postsynaptic makers (F and G), presynaptic markers (H and I), and neurofilament in the diaphragm and tongue of 9-week WT (n = 5) and SCA7 (n = 6) mice. Data presented as mean ± SEM. *P < 0.05, **P < 0.01 by 2-tailed Student’s t test.
Figure 6
Figure 6. Intranuclear accumulation of ataxin-7 in diaphragm and tongue.
(A and B) Representative images of 9-week WT and SCA7 diaphragm (A) and tongue (B) labeled with anti–ataxin-7 (red) and DAPI (blue). Scale bars: 90 μm. (C and D) Representative images of H&E-stained diaphragm (C) and tongue (D) of 9-week WT and SCA7 (n = 4/genotype). Black arrows show centralization of nuclei. Scale bars: 45 μm. (E) Expression of Tnfa, Tgfb, and S100b transcripts in 9-week WT and SCA7 diaphragm (n = 5/genotype) (E) and tongue (n = 6/genotype) (F).

References

    1. Michalik A, et al. Spinocerebellar ataxia type 7 associated with pigmentary retinal dystrophy. Eur J Hum Genet. 2004;12(1):2–15. doi: 10.1038/sj.ejhg.5201108. - DOI - PubMed
    1. Ansorge O, et al. Ataxin-7 aggregation and ubiquitination in infantile SCA7 with 180 CAG repeats. Ann Neurol. 2004;56(3):448–452. doi: 10.1002/ana.20230. - DOI - PubMed
    1. La Spada AR. Spinocerebellar ataxia type 7. In: Adam MP, Feldman J, Mirzaa GM, et al., eds. GeneReviews [Internet]. Seattle (WA): University of Washington, Seattle; 1998. Updated July 23, 2020.
    1. van de Warrenburg BP, et al. Striking anticipation in spinocerebellar ataxia type 7: the infantile phenotype. J Neurol. 2001;248(10):911–914. doi: 10.1007/s004150170082. - DOI - PubMed
    1. Johansson J, et al. Expanded CAG repeats in Swedish spinocerebellar ataxia type 7 (SCA7) patients: effect of CAG repeat length on the clinical manifestation. Hum Mol Genet. 1998;7(2):171–176. doi: 10.1093/hmg/7.2.171. - DOI - PubMed

MeSH terms