. 2025 Apr;45(4):617-629.
doi: 10.1177/0271678X241261946. Epub 2024 Jul 25.

Pericyte response to ischemic stroke precedes endothelial cell death and blood-brain barrier breakdown

Affiliations

Pericyte response to ischemic stroke precedes endothelial cell death and blood-brain barrier breakdown

Michaela Roth et al. J Cereb Blood Flow Metab. 2025 Apr.

Abstract

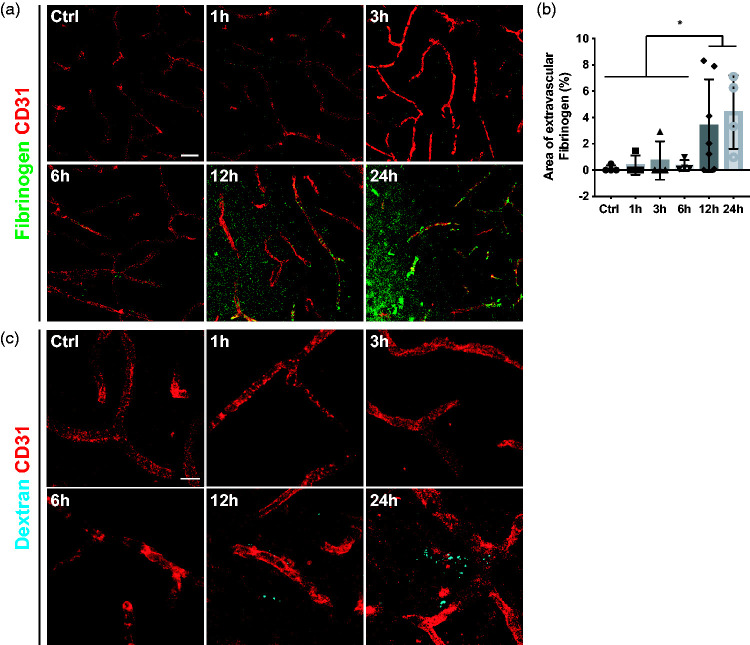
Stroke is one of the leading causes of death and disability, yet the cellular response to the ischemic insult is poorly understood limiting therapeutic options. Brain pericytes are crucial for maintaining blood-brain barrier (BBB) integrity and are known to be one of the first responders to ischemic stroke. The exact timeline of cellular events after stroke, however, remains elusive. Using the permanent middle cerebral artery occlusion stroke model, we established a detailed timeline of microvascular events after experimental stroke. Our results show that pericytes respond already within 1 hour after the ischemic insult. We find that approximately 30% of the pericyte population dies as early as 1 hour after stroke, while ca 50% express markers that indicate activation. A decrease of endothelial tight junctions, signs of endothelial cell death and reduction in blood vessel length are only detected at time points after the initial pericyte response. Consistently, markers of BBB leakage are observed several hours after pericyte cell death and/or vascular detachment. Our results suggest that the pericyte response to stroke occurs early and precedes both the endothelial response and the BBB breakdown. This highlights pericytes as an important target cell type to develop new diagnostic and therapeutic tools.

Keywords: Blood-brain barrier; endothelial cells; ischemia; pericytes; stroke.


Conflict of interest statement

Declaration of conflicting interestsThe author(s) declared no potential conflicts of interest with respect to the research, authorship, and/or publication of this article.

Figures

Figure 1.
Figure 1.
PDGFRß+ pericyte cell death occurs after 1 h of stroke. (a) Representative images of PDGFRß staining in the infarct core at different time points after stroke. The boxes in the left lower corner show higher magnification of a typical morphology of perivascular PDGFRß+ cells. The boxes in the right lower corner show higher magnification of morphologically abnormal PDGFRß+ cells. (b) 3D representation of PDGFRß+ pericytes (grey) that are positive for the apoptosis marker TUNEL (red). (c) Quantification of the number of PDGFRß+/TUNEL+ cells. (d) Quantification of the percentage of PDGFRß+ pericytes that are positive for TUNEL. n = 3–4. One-way ANOVA with Tukey’s multiple comparisons. Scale bar 20 µm and 10 µm.
Figure 2.
Figure 2.
Dynamics of pericyte detachment and changes in pericyte coverage after stroke. (a) Representative confocal images of pericytes (CD13, white) around vasculature (Podocalyxin, red) with nuclear marker DAPI (blue) at different time points after stroke. Higher magnification reveals that after 3 h, CD13+ pericytes detach from the vessels. (b) Quantification showing an increase of CD13+ pericyte coverage of the vasculature with a maximum at 3 h after stroke, n = 3–4. *p < 0.05. One-way ANOVA with Tukey’s multiple comparisons. Scale bar 20 µm and 10 µm.
Figure 3.
Figure 3.
Pericytes are activated and express NG2 from 1 h after stroke. (a) Representative confocal images showing the pericyte activation marker NG2+ cells (green), the classic pericyte marker CD13 (grey), and the vasculature (Podocalyxin, red). (b) Quantification of NG2+ pericytes at different time points after stroke. (c) Quantification showing the percentage of CD13+ pericytes that co-label with NG2. (d) 3D representative confocal images showing that NG2+ cells (green) do not co-label with TUNEL (red), n = 4. *p < 0.05. One-way ANOVA followed by Tukey’s multiple comparisons. Scale bar 20 µm and 10 µm.
Figure 4.
Figure 4.
Tight junction loss 12 h after stroke. (a) Western blot (WB) of protein lysates from mouse brain ipsilateral or contralateral hemispheres at indicated time points after stroke or sham surgery. Representative western blots probed for the endothelial TJ proteins ZO-1, Occludin or the loading control ß-Actin. (b–c) Quantification of ZO-1 (b) or Occludin (c) protein levels normalized to ß-Actin. Contralateral hemisphere WB band intensity was averaged for each time point across the 4 samples and ipsilateral band intensity from each time point was then divided by the respective averaged contralateral band. n = 4. *p < 0.05, **p < 0.01. Two-way ANOVA followed by Sidak’s multiple comparisons.
Figure 5.
Figure 5.
Delayed endothelial cell death and decrease in vessel length. (a) 3D representative confocal images showing that endothelial cells (CD31, cyan) are TUNEL+ (red) after 12 h. (b) Quantification of CD31+/TUNEL+ cells at different time points after stroke. (c) Representative confocal images of vasculature (CD31, cyan) at different time points after stroke. (d) Quantification of CD31+ vessel length showing a decrease in total vessel length after 24 h, n = 3–4. *p < 0.05, ****p < 0.0001 towards all other groups. One-way ANOVA with Tukey’s multiple comparisons. Scale bar 10 µm and 20 µm.
Figure 6.
Figure 6.
Substantial leakage at 12 h after stroke. (a) Representative confocal images of endothelial cell marker CD31 (red) and endogenous fibrinogen (green) showing increased fibrinogen accumulation after 12 h. (b) Quantification of extravascular Fibrinogen at different time points after stroke. (c) Confocal images of intravenously injected Dextran (cyan) and the endothelial marker CD31 (red) showing that vascular leakage occurred after 12 h, n = 4–7. *p < 0.05. One-way ANOVA with Tukey’s multiple comparisons. Scale bar 20 µm and 10 µm.
Figure 7.
Figure 7.
Schematics on the timeline of early microvascular events after pMCAO, based on the current study, and possible underlying pericytes signaling mechanisms, based on available literature. ↑ indicates an increased expression in the markers. 1 hour after pMCAO, pericytes either undergo apoptosis or become activated. Based on existing literature including studies both in vivo and in vitro mimicking stroke in co-culture with endothelial cells or conditioned media models, pericytes have been reported to express or upregulate markers such as RGS5, NG2, NF-κB, ANGPT1, TGFβ1, MMP9. These molecules have been linked to subsequent effects on BBB disruption and endothelial cells survival. Among those, RGS5 is the only molecule expressed exclusively by pericytes in the brain. In hypoxic environments, RGS5 regulates pericyte detachment from the vascular wall and migration into the brain parenchyma, leading to decreased vessel coverage, lower vascular density, loss of TJs and BBB breakdown. Since pericytes play an essential role in the formation and maintenance of the TJ both in vivo and in vitro, early pericyte death can also be linked to the decrease in TJs. pMCAO = permanent occlusion of the middle cerebral artery; RGS5 = regulator of G-protein signalling 5; NG2 = neural-glia antigen 2; NF-κB = nuclear factor kappa-B; ANGPT1 = angiopoietin-1; TGFβ1 = transforming growth factor beta; MMP9 = matrix metalloproteinases 9 –, –,,, –. Created with BioRender.com, 05 April 2024.

References

    1. Timmis A, Townsend N, Gale C, ESC Scientific Document Group et al. European society of cardiology: Cardiovascular disease statistics 2017. Eur Heart J 2018; 39: 508–579. - PubMed
    1. Campbell BCV, Mitchell PJ, Investigators E-I, Endovascular therapy for ischemic stroke. N Engl J Med 2015; 372: 2365–2366. - PubMed
    1. Hacke W, Kaste M, Bluhmki E, ECASS Investigators et al. Thrombolysis with alteplase 3 to 4.5 hours after acute ischemic stroke. N Engl J Med 2008; 359: 1317–1329. - PubMed
    1. Jiang X, Andjelkovic AV, Zhu L, et al. Blood-brain barrier dysfunction and recovery after ischemic stroke. Prog Neurobiol 2018; 163-164: 144–171. - PMC - PubMed
    1. Larrue V, von Kummer R, del Zoppo G, et al. Hemorrhagic transformation in acute ischemic stroke. Potential contributing factors in the european cooperative acute stroke study. Stroke 1997; 28: 957–960. - PubMed

LinkOut - more resources