. 2024 Oct;634(8034):669-676.
doi: 10.1038/s41586-024-07849-4. Epub 2024 Jul 25.

Spillover of highly pathogenic avian influenza H5N1 virus to dairy cattle

Affiliations

Spillover of highly pathogenic avian influenza H5N1 virus to dairy cattle

Leonardo C Caserta et al. Nature. 2024 Oct.

Abstract

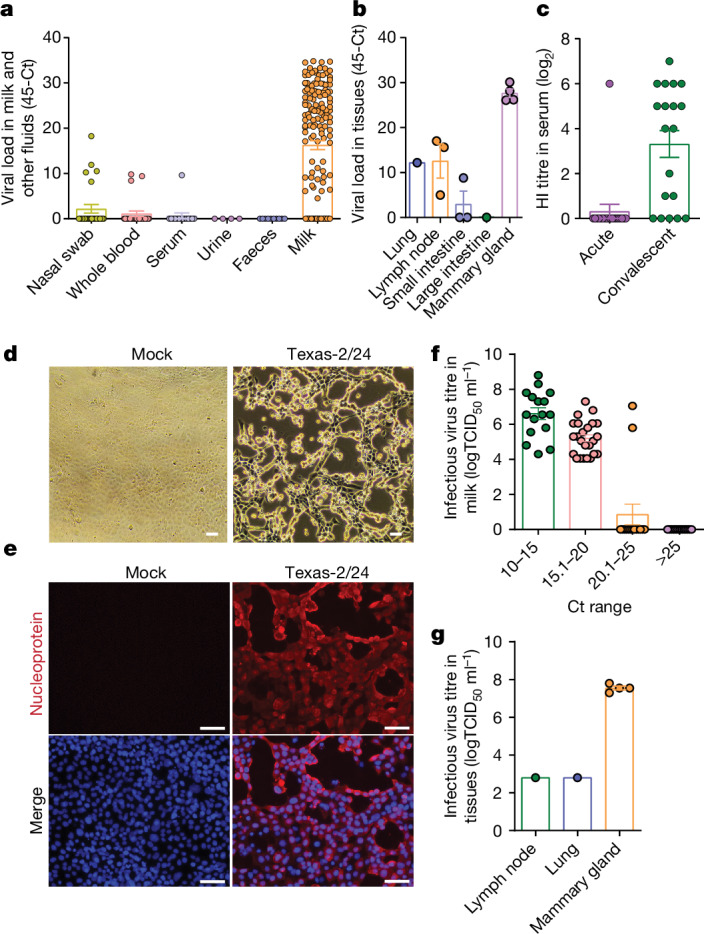
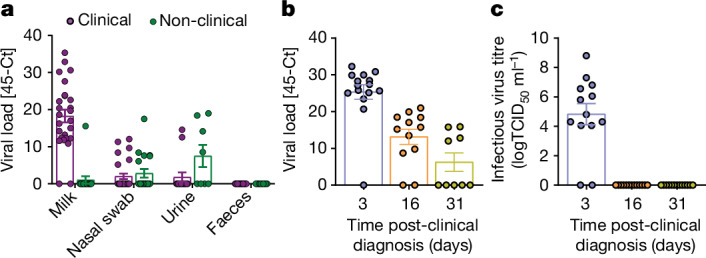
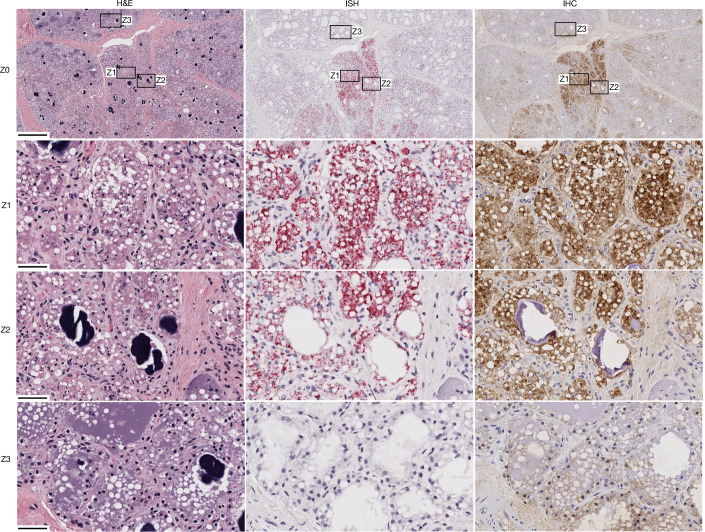
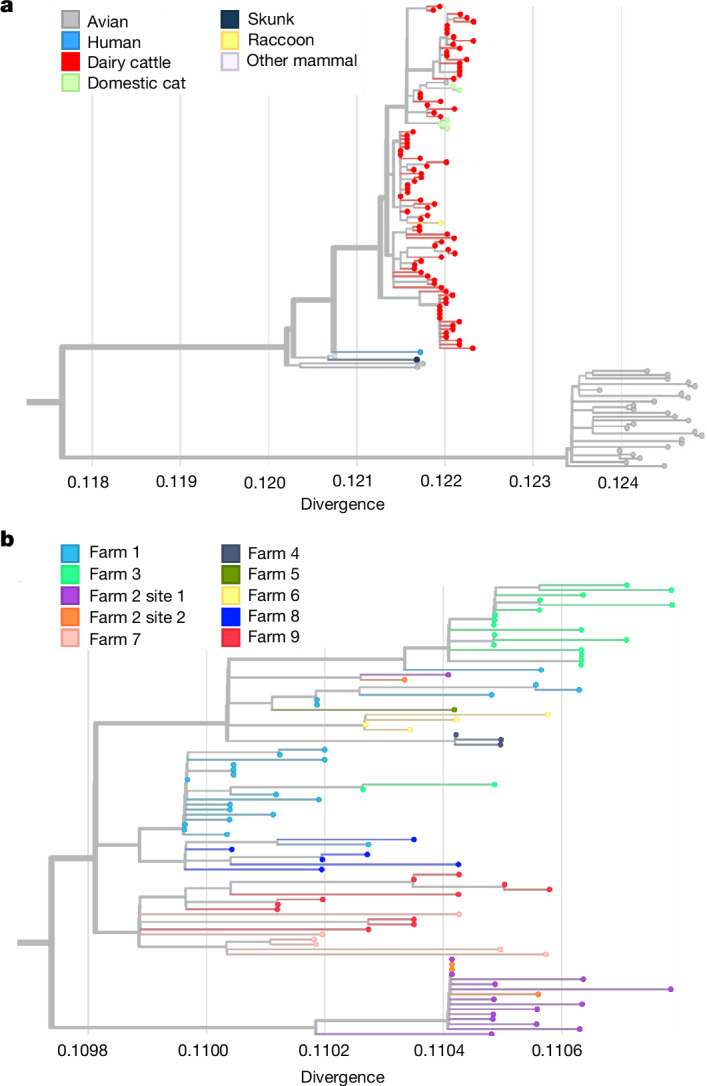
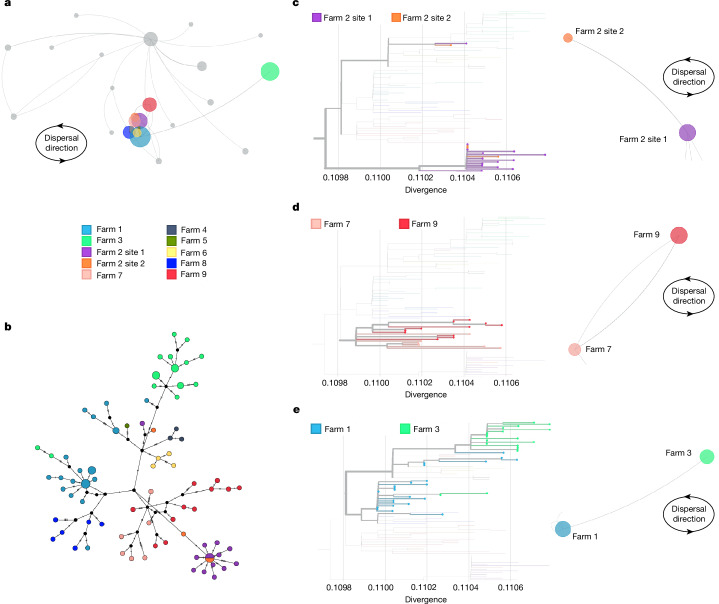
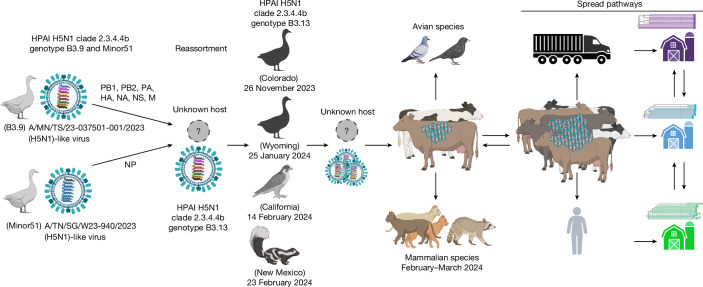
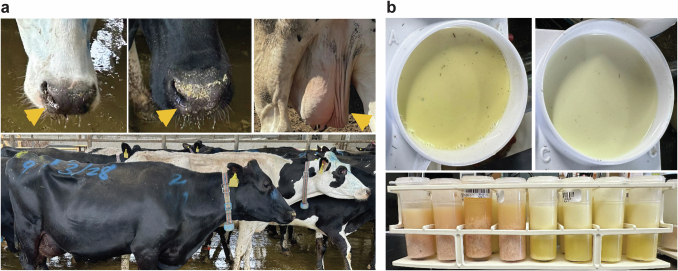
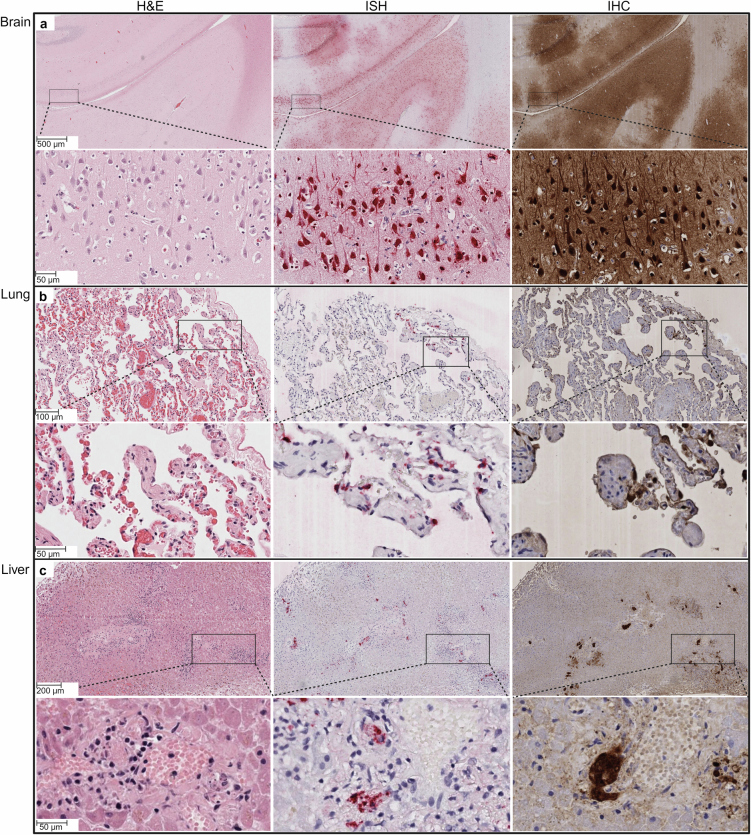
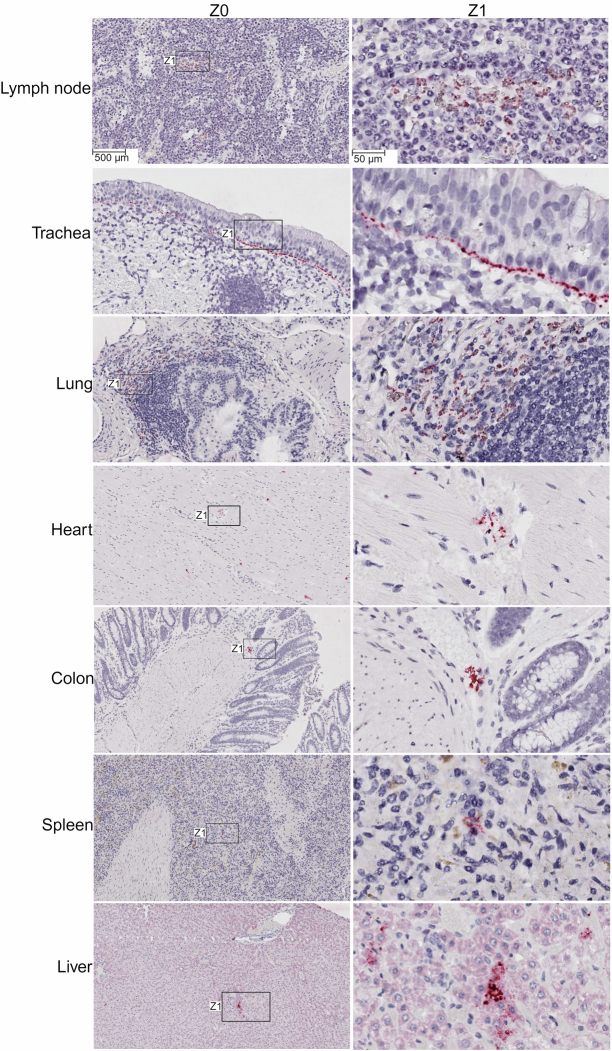
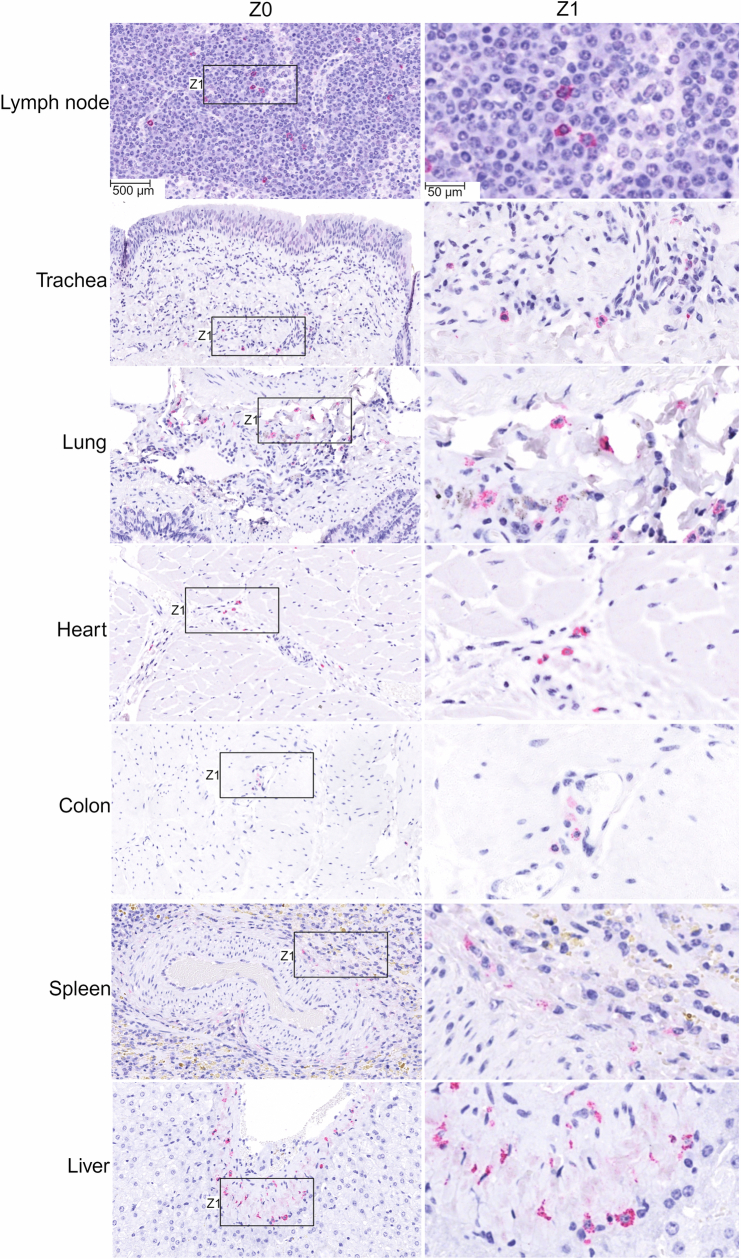
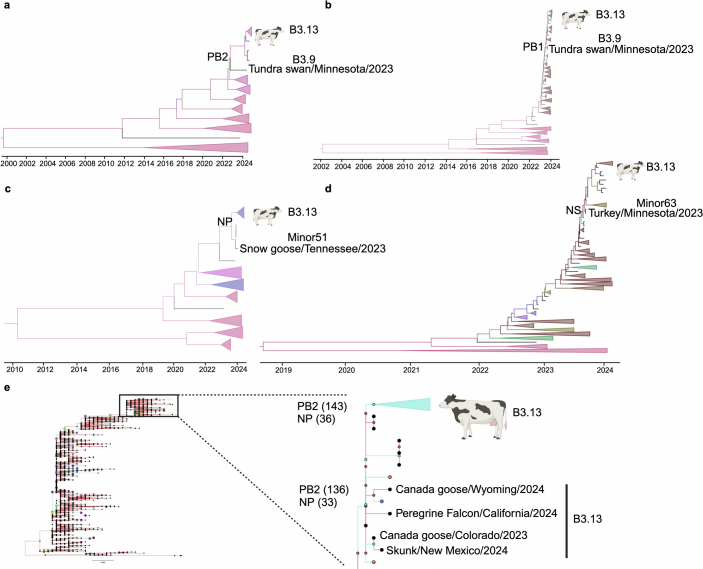
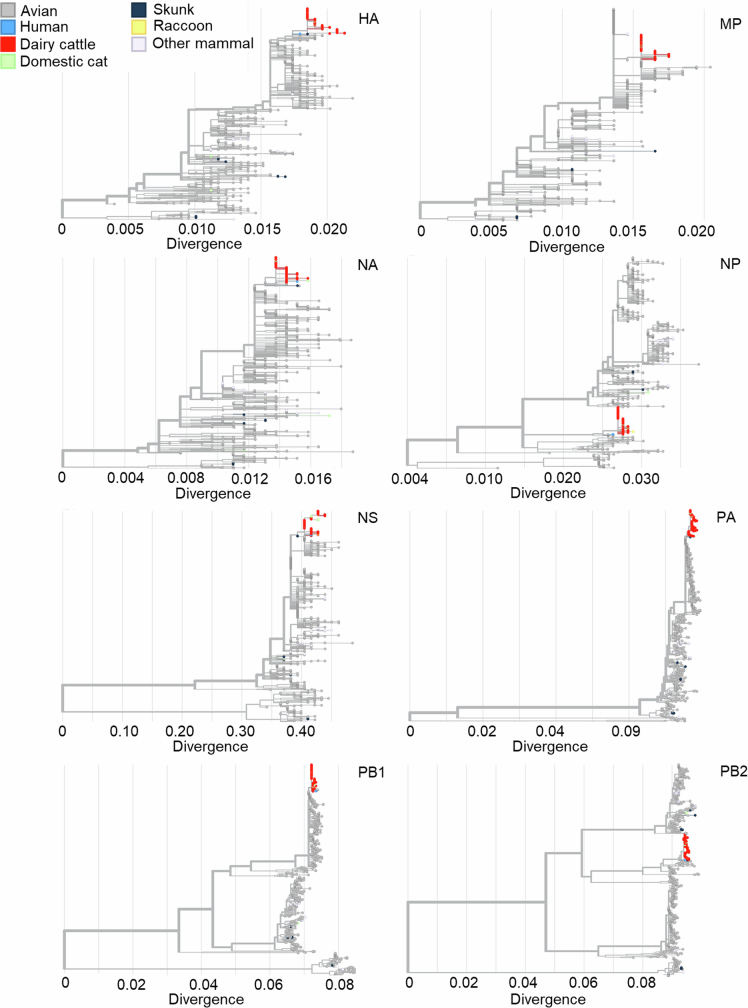
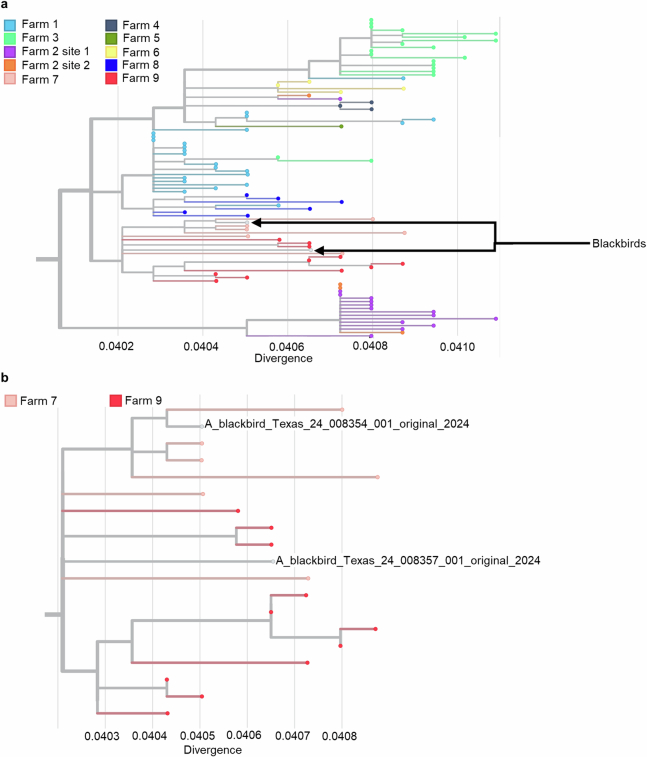
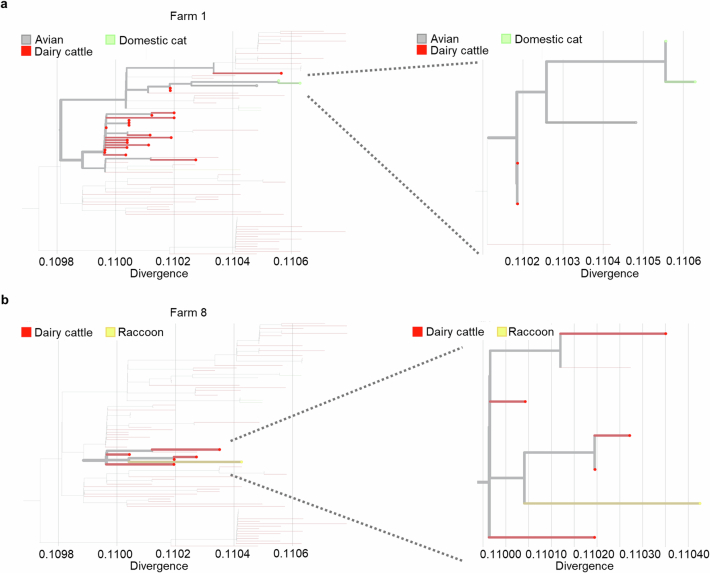
The highly pathogenic avian influenza (HPAI) H5N1 virus clade 2.3.4.4b has caused the death of millions of domestic birds and thousands of wild birds in the USA since January 2022 (refs. 1-4). Throughout this outbreak, spillovers to mammals have been frequently documented5-12. Here we report spillover of the HPAI H5N1 virus to dairy cattle across several states in the USA. The affected cows displayed clinical signs encompassing decreased feed intake, altered faecal consistency, respiratory distress and decreased milk production with abnormal milk. Infectious virus and viral RNA were consistently detected in milk from affected cows. Viral distribution in tissues via immunohistochemistry and in situ hybridization revealed a distinct tropism of the virus for the epithelial cells lining the alveoli of the mammary gland in cows. Whole viral genome sequences recovered from dairy cows, birds, domestic cats and a raccoon from affected farms indicated multidirectional interspecies transmissions. Epidemiological and genomic data revealed efficient cow-to-cow transmission after apparently healthy cows from an affected farm were transported to a premise in a different state. These results demonstrate the transmission of the HPAI H5N1 clade 2.3.4.4b virus at a non-traditional interface, underscoring the ability of the virus to cross species barriers.


Conflict of interest statement

The authors declare no competing interests.

Figures

Fig. 1
Fig. 1. Detection and isolation of HPAI H5N1 from dairy cattle.
a, Viral RNA loads in nasal swab (n = 27), whole-blood (n = 25), serum (n = 15), urine (n = 4), faecal (n = 10) and milk (n = 167) samples collected from cattle from farms 1 to 9 quantified by rRT–PCR targeting the IAV matrix gene. b, Viral RNA loads in tissues of dairy cattle quantified by rRT–PCR targeting the IAV matrix gene. c, Serum antibody responses in affected cattle (n = 19) quantified by a haemagglutination inhibition (HI) assay. d, Cytopathic effect of the HPAI H5N1 virus isolated from milk in bovine uterine epithelial cells Cal-1. The photomicrographs shown are representative of two independent clinical samples. Scale bar, 50 µm. e, Detection of the infectious HPAI virus in Cal-1 cells by an immunofluorescence assay using a nucleoprotein-specific monoclonal antibody (red) counterstained with 4′,6-diamidino-2-phenylindole (DAPI, blue). The photomicrographs shown are representative of two independent clinical samples. Scale bar, 50 µm. f,g, Infectious HPAI H5N1 virus in milk (n = 69; f) and tissues (g) detected by virus titration. Virus titres were determined using end point dilutions and expressed as 50% tissue culture infectious dose (TCID50) per millilitre (TCID50 ml−1). The limit of detection for infectious virus titration was 101.05 TCID50 ml−1. Data are presented as mean ± s.e.m (ac,f,g). All graphs and statistical analysis were generated using GraphPad Prism (v10). Source Data
Fig. 2
Fig. 2. Virus shedding patterns.
a, Viral shedding and RNA load in milk (n = 41), nasal secretions (nasal swabs, n = 45), urine (n = 23) and faeces (n = 25) collected from clinical and non-clinical animals from farm 3. b, Viral RNA loads in milk samples collected from cattle from farm 3 on day 3 (n = 15), day 16 (n = 12) and day 31 (n = 9) post-clinical diagnosis quantified by rRT–PCR targeting the IAV matrix gene. c, Infectious HPAI virus in milk (n = 13 on day 3, n = 12 on day 16 and n = 9 on day 31) detected by virus titration. Virus titres were determined using end point dilutions and expressed as TCID50 ml−1. The limit of detection for infectious virus titration was 101.05 TCID50 ml−1. Data are presented as mean ± s.e.m. All graphs and statistical analysis were generated using GraphPad Prism (v10). Source Data
Fig. 3
Fig. 3. Detection of HPAI H5N1 in dairy cattle mammary gland tissue.
Haematoxylin and eosin (H&E) staining (left panels) showing intraluminal epithelial sloughing and cellular debris in mammary alveoli (Z1 and Z2), and normal mammary alveoli filled with milk and fat globules (Z3). In situ hybridization (ISH; middle panels) targeting the IAV (matrix gene) showing extensive viral RNA in milk-secreting epithelial cells in the alveoli and in intraluminal cellular debris (Z1 and Z2), and normal mammary alveoli showing no viral staining (Z3). Immunohistochemistry (IHC; right panels) targeting the IAV matrix gene showing intracytoplasmic immunolabelling of viral antigen in milk-secreting alveolar epithelial cells (Z1 and Z2), and normal mammary alveoli showing no viral staining (Z3). Scale bars, 500 µm (Z0) and 50 µm (Z1–Z3).
Fig. 4
Fig. 4. Phylogenetic analysis of HPAI H5N1.
a, Phylogeny of sequences derived from cattle, cats, raccoon and grackle sampled in the farms described in this study, and other sequences in closer ancestral branches, obtained from the GISAID database. Nodes are coloured by host species. b, Detailed view of the clade containing 91 sequences derived from animals sampled in the farms described in this study. Nodes are coloured by farm. All phylogenomic analyses were conducted with concatenated whole-genome sequences.
Fig. 5
Fig. 5. Interstate and local dispersal of the HPAI H5N1 genotype B3.13 between farms.
a, HPAI H5N1 virus dispersal in North America. Samples described in this study are coloured by farm, whereas locations in grey represent samples from closer ancestral branches obtained from the GISAID database. b, Haplotype network analysis of HPAI H5N1 viral sequences obtained from the farms described in this study. The different colours indicate different farms. The size of each vertex is relative to the number of samples, and the dashes on branches denote the number of mutations between nodes. ce, Phylogenetic reconstruction and analysis of dispersal between sites 1 and 2 of farm 2 (c), farms 7 and 9 (d), and farms 1 and 3 (e). The directions of dispersal lines are counterclockwise. All phylogenomic and dispersal analyses were conducted with concatenated whole-genome sequences.
Fig. 6
Fig. 6. Model of spillover and spread of the HPAI H5N1 genotype B3.13 into dairy cattle.
A reassortment event in an unknown host species led to the emergence of the H5N1 genotype B3.13, which circulated in wild birds and mammals before infecting dairy cattle. Following spillover of H5N1 into dairy cattle, the virus was able to establish infection and efficiently transmit from cow to cow (intraspecies transmission) and from cow to other species, including wild (great tailed grackles) and peridomestic (pigeons) birds and mammals (cats and raccoons; interspecies transmission). The spread of the virus between farms occurred by the movement of cattle between farms, and probably by movement of wild birds and fomites including personnel, shared farm equipment and trucks (feed, milk and/or animal trucks). The model was created using BioRender (https://biorender.com).
Extended Data Fig. 1
Extended Data Fig. 1. Clinical presentation of HPAI H5N1 infection in dairy cattle.
a, Clinically affected animals presenting clear nasal discharge and involution of the mammary gland/udder (gold arrowheads, top images) and depression (bottom images). b, Milk from HPAI H5N1 infected animals presenting yellowish colostrum-like color and appearance (top panels) or coloration varying from yellowish to pink/brown color. Curdling of milk visible in some samples.
Extended Data Fig. 2
Extended Data Fig. 2. Highly pathogenic avian influenza H5N1 virus detection in cat tissues.
Hematoxylin and eosin (H&E) staining (left panels) showing; a, multifocal area of perivascular cuffing, vascular congestion, and perivascular edema (Z0), neuronal swelling and neuronal necrosis and perivascular edema in brain (Z1, Z2 and Z3). b, pulmonary edema with strands of fibrin, thickened alveolar septa and intraepithelial lymphocytes, alveolar capillary congestion. c, single cell necrosis and hemorrhage in liver. In situ hybridization (ISH) (middle panels) targeting Influenza A virus (Matrix gene) showing (a) multifocal areas with extensive viral RNA (Z0), in neurons and glial cells within the granular layer and nuclear and intracytoplasmic viral RNA in neuronal soma, axon, and vascular endothelial cells in brain (Z1, Z2 and Z3), b, viral RNA in bronchiolar epithelial cells and type II pneumocytes, and c, viral RNA in resident sinusoidal Kupffer cells and vascular endothelial cells. Immunohistochemistry (IHC) (right panels) targeting Influenza A virus M gene showing immunolabeling of (a) multifocal areas of immunolabeling (Z0), intracytoplasmic immunolabeling of viral antigen in neuronal soma and axons within granular layer in brain (Z1, Z2 and Z3), b, bronchiolar epithelial cells and type II pneumocytes in lung, and c, vascular endothelial cells and resident sinusoidal Kupffer cells. Tissues from one cat were available and subjected to histological, ISH and IHC analysis.
Extended Data Fig. 3
Extended Data Fig. 3. Highly pathogenic avian influenza H5N1 virus RNA detection in cow tissues.
In situ hybridization of viral RNA in mononuclear cells of lymphoid follicles in lymph node, mononuclear cells of bronchial associated lymphoid tissue (BALT) in the lung, endothelial cells of blood vessels in the heart, endothelial cells of blood vessels in the colon, mononuclear cells in the spleen and endothelial cells and resident sinusoidal Kupffer cells in the liver. The zoom in (Z1) represents the demarcated area in the left panels (Z0). Tissues from three cows were available and subjected to histological, ISH and IHC analysis.
Extended Data Fig. 4
Extended Data Fig. 4. Highly pathogenic avian influenza H5N1 virus antigen detection in cow tissues.
Immunohistochemical staining of viral antigen in mononuclear cells of lymphoid follicles in lymph node, mononuclear cells of bronchial associated lymphoid tissue (BALT) in the lung, endothelial cells of blood vessels in the heart, endothelial cells of blood vessels in the colon, mononuclear cells in the spleen and endothelial cells and resident sinusoidal Kupffer cells in the liver. The zoom in (Z1) represents the demarcated area in the left panels (Z0). Tissues from three cows were available and subjected to histological, ISH and IHC analysis.
Extended Data Fig. 5
Extended Data Fig. 5. Bayesian analysis and estimation of reassortment events leading to emergence of HPAI H5N1 virus clade 2.3.4.4b genotype B3.13.
Estimation of tMRCA and immediate descendants of MRCA donors of PB2 (a), PB1 (b), NP (c) and NS (d) genes, respectively. e, Reassortment event of PB2 and NP which lead to emergence of genotype 3.13 in an unknown host before detection in skunk, avian species, and dairy cattle. The teal color of branches indicates the reassortment event.
Extended Data Fig. 6
Extended Data Fig. 6. Phylogenetic analysis of HPAI H5N1 viruses.
Phylogenetic trees constructed with each influenza A virus genome segment, comprising 91 sequences of samples described in this study and 648 sequences of samples collected throughout the American continent, collected between January 2023 and March 2024, available at the GISAID EpiFlu database.
Extended Data Fig. 7
Extended Data Fig. 7. Wild bird sequences HPAI H5N1 are related to sequences from cows in affected dairy farms.
a, Genetic relationship of HPAI H5N1 sequences recovered from blackbirds with sequences recovered from cattle in Farms 7 and 9. Nodes are colored by premise and all the samples collected in the referred farm are highlighted. b, Detailed/zoom in view of the sequence clusters containing samples from Farm 7, Farm 9 and sequences from blackbirds collected at 8–12 Km from Farm 7. Analysis was conducted based on whole concatenated genome sequences.
Extended Data Fig. 8
Extended Data Fig. 8. Evidence of interspecies transmission of HPAI H5N1.
a, Close phylogenetic relationship between HPAI H5N1 sequences recovered from dairy cows, great-tailed grackles, and cat in Farm 1. b, Close phylogenetic relationship between HPAI H5N1 sequences recovered from dairy cows and a racoon in Farm 8. Nodes are colored by host and all the samples collected in the specific farm are highlighted. Panels on the right are a detailed view of the clusters containing more than one host species. Analysis was conducted based on whole concatenated genome sequences.

Similar articles

Cited by

References

    1. Kandeil, A. et al. Rapid evolution of A(H5N1) influenza viruses after intercontinental spread to North America. Nat. Commun.14, 3082 (2023). - PMC - PubMed
    1. Youk, S. et al. H5N1 highly pathogenic avian influenza clade 2.3.4.4b in wild and domestic birds: introductions into the United States and reassortments, December 2021–April 2022. Virology587, 109860 (2023). - PubMed
    1. USDA–APHIS. Detections of highly pathogenic avian influenza in wild birds. USDA–APHIShttps://www.aphis.usda.gov/livestock-poultry-disease/avian/avian-influen... (2024).
    1. USDA–APHIS. Confirmations of highly pathogenic avian influenza in commercial and backyard flocks. USDA–APHIShttps://www.aphis.usda.gov/livestock-poultry-disease/avian/avian-influen... (2024).
    1. Puryear, W. et al. Highly pathogenic avian influenza A(H5N1) virus outbreak in New England seals, United States. Emerg. Infect. Dis.29, 786–791 (2023). - PMC - PubMed

MeSH terms