. 2024 Jul 24;12(7):e009550.
doi: 10.1136/jitc-2024-009550.

Immune cell topography of head and neck cancer

Affiliations

Immune cell topography of head and neck cancer

Tara Muijlwijk et al. J Immunother Cancer. .

Abstract

Background: Approximately 50% of head and neck squamous cell carcinomas (HNSCC) recur after treatment with curative intent. Immune checkpoint inhibitors are treatment options for recurrent/metastatic HNSCC; however, less than 20% of patients respond. To increase this response rate, it is fundamental to increase our understanding of the spatial tumor immune microenvironment (TIME).

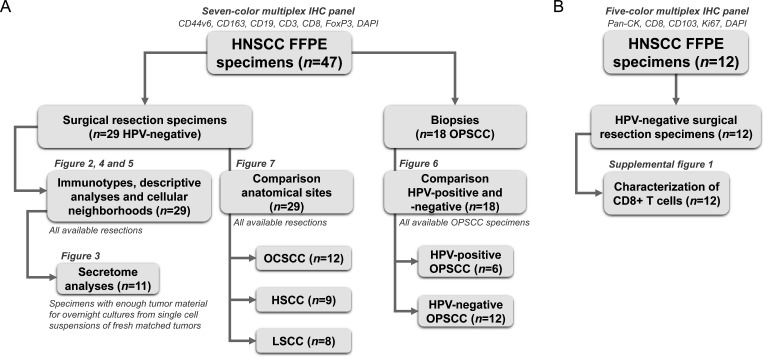
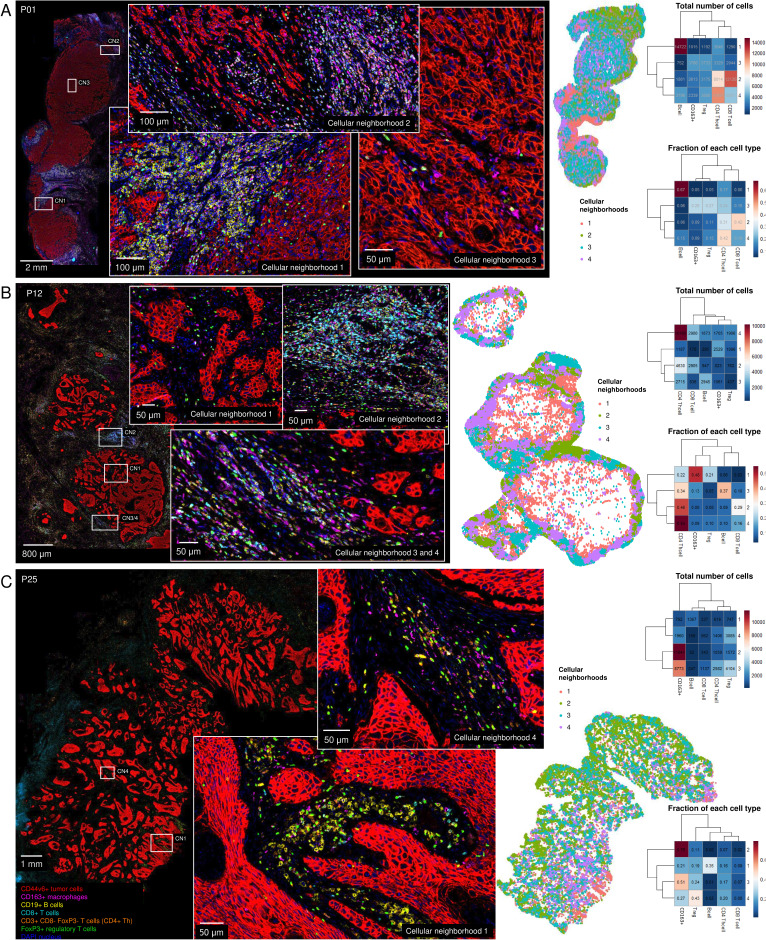
Methods: In total, 53 HNSCC specimens were included. Using a seven-color multiplex immunohistochemistry panel we identified tumor cells, CD163+macrophages, B cells, CD8+T cells, CD4+T helper cells and regulatory T cells (Tregs) in treatment-naive surgical resection specimens (n=29) and biopsies (n=18). To further characterize tumor-infiltrating CD8+T cells, we stained surgical resection specimens (n=12) with a five-color tumor-resident panel including CD103, Ki67, CD8 and pan-cytokeratin. Secretome analysis was performed on matched tumor suspensions (n=11) to measure protein levels.

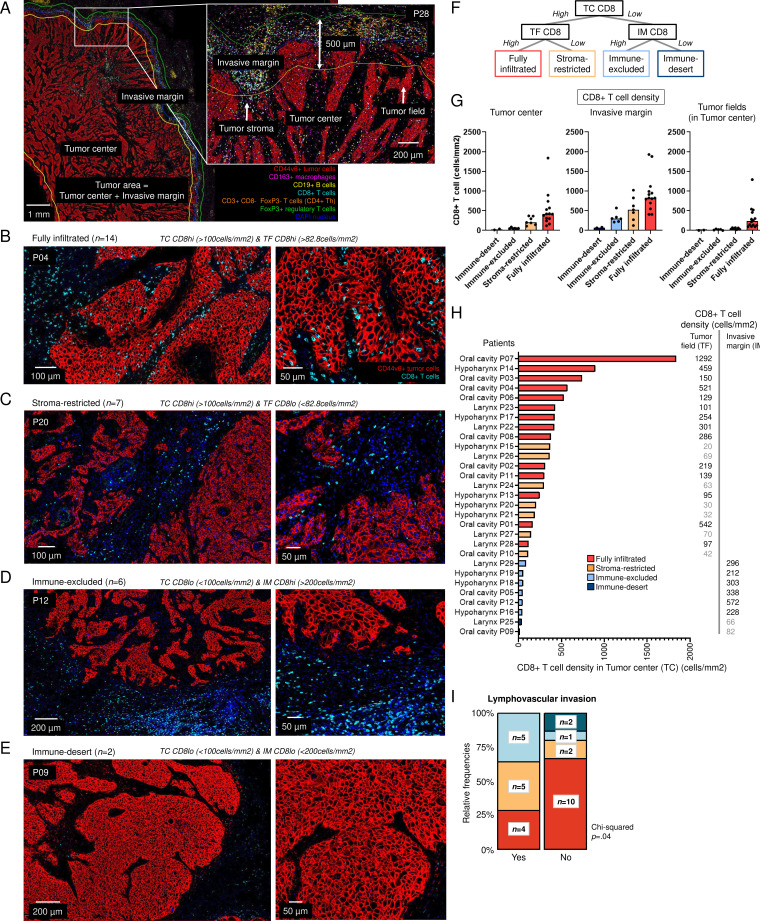
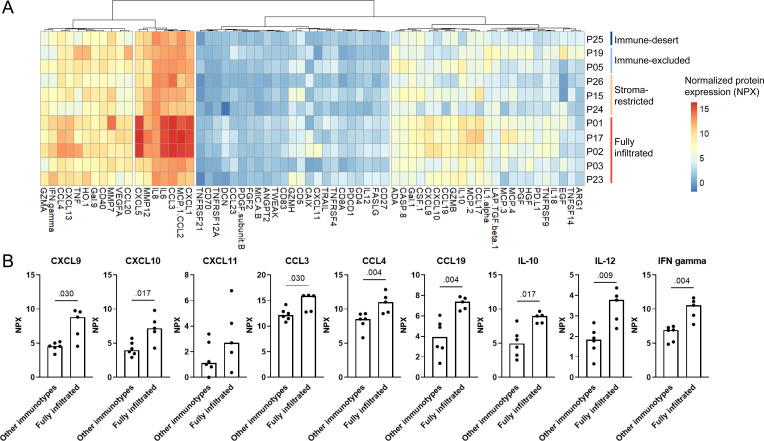
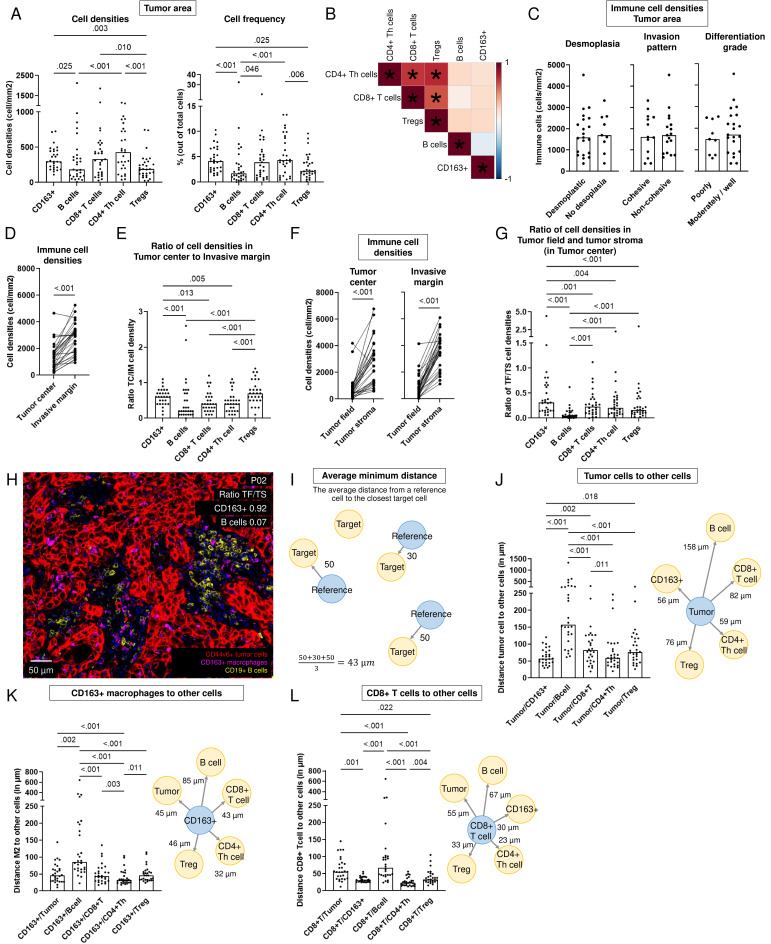
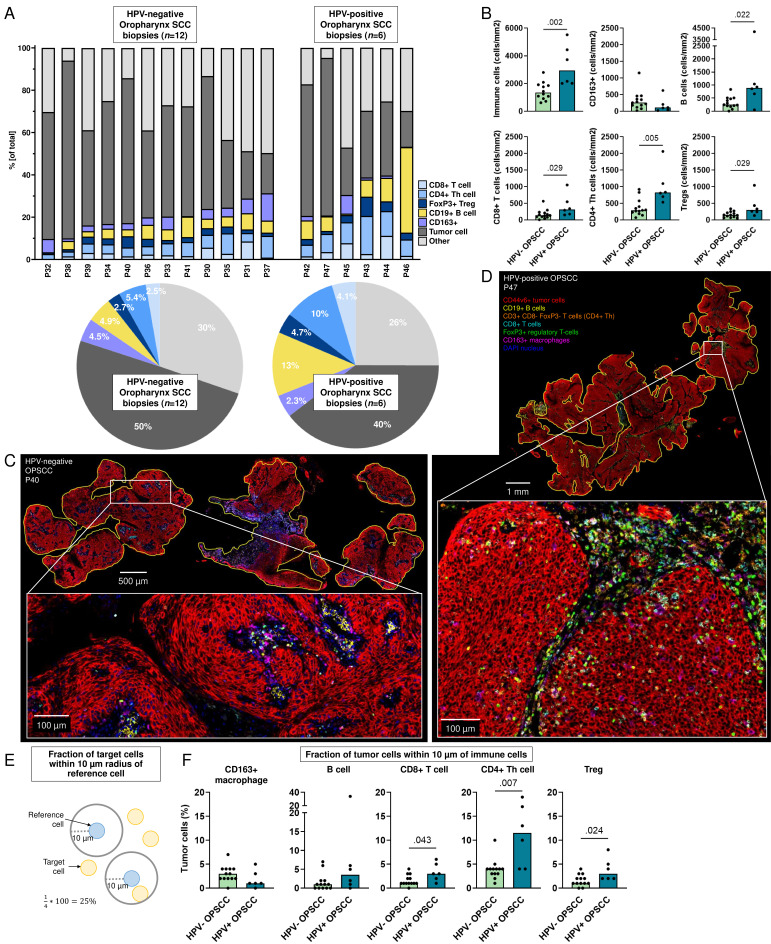
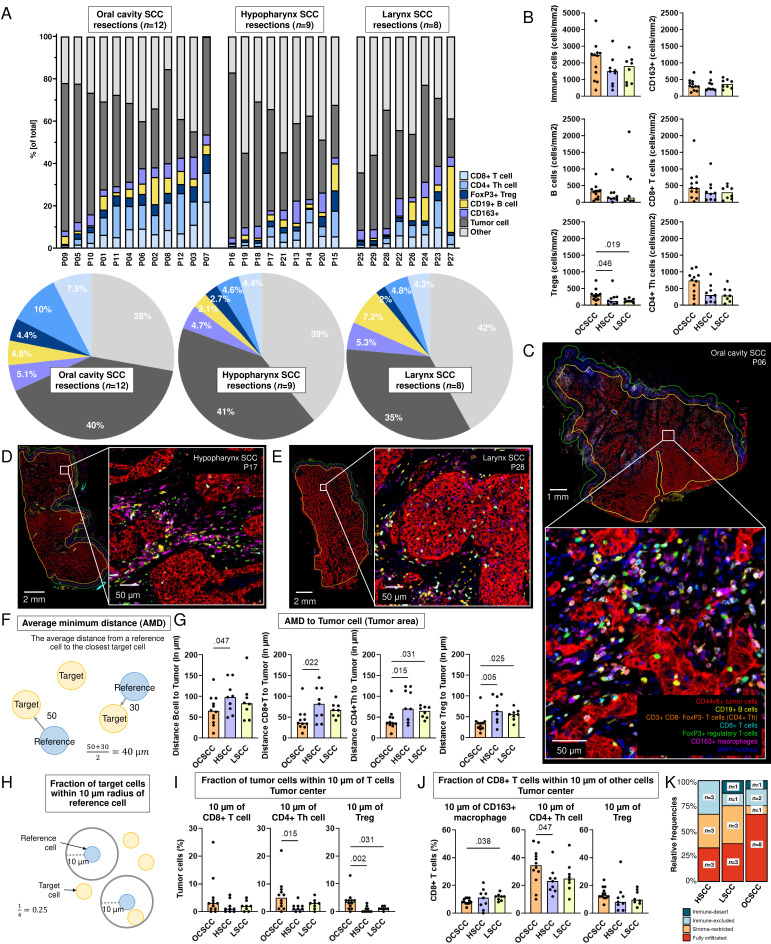
Results: Based on CD8+T cell infiltrates, we identified four different immunotypes: fully infiltrated, stroma-restricted, immune-excluded, and immune-desert. We found higher cytokine levels in fully infiltrated tumors compared with other immunotypes. While the highest immune infiltrates were observed in the invasive margin for all immune cells, CD163+macrophages and Tregs had the highest tendency to infiltrate the tumor center. Within the tumor center, especially B cells stayed at the tumor stroma, whereas CD163+macrophages, followed by T cells, were more often localized within tumor fields. Also, B cells were found further away from other cells and often formed aggregates while T cells and CD163+macrophages tended to be more closely located to each other. Across resection specimens from various anatomical sites within the head and neck, oral cavity tumors exhibited the highest densities of Tregs. Moreover, the distance from B cells and T cells to tumor cells was shortest in oral cavity squamous cell carcinoma (OCSCC), suggesting more interaction between lymphocytes and tumor cells. Also, the fraction of T cells within 10 µm of CD163+macrophages was lowest in OCSCC, indicating fewer myeloid/T-cell suppressive interactions in OCSCC.

Conclusions: We comprehensively described the TIME of HNSCC using a unique data set of resection specimens. We discovered that the composition, as well as the relative localization of immune cells in the TIME, differed in distinct anatomical sites of the head and neck.

Keywords: B cell; Head and Neck Cancer; Macrophage; T cell; Tumor microenvironment - TME.


Conflict of interest statement

Competing interests: None declared.

Figures

Figure 1
Figure 1. Flowchart of head and neck squamous cell carcinoma (HNSCC) cohort used in this study. (A) 47 HNSCC formalin-fixed paraffin-embedded (FFPE) specimens were stained using a seven-color multiplex immunohistochemistry (IHC) panel to distinguish CD44v6+tumor cells, CD163+macrophages, CD19+B cells, CD8+T cells, CD3+CD8− FoxP3− T cells (CD4+T helper cells) and FoxP3+regulatory T cells. 29 out of those 47 were HPV-negative surgical resection specimens. These resection specimens were used for assigning immunotypes (figure 2), descriptive analyses (figure 4), and immune cellular neighborhoods (figure 5). For 11 out of the 29 tumors, secretome data was available of overnight cultures from matched fresh single-cell suspensions (figure 3). All 29 resection specimens were used to compare the TIME from different anatomical sites: OCSCC (n=12), hypopharynx SCC (HSCC, n=9) and larynx SCC (LSCC, n=8, figure 7). Lastly, 18 out of 47 HNSCC FFPE specimens were oropharynx SCC (OPSCC) biopsies for the comparison between the TIME of HPV-positive (n=6) and HPV-negative (n=12) OPSCC (figure 6). (B) 12 HNSCC FFPE specimens were stained using a five-color multiplex IHC panel to distinguish pan-cytokeratin (pan-CK)+tumor cells, CD103+tumor-resident, CD103− recruited, Ki67+proliferating and Ki67− non-proliferating CD8+T cells. All 12 resections were used for the characterization of infiltrating CD8+T cells (online supplemental figure 2). 6 out of those 12 specimens overlapped between the seven-color and five-color multiplex IHC panels, explaining the total number of 53 unique specimens. HHPV, human papillomavirus; OCSCC, oral cavity SCC; TIME, tumor immune microenvironment.
Figure 2
Figure 2. Immunotypes across 29 human papillomavirus-negative head and neck squamous cell carcinoma (HNSCC) resection specimens. (A) Representative image of tumor P28 with tumor center, invasive margin, tumor fields and tumor stroma. The following cells could be distinguished: CD44v6+tumor cells, CD163+macrophages, CD19+B cells, CD8+T cells, CD3+CD8 T cells (CD4+T helper cells) and FoxP3+regulatory T cells. (B–E) Representative images of tumors with (B) fully infiltrated (P04), (C) stroma-restricted (P20), (D) immune-excluded (P12), and (E) immune-desert (P09) immunotype. (F) Decision tree for assigning immunotypes and immunotypes based on CD8+T cell density in tumor center, invasive margin and tumor fields. (G) CD8+T cell densities (cells/mm2, y-axis) across immune-desert, immune-excluded, stroma-restricted and fully infiltrated HNSCC (x-axis). (H) 29 HNSCC resection specimens were assigned as infiltrated when the density of CD8+T cells in the tumor center (TC, x-axis) was higher than 100 cells/mm2. If the density of CD8+T cells in the tumor field (TF) was higher than the median density of 82.8 cells/mm2, tumor were assigned as fully infiltrated (red) and when lower than 82.8 cells/mm2, as stroma-restricted (orange). If the density was lower than 100 cells/mm2 in the tumor center but higher than 200 cells/mm2 in the invasive margin (IM), tumors were defined as immune-excluded (light blue) and when lower than 200 cells/mm2, as immune-desert (dark blue). (I) Relative frequencies and number of specimens per immunotype with the presence of lymphovascular invasion. Χ2 test was performed to obtain p value. Fully infiltrated immunotype compared with other immunotypes since groups were too small.
Figure 3
Figure 3. Immunotypes and secretomes across 11 HPV-negative head and neck squamous cell carcinoma resection specimens. (A) Hierarchical clustering of normalized protein expression (NPX) levels of 64 proteins (x-axis) measured in overnight supernatants of matched fresh single-cell suspensions from 11 tumors (y-axis). (B) Secretome comparison between fully infiltrated tumors versus other immunotypes. Protein levels (in normalized protein expression (NPX) values) measured in overnight cultures of 100,000 single cells from matched tumors on y-axis, in fully infiltrated tumors (n=5) and tumors with other immunotypes (immune-desert n=1, immune-excluded n=2 and stroma-restricted n=3) on x-axis, p values obtained by unpaired non-parametric Mann-Whitney tests, bars represent median. CCL, CC motif chemokine ligand; CXCL, C-X-C motif chemokine ligand; IFN, interferon; IL, interleukin.
Figure 4
Figure 4. Spatial tumor immune microenvironment of 29 HPV-negative head and neck squamous cell carcinoma (HNSCC) resection specimens. (A) Densities (in cells/mm2) and frequency of total cells in tumor area of CD163+macrophages, B cells, CD8+T cells, CD4+T helper cells and Tregs. A paired non-parametric Friedman test was performed with uncorrected Dunn’s test to obtain p values. Bars represent the median. (B) Pearson correlation matrix with correlation coefficient from −1 (blue) to 1 (red) of immune cell densities in tumor area of 29 HPV-negative HNSCC resection specimens. P values<0.05 indicated with *. (C–D) Immune cell density (in cells/m2, y-axis) (C) across histological parameters (x-axis), p values obtained by an unpaired non-parametric Mann-Whitney test and (D) in the tumor center versus the invasive margin (x-axis), p value obtained by a paired non-parametric Wilcoxon test. (E) Ratio of immune cell density between tumor center (TC) and invasive margin (IM) for CD163+macrophages, B cells, CD8+T cells, CD4+T helper cells and Tregs. A paired non-parametric Friedman test was performed with uncorrected Dunn’s test to obtain p values. (F) Immune cell density (in cells/m2, y-axis) in tumor fields and tumor stroma (x-axis) of the tumor center (left) and in the invasive margin (right), p value obtained by a paired non-parametric Wilcoxon test. (G) Ratio of immune cell density between tumor field (TF) and tumor stroma (TS) in the tumor center for CD163+macrophages, B cells, CD8+T cells, CD4+T helper cells and Tregs. A paired non-parametric Friedman test was performed with uncorrected Dunn’s test to obtain p values. Bars represent the median. (H) Representative image with CD163+macrophages infiltrating into tumor fields and B cells predominantly in the tumor stroma example of tumor with a ratio CD163+macrophages in tumor field to tumor stroma of 0.92 and a ratio B cells in tumor field to tumor stroma of 0.07 (P02). (I) Schematic overview of calculation of the average minimum distance from a reference cell (in blue) to the nearest target cells (in yellow). (J–L) Distance (in µm, y-axis) of (J) Tumor cells, (K) CD163+macrophages and (L) CD8+T cells to other cells in the tumor area (x-axis) in left panels. A paired non-parametric Friedman test was performed with uncorrected Dunn’s test to obtain p values. Bars represent the median. A schematic overview in the right panel with distance from reference to the target cell, median over 29 resection specimens shown. HPV, human papillomavirus; Treg, regulatory T cells.
Figure 5
Figure 5. Immune cellular neighborhood analysis for 29 human papillomavirus-negative head and neck squamous cell carcinoma resection specimens. Neighboring cells in a radius of 50 µm were calculated using imcRtools. For each tumor, four neighborhoods were calculated. (A–C) Representative images of tumors from (A) P01, (B) P12, and (C) P25 with an animated map of immune cellular neighborhoods, a heatmap with total number of cells per neighborhood and a heatmap with the fraction of each cell type per neighborhood (blue to red, y-axis) per cluster (x-axis). Neighborhood analysis of remaining tumors can be found in online supplemental figures 8 and 9. Treg, regulatory T cells.
Figure 6
Figure 6. Spatial tumor immune microenvironment of HPV-negative and HPV-positive oropharynx SCC (OPSCC). (A) Fraction of tumor and immune cells out of total cells (y-axis) in biopsies from patients with HPV-negative and HPV-positive OPSCC (x-axis). Pie charts of the average percentage of cells in 12 HPV-negative (left panel) and 6 HPV-positive OPSCC biopsies. (B) Densities of immune cells (cells/mm2, y-axis) in HPV-negative and HPV-positive OPSCC (x-axis), p values obtained by unpaired non-parametric Mann-Whitney tests, bars represent median values. (C–D) Representative image of (C) HPV-negative (P40) and (D) HPV-positive (P47) OPSCC stained with seven-color multiplex immunohistochemistry Opal panel to identify CD44v6+tumor cells, CD163+macrophages, CD19+B cells, CD8+T cells, CD3+CD8− FoxP3− (CD4+T helper) cells and FoxP3+regulatory T cells (Tregs). (E) Schematic representation of radius analysis where the fraction of target cells (in yellow) located within 10 µm of a reference cell (in blue) was calculated. (F) Percentage of tumor cells (y-axis) within 10 µm of CD163+macrophage, B cell, CD8+T cell, CD4+T helper (Th) cell and Treg for 12 HPV-negative (HPV−) and 6 HPV-positive (HPV+) biopsies, p values obtained by unpaired non-parametric Mann-Whitney tests, bars represent median values. HPV, human papillomavirus; SCC, squamous cell carcinoma.
Figure 7
Figure 7. Comparison of 29 human papillomavirus-negative resection specimens from distinct anatomical sites along the head and neck region. (A) Fraction of tumor and immune cells out of total cells (y-axis) in tumor area of surgical resection specimens from patients with oral cavity squamous cell carcinoma (OCSCC, n=12), hypopharynx SCC (HSCC, n=9), and larynx SCC (LSCC, n=8, x-axis). Pie charts of the average percentage of cells in the tumor area of 12 OCSCC (left panel), 9 HSCC (middle panel), and 8 LSCC (right panel) surgical resection specimens. (B) Densities of immune cells in tumor area (cells/mm2, y-axis) of OCSCC, HSCC and LSCC (x-axis). (C–E) Representative images of (C) OCSCC (P06), (D) HSCC (P17), and (E) LSCC (L28) stained with seven-color multiplex immunohistochemistry Opal panel to identify CD44v6+tumor cells, CD163+macrophages, CD19+B cells, CD8+T cells, CD3+CD8− FoxP3− (CD4+T helper (Th)) cells and FoxP3+regulatory T cells (Tregs). (F) Schematic overview of calculation of average minimum distance (AMD) from a reference cell (in blue) to the nearest target cells (in yellow). (G) Distance (in µm, y-axis) of B cells, CD8+T cells, CD4+Th cells, and Tregs to tumor cells in the tumor area from OCSCC, HSCC, and LSCC resection specimens (x-axis). (H) Schematic representation of radius analysis where the fraction of target cells (in yellow) located within 10 µm of a reference cell (in blue) was calculated. (I) Fraction of tumor cells (y-axis) within 10 µm of CD8+T cell, CD4+Th cell, and Treg in tumor center of OCSCC, HSCC, and LSCC resections. (J) Fraction of CD8+T cells (y-axis) within 10 µm of CD163+macrophage, CD4+Th cell, and Treg in tumor center of OCSCC, HSCC, and LSCC resections. Unpaired non-parametric Kruskal-Wallis tests with uncorrected Dunn’s tests were performed to obtain p values, bars represent median values. (K) Relative frequencies and number of specimens (y-axis) classified as fully infiltrated (red), stroma-restricted (orange), immune-excluded (light blue), or immune-desert (dark blue) per anatomical site (x-axis).

References

    1. Sung H, Ferlay J, Siegel RL, et al. Global cancer statistics 2020: GLOBOCAN estimates of incidence and mortality worldwide for 36 cancers in 185 countries. CA Cancer J Clin. 2021;71:209–49. doi: 10.3322/caac.21660. - DOI - PubMed
    1. Leemans CR, Snijders PJF, Brakenhoff RH. The molecular landscape of head and neck cancer. Nat Rev Cancer. 2018;18:269–82. doi: 10.1038/nrc.2018.11. - DOI - PubMed
    1. Ang KK, Harris J, Wheeler R, et al. Human papillomavirus and survival of patients with oropharyngeal cancer. N Engl J Med. 2010;363:24–35. doi: 10.1056/NEJMoa0912217. - DOI - PMC - PubMed
    1. Ferris RL, Blumenschein G, Fayette J, et al. Nivolumab vs investigator’s choice in recurrent or metastatic squamous cell carcinoma of the head and neck: 2-year long-term survival update of CheckMate 141 with analyses by tumor PD-L1 expression. Oral Oncol. 2018;81:45–51. doi: 10.1016/j.oraloncology.2018.04.008. - DOI - PMC - PubMed
    1. Mehra R, Seiwert TY, Gupta S, et al. Efficacy and safety of pembrolizumab in recurrent/metastatic head and neck squamous cell carcinoma: pooled analyses after long-term follow-up in KEYNOTE-012. Br J Cancer. 2018;119:153–9. doi: 10.1038/s41416-018-0131-9. - DOI - PMC - PubMed

MeSH terms