. 2024 Aug 28;44(35):e0198242024.
doi: 10.1523/JNEUROSCI.0198-24.2024.

TFEB/3 Govern Repair Schwann Cell Generation and Function Following Peripheral Nerve Injury

Affiliations

TFEB/3 Govern Repair Schwann Cell Generation and Function Following Peripheral Nerve Injury

Akash A Patel et al. J Neurosci. .

Abstract

TFEB and TFE3 (TFEB/3), key regulators of lysosomal biogenesis and autophagy, play diverse roles depending on cell type. This study highlights a hitherto unrecognized role of TFEB/3 crucial for peripheral nerve repair. Specifically, they promote the generation of progenitor-like repair Schwann cells after axonal injury. In Schwann cell-specific TFEB/3 double knock-out mice of either sex, the TFEB/3 loss disrupts the transcriptomic reprogramming that is essential for the formation of repair Schwann cells. Consequently, mutant mice fail to populate the injured nerve with repair Schwann cells and exhibit defects in axon regrowth, target reinnervation, and functional recovery. TFEB/3 deficiency inhibits the expression of injury-responsive repair Schwann cell genes, despite the continued expression of c-jun, a previously identified regulator of repair Schwann cell function. TFEB/3 binding motifs are enriched in the enhancer regions of injury-responsive genes, suggesting their role in repair gene activation. Autophagy-dependent myelin breakdown is not impaired despite TFEB/3 deficiency. These findings underscore a unique role of TFEB/3 in adult Schwann cells that is required for proper peripheral nerve regeneration.

Keywords: Runx2; Schwann cell; c-Jun; myelin; regeneration; sciatic nerve injury.


Conflict of interest statement

The authors declare no competing financial interests.

Figures
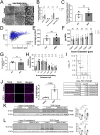
Figure 1.
Figure 1.
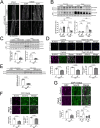
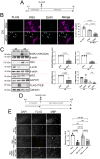
TFEB/3 expression increases in response to nerve injury. A, Representative toluidine blue stained semithin images of control and Tfeb/3 SC-dKO intact sciatic nerves at P14 (left) and 3–4 months (P90–110; center). Scale bar, 5 µm. Representative transmission electron micrographs of intact sciatic nerves of control and Tfeb/3 SC-dKO of mice aged P90–110. Scale bar, 2 µm. B, Graph of percentages of abnormal myelin sheaths categorized as infolds, outfolds, focal thickenings, or degenerated myelin of mice aged P90–110. n = 3–4, tinfold(5) = 1.507, toutfold(5) = 0.22946, tfocal thickening(5) = 1.672, tdegenerate(5) = 0.2175, multiple unpaired t tests. C, Graph of percentage of large diameter axons that show signs of degeneration (shriveled or darkened appearance) of mice aged P90–110. n = 3, t(4) = 0.5905, unpaired t test. D, Graph of g-ratios of intact sciatic nerves of control (black open circles) and Tfeb/3 SC-dKO (blue open squares) of mice aged P90–110 (left). E, Average g-ratio of control and Tfeb/3 SC-dKO nerves (right). n = 3, t(4) = 0.3028, unpaired t test. F, Binned g-ratios of control and Tfeb/3 SC-dKO nerves (right). n = 3, t0–2(4) = 0.08022, t2–3(4) = 0.06084, t3–4(4) = 0.4832, t4–5(4) = 0.09103, t>5(4) = 1.041, Multiple unpaired t tests. G, Average number of axons per Remak bundle of mice aged P90–110. n = 3, t(4) = 0.2672, unpaired t test. H, Binned axon frequency per non-myelinating Schwann cell. n = 3, t1(4) = 0.718, t2–5(4) = 0.3394, t6–10(4) = 0.5162, t11–15(4) = 0.2051, t15–20(4) = 0.2480, t20–25(4) = 0.3517, t>25(4) = 1.082, multiple unpaired t tests. I, Volcano plot of DEGs in Tfeb/3 SC-dKO versus control intact nerves (top) of mice aged P90–110. DEGs with Log2FC ≥ |1| and padj ≤ 0.05 represented as red circles; all others represented as gray x's. Select genes marked with black label. Table of DEGs (bottom). J, Representative immunostaining images of control intact and 1DPI distal nerves for TFEB (magenta) and DAPI (blue). Scale bar, 20 µm. Graph of TFEB+ cell percentage. n = 3, t(4) = 5.126, unpaired t test. K, Western blot of TFEB in intact contralateral and 7DPI distal nerves of control and Tfeb/3 SC-dKO. n = 3, FInteraction(1,8) = 2.769, Finjury(1,8) = 32.35, Fgenotype(1,8) = 17.54, two-way ANOVA with Šídák's multiple-comparisons test. L, Western blot of TFE3 in intact contralateral and 7DPI distal nerves of control and Tfeb/3 SC-dKO. n = 3, FInteraction(1,8) = 4.832, Finjury(1,8) = 8.41, Fgenotype(1,8) = 102.6, two-way ANOVA with Šídák's multiple-comparisons test.
Figure 2.
Figure 2.
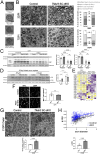
TFEB/3 deficiency impairs transcriptional reprogramming toward repair Schwann cell formation. A, Venn diagram comparing genes that failed to be properly downregulated between Tfeb/3 SC-dKO versus control 5DPI distal nerves (blue) and downregulated genes between control distal versus control intact (red) and Tfeb/3 SC-dKO distal versus Tfeb/3 SC-dKO intact nerves (green; left). Venn diagram comparing genes that failed to be properly upregulated between Tfeb/3 SC-dKO versus control 5DPI distal nerves (blue) and upregulated genes between control distal versus control intact (red) and Tfeb/3 SC-dKO distal versus Tfeb/3 SC-dKO intact nerves (green; right). See Extended Data Table 2-1 for list of DEGs. B, Heat map of all 1,051 DEGs between 5DPI distal Tfeb/3 SC-dKO versus control nerves. C, Volcano plots of DEGs in Tfeb/3 SC-dKO versus control 5DPI distal nerves. DEGs with Log2FC > |1| and padj ≤ 0.05 represented as red circles; all others represented as gray x's. See Extended Data Table 2-1 for the list of DEGs. D, KEGG pathway analysis of 475 DEGs that failed to downregulate between Tfeb/3 SC-dKO versus control 5DPI distal nerves (left). KEGG pathway analysis of 576 DEGs that failed to upregulate between Tfeb/3 SC-dKO versus control 5DPI distal nerves (right). E, Table of GSEA enrichment scores of Tfeb/3 SC-dKO versus control 5DPI distal nerves of MSigDB gene sets for embryonic stem cell modules, cell cycle, and regulation by polycomb repressive complex. F, GSEA enrichment plot of Tfeb/3 SC-dKO versus control distal nerves for “Apical Junctions” from MSigDB Hallmarks. G, GSEA enrichment plot of Tfeb/3 SC-dKO versus control distal nerves for “Reactome S-phase” (top). GSEA enrichment plot of Tfeb/3 SC-dKO versus control distal nerves for “G2 M Checkpoint” from MSigDB Hallmarks (bottom). H, GO term biological processes for 576 downregulated DEGs between Tfeb/3 SC-dKO versus control distal nerves (left). GO term biological processes for 475 upregulated DEGs between Tfeb/3 SC-dKO versus control distal nerves (right).
Figure 3.
Figure 3.
Repair Schwann cell generation and proliferation are impaired in the absence of TFEB/3. A, Representative immunostaining images of control and Tfeb/3 SC-dKO intact, 3DPI, and 7DPI distal nerves for p75-NGFR. Intact contralateral nerves have been modified with a higher brightness for visualization. 3DPI and 7DPI distal nerves were imaged with the same settings. Scale bar, 100 µm. B, Western blot of p75-NGFR in proximal and distal 3DPI (top and left graph) or 7DPI nerves (bottom and right graph) of control and Tfeb/3 SC-dKO. n = 3, 3DPI: FInteraction(1,8) = 15.18, Finjury(1,8) = 1.742, Fgenotype(1,8) = 1.828, 7DPI: FInteraction(1,8) = 8.586, Finjury(1,8) = 30.27, Fgenotype(1,8) = 8.242, two-way ANOVA with Šídák's multiple-comparisons test. C, Western blot of RUNX2 in proximal and distal 3DPI (top and left graph) or 7DPI nerves (bottom and right graph) nerves of control and Tfeb/3 SC-dKO. n = 3, 3DPI: t(4) = 5.494, 7DPI: t(4) = 3.221, unpaired t test. D, Representative immunostaining images of control and Tfeb/3 SC-dKO 3DPI distal nerves for RUNX2 (gray) and DAPI (blue; top) and 7DPI distal nerves for RUNX2 (magenta) and SOX10 (green; bottom). Scale bar, 20 µm. Graphs of RUNX2+ cell percentage or RUNX2+;SOX10+ cells in the SOX10+ population. n = 3, 3DPI: t(4) = 3.38, 7DPI: tRUNX2/DAPI(4) = 6.054, tRUNX2:SOX10/SOX10(4) = 6.904, unpaired t test. E, Western blot of SOX2 in intact contralateral and 7DPI distal nerves of control and Tfeb/3 SC-dKO. n = 3, t(4) = 14.08, unpaired t test. F, Representative immunostaining images of control and Tfeb/3 SC-dKO 7DPI distal nerves for SOX2 (magenta) and SOX10 (green). Scale bar, 20 µm. Graph of SOX2+ cell percentage and SOX2+;SOX10+ cells of SOX10+ population. n = 3, 7DPI: tSOX2/DAPI(4) = 4.42, tSOX2:SOX10/SOX10(4) = 3.029, unpaired t test. G, Representative immunostaining images of control and Tfeb/3 SC-dKO 3DPI distal nerves for Ki67 (magenta) and SOX10 (green). Scale bar, 20 µm. Graph of percentage of Ki67+;SOX10+ cells of SOX10+ population (left). n = 3, t(4) = 4.579, unpaired t test. Graph of SOX10+ cells per 1mm2 (right) of distal 3DPI and 7DPI nerves. n  =  3, FInteraction(1,8) = 8.407, Finjury(1,8) = 20.71, Fgenotype(1,8) = 8.213, two-way ANOVA with Šídák's multiple-comparisons test. Data represented as mean ± SEM, ns = not significant, significant p values displayed in graphs.
Figure 4.
Figure 4.
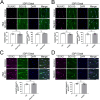
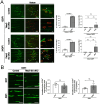
Tfeb SC-KO and Tfe3KO nerves display unaltered repair Schwann cell protein expression. A, Representative immunostaining images of control and Tfeb SC-KO 3DPI distal nerves for RUNX2 (magenta), SOX10 (green), and DAPI (blue). Scale bar, 20 µm. Graphs of RUNX2+ cell percentage (left) or RUNX2+;SOX10+ cells in the SOX10+ population (right). n = 3, tRUNX2/DAPI(4) = 0.172, tRUNX2:SOX10/SOX10(4) = 1.261, unpaired t test. B, Representative immunostaining images of control and Tfe3KO 3DPI distal nerves for RUNX2 (magenta), SOX10 (green), and DAPI (blue). Scale bar, 20 µm. Graphs of RUNX2+ cell percentage (left) or RUNX2+;SOX10+ cells in the SOX10+ population (right). n = 3, tRUNX2/DAPI(4) = 1.589, tRUNX2:SOX10/SOX10(4) = 0.4664, unpaired t test. C, Representative immunostaining images of control and Tfeb SC-KO 3DPI distal nerves for SOX2 (magenta), SOX10 (green), and DAPI (blue). Scale bar, 20 µm. Graph of SOX2+;SOX10+ cells in the SOX10+ population. n = 3, t(4) = 0.8796, unpaired t test. D, Representative immunostaining images of control and Tfe3KO 3DPI distal nerves for SOX2 (magenta), SOX10 (green), and DAPI (blue). Scale bar, 20 µm. Graph of SOX2+;SOX10+ cells in the SOX10+ population. n = 3, t(4) = 0.1284, unpaired t test. Data represented as mean ± SEM, ns = not significant, significant p-values displayed in graphs.
Figure 5.
Figure 5.
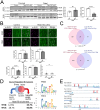
Deficiency in repair Schwann cell generation occurs despite continuous presence of c-Jun. A, Western blots of c-JUN proximal and distal 3DPI (top and left graph) and 7DPI (bottom and right graph) nerves of control and Tfeb/3 SC-dKO. n = 3, unpaired t test. B, Representative immunostaining images of control and Tfeb/3 SC-dKO 3DPI and 7DPI nerves for c-JUN (magenta) and SOX10 (green). Scale bar, 25 µm. Graphs of SOX10+ cell percentage and c-JUN+;SOX10+ cell percentage of SOX10+ population at 3DPI (top) and 7DPI (bottom left and center). n = 3, 3DPI: tSOX10/DAPI(4) = 0.2926, tc-JUN:SOX10/SOX10(4) = 1.605, 7DPI: tSOX10/DAPI(4) = 3.542, tc-JUN:SOX10/SOX10(4) = 0.6085, unpaired t test. Graph of c-JUN fluorescent intensity normalized to control mean. Black closed circles represent mean percentage per biological replicate. Open gray circles represent individual nuclei. n = 3, t(4) = 0.4632, unpaired t test. C, Venn diagrams of Tfeb/3 SC-dKO 5DPI (red) and c-Jun SC-KO 7DPI (blue) comparing genes that failed to properly upregulate (top) and failed to properly downregulate (bottom). p values displayed below Venn diagrams. Hypergeometric test. See Extended Data Table 5-1. D, Injury-induced enhancer sequences revealed in a previous study of nerve injury in rat sciatic nerves (Hung et al., 2015) examined for enrichment of TFEB and TFE3 motifs and the indicated percentage of injury-induced enhancers (InjuryDB) had TFE motifs. A comparison of enhancers that are diminished after injury (ShamDB) shows a lower percentage of TFE motifs. E, Profiles of injury-induced enhancers through analysis of the active enhancer mark H3K27ac, in sham or injured nerve in the Runx2, Hmga2, p75-Ngfr, and Met genes. The pink shaded injury-induced enhancers have TFEB/TFE3 motifs. Data represented as mean ± SEM, ns = not significant, significant p values displayed in graphs.
Figure 6.
Figure 6.
TFEB activation triggers myelin loss. A, Representative immunostaining images for FLAG (yellow), TFEB (magenta), and DAPI (cyan) of undifferentiated FLAG-TFEBS211A Schwann cells after 48 h of doxycycline treatment. Arrowheads indicate FLAG+ cells. Scale bar, 20 µm. Graph of percentage of pixels of TFEB+ expression area of total nuclear area. Black closed circles represent mean percentage per biological replicate. Open gray circles represent individual nuclei. n = 3, F(2,6) 119.4, ordinary one-way ANOVA with Tukey's multiple-comparisons test. B, Time course of FLAG-TFEBS211A Schwann cell differentiation. Doxycycline addition indicated with arrow. Cells examined at d0, d5, d6, or d7. C, Representative immunostaining images for FLAG (yellow), PRX (magenta), and DAPI (cyan) of d5 and d7 differentiated Schwann cells. Arrowheads indicate FLAG+ cells. Scale bar, 50 µm. n = 3, F(3,8) = 15.55, ordinary one-way ANOVA with Tukey's multiple-comparisons test. D, Representative immunostaining images for FLAG (yellow), RUNX2 (magenta), and DAPI (cyan) at d5 and d7 in differentiated Schwann cells. Arrowheads indicate FLAG+ cells. Scale bar, 50 µm. n = 3, F(6,14) = 26.79, ordinary one-way ANOVA with Tukey's multiple-comparisons test. E, Representative immunostaining images for FLAG (yellow), EGR2 (KROX20; magenta), and DAPI (cyan) at d7 in differentiated Schwann cells. Merged image of EGR2 (KROX20) and DAPI. Scale bar, 20 µm. Graph of EGR2 (KROX20) nucleoplasmic expression at d5 and d7 ± Dox differentiated cultures. n = 3, F(3,8) = 96.35, ordinary one-way ANOVA with Tukey's multiple-comparisons test. F, Western blot of c-JUN at d0, d5, d6, and d7 in Schwann cell differentiation cultures. n = 3, F(5,12) = 97.71, ordinary one-way ANOVA with Tukey's multiple-comparisons test. G, Myelination time course of SC-DRG cocultures. Doxycycline addition indicated by arrow. Cells examined at d21 and d25. H, Representative immunostaining images for FLAG, MBP, and DAPI in d21 and d25 SC-DRG cocultures. Scale bar, 50 µm. n = 3, F(2,4) = 12.61, RM one-way ANOVA with Tukey's multiple-comparisons test. Data represented as mean ± SEM, ns = not significant, significant p values displayed in graphs.
Figure 7.
Figure 7.
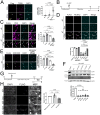
TFEB activation inhibits Schwann cell differentiation and myelination. A, Differentiation time course of FLAG-TFEBS211A Schwann cells. Doxycycline addition indicated by arrow. Cells examined at d0 and d5. B, Representative immunostaining images for FLAG (yellow), PRX (magenta), and DAPI (cyan) at d5 ± Dox of Schwann cell differentiation cultures. Arrowheads indicate FLAG+ cells. Scale bar, 50 µm. n = 3, F(2,6) = 19.37, ordinary one-way ANOVA with Tukey's multiple-comparisons test. C, Western blots of EGR2 (KROX20), PRX, MPZ, c-JUN, and FLAG at d0 and d5 in Schwann cell differentiation cultures. Dashed lines separate individual membranes from separate gel electrophoresis runs. n = 3, tEGR2(4) = 6.892, tPRX(4) = 12.31, tMPZ(4) = 3.29, unpaired t test for EGR2 (KROX20), PRX, and MPZ. n = 3, F(3,8) = 4.612, ordinary one-way ANOVA with Tukey's multiple-comparisons test for c-Jun. D, Time course of myelination of SC-DRG cultures. Doxycycline addition indicated with arrows. Cells examined at d10. E, Representative immunostaining images for DAPI, FLAG, and MBP of SC-DRG cocultures. Scale bar, 50 µm. n = 3, F(3,8) = 11.52, ordinary one-way ANOVA with Tukey's multiple-comparisons test. Data represented as mean ± SEM, ns = not significant, significant p values displayed in graphs.
Figure 8.
Figure 8.
Schwann cell TFEB/3 deficiency impairs myelin clearance in regenerating nerves. A, Representative TEM representations of categories of myelin breakdown: intact-looking myelin (P-fiber; top), myelin layer separation (2nd from the top), myelin collapse (D-fiber; 2nd from the bottom), and multiple myelin ovoid-containing cells (bottom). B, Representative toluidine blue stained semithin sections of myelin breakdown at 3DPI and 7DPI control and Tfeb/3 SC-dKO distal nerves. Percentage of each category for all myelin sheaths. n = 3, 3DPI: tP-fiber(4) = 0.7145, tlayer-sep(4) = 0.8452 tD-fiber(4) = 1.951, tmultple-ovoid(4) = 0.1324, 7DPI: tP-fiber(4) = 0.9022, tlayer-sep(4) = 2.796, tD-fiber(4) = 5.481, tmultple-ovoid(4) = 0.2129, multiple unpaired t tests. C, Western blot of MBP and MPZ in 7DPI proximal and distal nerves of control and Tfeb/3 SC-dKO. n = 3, MBP: FInteraction(1,8) = 0.2711, Finjury(1,8) = 45.06, Fgenotype(1,8) = 1.904, MPZ: FInteraction(1,8) = 0.1190, Finjury(1,8) = 61.62, Fgenotype(1,8) = 0.1122, two-way ANOVA with Šídák's multiple-comparisons test. D, Western blot of LC3I and LC3II in 5DPI explant nerves ± NH4Cl of control and Tfeb/3 SC-dKO. n = 3, FInteraction(1,8) = 11.67, Finjury(1,8) = 76.84, Fgenotype(1,8) = 1.622, two-way ANOVA with Šídák's multiple-comparisons test. E, Heat map of autophagy related genes in intact contralateral and 5DPI distal Tfeb/3 SC-dKO vs control nerves. F, Representative immunostaining images of control and Tfeb/3 SC-dKO 3DPI nerves for IBA1. Scale bar, 20 µm. Graphs of percentage of IBA1+ cells per 1,000 µm2. n = 3, t(4) = 0.3145, unpaired t test. G, Representative 21DPI TEMs of distal control and Tfeb/3 SC-dKO sciatic nerves. Scale bar, 10 µm. Uncleared myelin indicated by asterisks (Schwann cells) and number signs (macrophages). Graph of myelin debris containing cells per 10,000µm2. n = 3, t(4) = 6.769, unpaired t test. H, g-ratios of sciatic nerves of 21 d post crush injury of control (black open circles) and Tfeb/3 SC-dKO (blue open squares; left). Average g-ratio of control and Tfeb/3 SC-dKO nerves (right). n = 3, t(4) = 5.127, unpaired t test. Data represented as mean ± SEM, ns = not significant, significant p values displayed in graphs.
Figure 9.
Figure 9.
Schwann TFEB/3 deficiency impairs axon regrowth and target reinnervation. A, Representative images of control and Tfeb/3 SC-dKO soleus muscle NMJs at 12DPI and 34DPI for SMI312 + SV2 (green) and RBTX (red). Scale bar, 100 µm (center and left) or 20 µm (right). Arrows indicate escaped fibers. Graphs of denervated NMJ percentage at 12DPI for control and Tfeb/3 SC-dKO or 34DPI for control, Tfeb/3 SC-dKO, and TFE3KO for soleus (top) and EDL (bottom). n = 3, tsoleus(4) = 24.24, tEDL(4) = 21.78, Unpaired t test (12DPI). n  =  3, soleus: Fsoleus(2,6) = 1.000, FEDL(2,6) = 4.672, ordinary one-way ANOVA with Tukey's multiple-comparisons test (34DPI). B, Representative images of control and Tfeb/3 SC-dKO distal crushed nerves at 3DPI and 5DPI for CD31 (green). Scale bar, 100 µm. Graphs of percentage of pixels of CD31+ expression area of total intrafascicular area. n = 3, t3DPI(4) = 0.5539, t5DPI(4) = 1.287, unpaired t test.
Figure 10.
Figure 10.
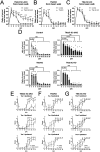
Schwann TFEB/3 deficiency but not TFE3 alone impairs functional recovery. A, Graph of errors/total hind steps ratio in beam walk test for control (solid line and circles) and Tfeb/3 SC-dKO (dashed line with squares). n = 5. FInteraction(20,132) = 1.781, Finjury(10,132) = 51.46, Fgenotype(2,132) = 41.68, two-way ANOVA with Tukey's multiple-comparisons test. B, Graph of ratio of errors/total hind steps in beam walk test for control (solid line and circles) and Tfe3KO (dotted line with triangles). Note controls are the same as in Figure 10A. n = 5. FInteraction(20,132) = 1.781, Finjury(10,132) = 51.46, Fgenotype(20,132) = 41.68 (note that ANOVA analysis was the same as A), two-way ANOVA with Tukey's multiple-comparisons test. C, Graph of ratio of errors/total hind steps in beam walk test for control (solid line and circles) and Tfeb SC-KO (dotted and dashed line with diamonds). n = 5, FInteraction(10,88) = 0.8209, Finjury(10,88) = 187.5, Fgenotype(1,88) = 3.42, two-way ANOVA with Tukey's multiple-comparisons test. D, Graphs of errors/total hind steps ratio in beam walk test for control (top left), Tfeb/3 SC-dKO (top right), Tfe3KO (bottom left), and Tfeb SC-KO (bottom right) relative to uninjured (0DPI). n = 5. For control, Tfeb/3 SC-dKO, and Tfe3KO F statistic is the same as 10A and 10B, for Tfeb SC-KO F statistic is the same as C. Two-way ANOVA with Dunnett's multiple-comparisons test. E, Graphs of score for toe pinching test ipsilateral to nerve crush. Toes 5, 4, and 3 from most lateral to medial. Control indicated with solid line and circles and Tfeb/3 SC-dKO with dashed line with squares. Note controls are the same as in F. n = 5. Toe 5: FInteraction(20,132) = 3.798, Finjury(10,132) = 28.06, Fgenotype(2,132) = 47.72, Toe 4: FInteraction(20,132) = 1.801, Finjury(10,132) = 20.28, Fgenotype(2,132) = 15.91, Toe 3: FInteraction(20,132) = 1.561, Finjury(10,132) = 32.83, Fgenotype(2,132) = 11.74, two-way ANOVA with Tukey's multiple-comparisons test. F, Graph of score for toe pinching test ipsilateral to nerve crush. Toes 5, 4, and 3 from most lateral to medial. Control indicated with solid line and circles and Tfe3KO with dotted line with triangles. Note controls are the same as in C. n = 5. Toe 5: FInteraction(20,132) = 3.798, Finjury(10,132) = 28.06, Fgenotype(2,132) = 47.72, Toe 4: FInteraction(20,132) = 1.801, Finjury(10,132) = 20.28, Fgenotype(2,132) = 15.91, Toe 3: FInteraction(20,132) = 1.561, Finjury(10,132) = 32.83, Fgenotype(2,132) = 11.74 (note that ANOVA analysis was the same as E), two-way ANOVA with Tukey's multiple-comparisons test. Data represented as mean ± SEM, ns = not significant, significant p values displayed in graphs. G, Graph of score for toe pinching test ipsilateral to nerve crush. Toes 5, 4, and 3 from most lateral to medial. Control indicated with solid line and circles and Tfeb SC-KO with dotted and dashed line with diamonds. n  =  5. Toe 5: FInteraction(10,88) = 1.905, Finjury(10,88) = 28.47, Fgenotype(1,88) = 6.557, Toe 4: FInteraction(10,88) = 0.5122, Finjury(10,88) = 20.08, Fgenotype(1,88) = 4.402, Toe 3: FInteraction(10,88) = 1.244, Finjury(10,88) = 21.27, Fgenotype(1,88) = 7.432, two-way ANOVA with Tukey's multiple-comparisons test. Data represented as mean ± SEM, ns = not significant, significant p values displayed in graphs.

References

    1. Abercrombie M, Johnson ML (1946) Quantitative histology of Wallerian degeneration; nuclear population in rabbit sciatic nerve. J Anat 80:37–50. - PubMed
    1. Arthur-Farraj PJ, et al. (2012) c-Jun reprograms Schwann cells of injured nerves to generate a repair cell essential for regeneration. Neuron 75:633–647. 10.1016/j.neuron.2012.06.021 - DOI - PMC - PubMed
    1. Arthur-Farraj PJ, Morgan CC, Adamowicz M, Gomez-Sanchez JA, Fazal SV, Beucher A, Razzaghi B, Mirsky R, Jessen KR, Aitman TJ (2017) Changes in the coding and non-coding transcriptome and DNA methylome that define the Schwann cell repair phenotype after nerve injury. Cell Rep 20:2719–2734. 10.1016/j.celrep.2017.08.064 - DOI - PMC - PubMed
    1. Bailey TL, Johnson J, Grant CE, Noble WS (2015) The MEME suite. Nucleic Acids Res 43:W39–W49. 10.1093/nar/gkv416 - DOI - PMC - PubMed
    1. Barter RL, Yu B (2018) Superheat: an R package for creating beautiful and extendable heatmaps for visualizing complex data. J Comput Graph Stat 27:910–922. 10.1080/10618600.2018.1473780 - DOI - PMC - PubMed

MeSH terms

Substances