. 2024 Jul 25;15(1):6274.
doi: 10.1038/s41467-024-50113-6.

Oxytocin induces the formation of distinctive cortical representations and cognitions biased toward familiar mice

Affiliations

Oxytocin induces the formation of distinctive cortical representations and cognitions biased toward familiar mice

David Wolf et al. Nat Commun. .

Abstract

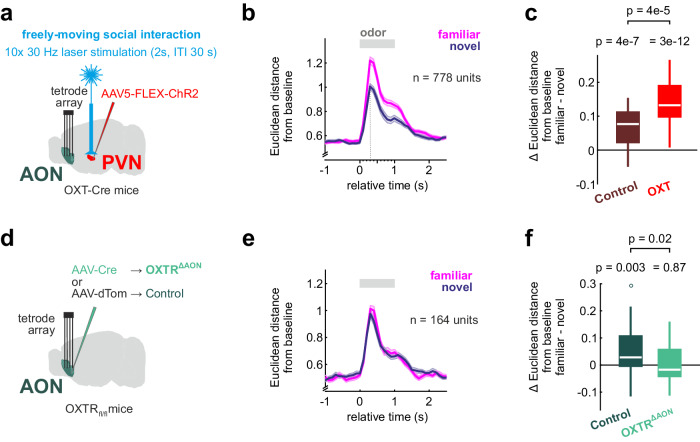
Social recognition is essential for the formation of social structures. Many times, recognition comes with lesser exploration of familiar animals. This lesser exploration has led to the assumption that recognition may be a habituation memory. The underlying memory mechanisms and the thereby acquired cortical representations of familiar mice have remained largely unknown, however. Here, we introduce an approach directly examining the recognition process from volatile body odors among male mice. We show that volatile body odors emitted by mice are sufficient to identify individuals and that more salience is assigned to familiar mice. Familiarity is encoded by reinforced population responses in two olfactory cortex hubs and communicated to other brain regions. The underlying oxytocin-induced plasticity promotes the separation of the cortical representations of familiar from other mice. In summary, neuronal encoding of familiar animals is distinct and utilizes the cortical representational space more broadly, promoting storage of complex social relationships.


Conflict of interest statement

The authors declare no competing interests.

Figures

Fig. 1
Fig. 1. Cortical populations encode identity of conspecifics.
a Odors from emitter mice or a natural floral odor (0.1% ylang ylang), and peanut butter were presented to head-fixed receiver mice in pseudorandomized trials. Each emitter mouse, namely male, unfamiliar C57BL/6#1 and C57BL/6#2 as well as a male CD1, was placed into a sealed isobaric container with continuous air flow regulated by the olfactometer. The combination of individual emitter mice was permuted to avoid repetition of unique combinations of emitter mice. Each session contained 20 trials per odor with a 1 s stimulus presentation and jittered trial durations of 10–12 s. b Stability of the firing rate response to social odors is shown for the AON in sequential blocks of 5 trials (grayscale, mean ± SEM, number of trials is indicated in the figure). All odors show initial adaptation in the first block. After the first five trials, responses were stable in amplitude and shape throughout the session (see Supplementary Fig. 2b for non-social odors). c The population vectors encode two components. Firstly, they encode the individual identity of an odor in their orientation, which stems from differential cortical activation patterns. Secondly, we hypothesize that they encode features like familiarity in their overall response amplitude, which can be quantified using the Euclidean distance from baseline. d Population responses in a representative experiment with 75 simultaneously recorded neurons from AON responding to the 5 different odorants. Single emitter individuals can be discriminated based on diverging responses in single-units. e The confusion matrices of linear decoders, which were trained to predict the odor identity of a single trial from the neuronal population activity, shows high accuracy in AON, pPC and LEC. Prediction accuracy was determined on trials, that were not included in the training dataset. f The temporal evolution of the Euclidean distance from baseline of the population vector in the AON (mean ± SEM, n = 20 trials per odor). Gray bar represents odor duration. g The mean Euclidean distance from baseline was compared for the different odors (0 to +1 s relative to odor onset; repeated-measures one-way ANOVA with a post-hoc two-sided Tukey’s test for multiple comparisons). None of the recorded cortices showed significant differences between the two unfamiliar mice from the same genetic background (see Supplementary Fig. 2d, g, h for all pairwise comparison results). h The sniff frequency response also did not differ between the two C57BL/6 mice (repeated-measures one-way ANOVA with post-hoc two-sided Tukey’s test for multiple comparisons; n = 13 animals with 1 session each; see Supplementary Fig. 5c for all pairwise comparison results). In the figure, test results are indicated as exact p-values or as a heatmap (see also Supplementary Table 4 for details on test statistics). Boxplots with a horizontal line as median, the box edges indicating the 25th to 75th percentiles, a vertical line extending to the most extreme data points excluding outliers, and outliers plotted individually as circles. Source data are provided as a Source Data file.
Fig. 2
Fig. 2. Neural coding of familiarity.
a Mice were left to freely interact with a same-sex adolescent conspecific for 5 min. The head-fixed recording session started 10–15 min after the interaction, and the odors of the previous interaction partner (familiar) and that of a novel adolescent conspecific were presented for 1 s in pseudorandomized order (30 trials for each emitter). b The trial-averaged sniff frequency responses to the smell of the familiar and novel animal show higher sniff frequencies in response to the familiar one (n = 15 mice with 1 session each; two-sided paired t-test for session averages). c The (left) temporal evolution of the Euclidean distance from baseline of the population vectors from the AON (mean ± SEM, n = 30 trials per odor; number of units indicated in the figure) and (right) the mean Euclidean distance from baseline (0 to +1 s relative to odor onset) compared for the responses to familiar and novel emitters (two-sided paired t-test) indicate stronger population responses to the familiar odor. d The correlation of the memory strength (difference in Euclidean distance from baseline between familiar and novel) and the number of interaction bouts during the freely-moving familiarization period shows a positive association (n = 8 animals, 3 sessions each; same data as c). Same as c for population responses in (e) pPC, (f) LEC and (g) VTA. In the figure, test results are indicated as exact p-values (see also Supplementary Table 4 for details on test statistics). Boxplots with a horizontal line as median, the box edges indicating the 25th to 75th percentiles, a vertical line extending to the most extreme data points excluding outliers, and outliers plotted individually as circles. Source data are provided as a Source Data file.
Fig. 3
Fig. 3. Corticobulbar communication during retrieval of familiarity.
a The LFP was recorded simultaneously in the MOB and AON during head-fixed presentation of familiar and novel social odor stimuli (top, left). The spectrogram of the oscillation power during odor presentations showed peaks in the β and γ bands (15–30 Hz and 60–80 Hz, respectively) and sniff-locked frequencies (2–4 Hz) (top right). Odor-specific power spectrograms were normalized to baseline and averaged across sessions (n = 23 sessions from 8 mice) and show an increase in oscillatory power in the β and γ bands upon odor presentation from the familiar or novel mice (bottom). b Contrast spectrograms were computed by subtracting the session-averaged spectrogram of the response to the novel from the familiar mouse for MOB and AON, respectively. In both regions the familiar odor evokes stronger oscillations in the β and γ bands than the novel one. c Within-session comparison of time- and frequency-averaged β power increase (from baseline) confirms a stronger oscillatory response for the familiar than the novel smell in both regions (β band time-frequency window: 15–30 Hz, 0 to +1 s relative to odor onset; n = 23 sessions, two-sided paired t-test). d Single-units from the AON show more consistent phase-synchronization to the local β oscillations during presentation of the familiar animal (n = 750 units, two-sided Wilcoxon signed-rank test for difference between familiar and novel in averaged pairwise phase consistency (ppc) in the β band). e Inter-regional phase synchronization of β oscillations between the MOB and AON increases for both odors as compared to baseline and is stronger for familiar than novel body smells (weighted phase lag index (wpli) per session compared with two-sided Wilcoxon rank sum test, n = 23 sessions from 8 mice). In the figure, test results are indicated as exact p-values (see also Supplementary Table 4 for details on test statistics). Boxplots with a horizontal line as median, the box edges indicating the 25th to 75th percentiles, a vertical line extending to the most extreme data points excluding outliers, and outliers plotted individually as circles. Source data are provided as a Source Data file.
Fig. 4
Fig. 4. Corticobulbar top-down projections transmit familiarity information.
a Fiber photometry recording of axonal top-down projections from AON to MOB were performed by injection of AAV8-syn-GCaMP7f into the right AON and fiber placement in the ipsilateral granule cell layer (GCL) of the MOB. b Top left: Example of GCaMP expression in AON. Right: Example of fiber position in the GCL. Bottom left: Top-down projections preferentially target the GCL (scale bars: top left – 500 µm, right – 200 µm, bottom left – 50 µm) (n = 8 mice). c Average traces of responses to familiar and novel odors in the MOB (mean ± SEM, n = 18 sessions). d Trial-averaged responses show higher top-down projection activity for the familiar animal (two-sided paired t-test, n = 18 sessions). e MOB single-units were recorded using chronic tetrode arrays (n = 8 mice). f The temporal evolution of the Euclidean distance from baseline (mean ± SEM, n = 30 trials per odor). g The mean Euclidean distance from baseline (0 to +1 s relative to odor onset) was compared for the responses to familiar and novel emitters; indicating a significantly stronger population response to the familiar odor (two-sided paired t-test, n = 30 trials per odor). In the figure, test results are indicated as exact p-values (see also Supplementary Table 4 for details on test statistics). Boxplots with a horizontal line as median, the box edges indicating the 25th to 75th percentiles, a vertical line extending to the most extreme data points excluding outliers, and outliers plotted individually as circles. Source data are provided as a Source Data file.
Fig. 5
Fig. 5. Oxytocin modulates network activity in awake mice.
a Optogenetically triggered OXT release from the paraventricular nucleus (PVN) of the hypothalamus. Cre-dependent AAV expressing ChR2:mCherry was injected bilaterally in the PVN of OXT-Cre mice (ChR2OXT/PVN mice). OXT release was triggered four times by 30 Hz blue laser stimulation for 2 s (473 nm, 5 ms pulse duration, 5 min inter-trial interval). b Expression of ChR2:mCherry (red) is selective to the PVN with signal co-localization in neurons immuno-reactive to anti-oxytocin antibody (green) (coronal section, scale bar = 120 µm for overview and 20 µm for co-localization) (n = 6 mice). c Functional MRI was performed in 23 mice with 1 session per mouse with optogenetic OXT release. An exemplary T2-weighted structural image shows positioning of the fiber optic dorsal to the PVN (top left). Group-level t-statistic maps show prominent BOLD responses to OXT stimulation in the hypothalamus (Hyp), AON, NAc, septal area (Sep) and the hippocampus (HC) (two-sided t-test and Family wise error cluster-correction (FWEc) with a cluster-defining threshold of pCDT <0.01 and pFWEc < 0.05, see also Supplementary Table 3 for details on test statistics). Black lines along the sagittal plane indicate the positions of coronals shown below.
Fig. 6
Fig. 6. Oxytocin increases attention and excitability in the AON.
a An exemplary single-unit in the AON increases its firing rate upon laser stimulation in the PVN (left). Mean spike waveform of this AON unit (right). b Fraction of units in the AON responsive to evoked OXT release (n = 8 mice with 2 sessions for evoked OXT release and 1 session respectively for blocked and heat controls). Units were considered excited if the mean z-scored response in the response window (+1 to +3 s relative to laser onset) was greater than 1 and were considered inhibited if the z-scored response was lower than −1. The fractions of OXT release-excited or -inhibited units are shown in the pie charts and compared across conditions using pairwise two-sided Fisher’s exact tests (n indicates total number of units). In two control experiments, either the transmission of the blue laser light was blocked at the connecting ferrule (blocked control), or a red laser (593 nm), which does not activate ChR2, was used at the same light power (heat control). c Temporal evolution of the pupil response to evoked OXT release and control conditions (average % change to baseline ±SEM, n = 28, 12, 14 sessions for OXT, blocked and heat conditions, respectively). d Average change in pupil diameter for the time window from 1 to 5 s after laser onset (n = 28, 12, 14 sessions for OXT, blocked and heat conditions, respectively; one-way ANOVA with two-sided Tukey’s honest significance test for multiple comparisons). In the figure, test results are indicated as exact p-values (see also Supplementary Table 4 for details on test statistics). Boxplots with a horizontal line as median, the box edges indicating the 25th to 75th percentiles, a vertical line extending to the most extreme data points excluding outliers, and outliers plotted individually as circles. Source data are provided as a Source Data file.
Fig. 7
Fig. 7. Oxytocin enables the formation of cortical memory traces of familiarity.
a Optogenetic OXT release was triggered 10 times (60 pulses at 30 Hz with 5 ms pulse length, every 30 s) during the interaction in the OXT condition. The control condition received no additional optogenetic OXT release (AON data from Fig. 2). b The temporal evolution of the Euclidean distance from baseline shows higher values in response to the familiar than the novel odor (mean ± SEM, n = 30 trials per odor). c The Euclidean distance from baseline was compared for the responses to familiar and novel emitters (0 to +1 s relative to odor onset); indicating a significantly stronger population response to the familiar odor (two-sided paired t-test) in each condition. Control and OXT conditions were compared using a two-sided two-sample t-test and showed a bigger difference between familiar and novel animals after boosted OXT release (n = 30 trials per odor). d Conditional OXT receptor knockout mice (OXTRΔAON) were generated by injecting AAV-Cre into the AON of OXTRfl/fl mice (AAV-dTom was injected in OXTRfl/fl as control group) (n = 6 mice in each group). e The temporal evolution of the Euclidean distance from baseline shows no difference between responses to the familiar and novel social odors in OXTRΔAON mice (mean ± SEM, n = 30 trials per odor). f The Euclidean distance from baseline was compared for the responses to familiar and novel emitters (0 to +1 s relative to odor onset), indicating a significantly stronger population response to the familiar odor (two-sided paired t-test) in the control group but not the OXTRΔAON group. Control and OXTRΔAON groups were compared using a two-sided two-sample t-test and show a bigger difference between familiar and novel in the control group (n = 30 trials per odor). In the figure, test results are indicated as exact p-values (see also Supplementary Table 4). Boxplots with a horizontal line as median, the box edges indicating the 25th to 75th percentiles, a vertical line extending to the most extreme data points excluding outliers, and outliers plotted individually as circles. Source data are provided as a Source Data file.
Fig. 8
Fig. 8. Oxytocin enables reinforced and more distinct memory representations.
a To directly compare the effect of the OXT interventions and to account for differences in number of recorded units, we performed a subsampling analysis. Increasing numbers of units were repeatedly (n = 500 iterations) and randomly drawn from the pool of recorded units. The mean difference in Euclidean distance from baseline across draws was plotted as a function of the sample size. A linear mixed-effects model (see methods for details) confirms the bidirectional effect of the OXT manipulations (p-values from pairwise comparisons of the groups using a two-sided Tukey’s test with Bonferroni correction for multiple comparisons indicated on the right). b The Euclidean cross-odor distance (familiar vs. novel) was computed for all possible combinations of trials (first 5 trials removed because of habituation, see Fig. 1b), and the resulting distributions in the control and OXT condition were compared (n = 625 trial combinations). The boosted OXT condition led to more differentiated population responses (two-sided Wilcoxon rank-sum test; see also Supplementary Fig. 13j). c OXTRΔAON mice had a smaller Euclidean cross-odor distance, indicating less differentiated population responses (n = 625 trial combinations, two-sided Wilcoxon rank-sum test; see also Supplementary Fig. 15i). d Summary schematic highlighting how OXT increases attention and AON excitability to enable recognition of body odors through reinforced population responses and sniffing. In the figure, test results are indicated as exact p-values (see also Supplementary Table 4 for details on test statistics). Boxplots with a horizontal line as median, the box edges indicating the 25th to 75th percentiles, a vertical line extending to the most extreme data points excluding outliers, and outliers plotted individually as circles. Source data are provided as a Source Data file.

References

    1. Brennan, P. A. & Kendrick, K. M. Mammalian social odours: attraction and individual recognition. Philos. Trans. R. Soc. B Biol. Sci.361, 2061–2078 (2006).10.1098/rstb.2006.1931 - DOI - PMC - PubMed
    1. Kendrick, K. M., Levy, F. & Keverne, E. B. Changes in the sensory processing of olfactory signals induced by birth in sheep. Science256, 833–836 (1992). 10.1126/science.256.5058.833 - DOI - PubMed
    1. Young, L. J. & Wang, Z. The neurobiology of pair bonding. Nat. Neurosci.7, 1048–1054 (2004). 10.1038/nn1327 - DOI - PubMed
    1. Kogan, J. H., Franklandand, P. W. & Silva, A. J. Long-term memory underlying hippocampus-dependent social recognition in mice. Hippocampus10, 47–56 (2000). 10.1002/(SICI)1098-1063(2000)10:1<47::AID-HIPO5>3.0.CO;2-6 - DOI - PubMed
    1. Thor, D. H. & Holloway, W. R. Social Memory of the Male Laboratory Rat. J. Comp. Physiol. Psychol.96, 1000–1006 (1982).

LinkOut - more resources