. 2024 Jul;6(7):1367-1379.
doi: 10.1038/s42255-024-01082-z. Epub 2024 Jul 25.

Non-invasive mapping of brown adipose tissue activity with magnetic resonance imaging

Affiliations

Non-invasive mapping of brown adipose tissue activity with magnetic resonance imaging

Zimeng Cai et al. Nat Metab. 2024 Jul.

Abstract

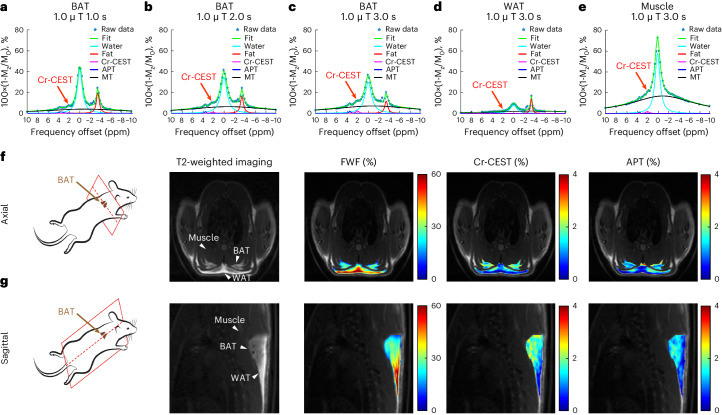
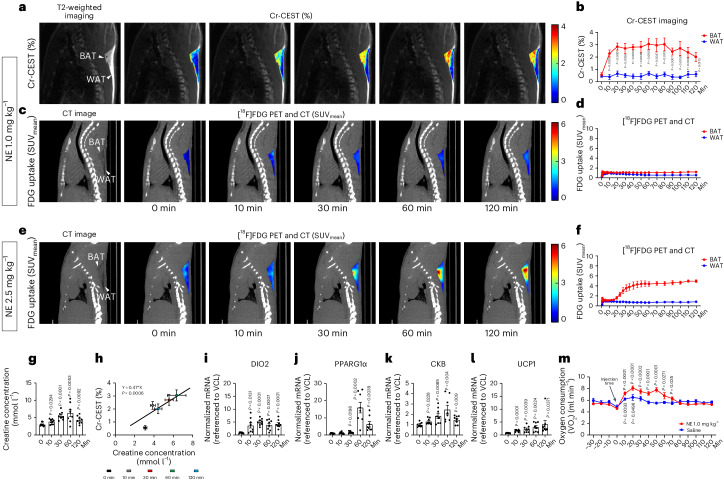
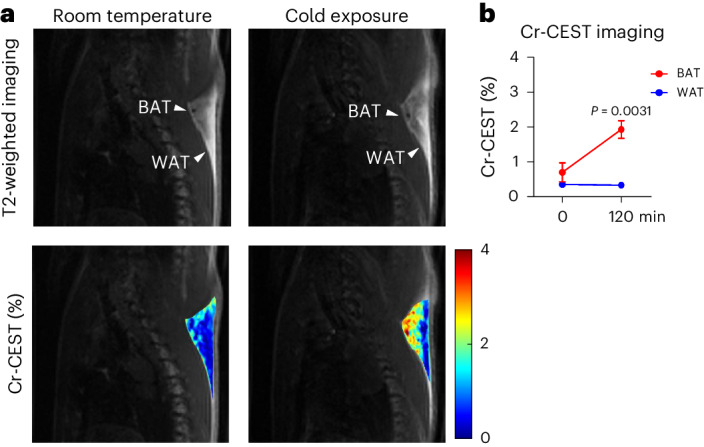
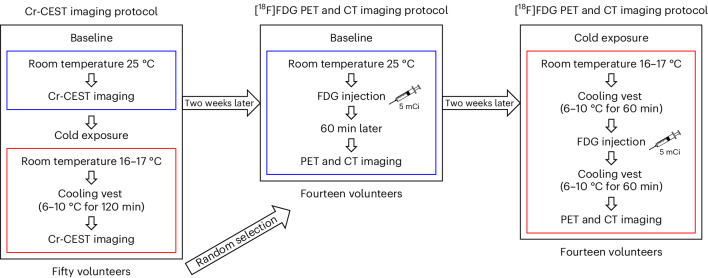
Thermogenic brown adipose tissue (BAT) has a positive impact on whole-body metabolism. However, in vivo mapping of BAT activity typically relies on techniques involving ionizing radiation, such as [18F]fluorodeoxyglucose ([18F]FDG) positron emission tomography (PET) and computed tomography (CT). Here we report a noninvasive metabolic magnetic resonance imaging (MRI) approach based on creatine chemical exchange saturation transfer (Cr-CEST) contrast to assess in vivo BAT activity in rodents and humans. In male rats, a single dose of the β3-adrenoceptor agonist (CL 316,243) or norepinephrine, as well as cold exposure, triggered a robust elevation of the Cr-CEST MRI signal, which was consistent with the [18F]FDG PET and CT data and 1H nuclear magnetic resonance measurements of creatine concentration in BAT. We further show that Cr-CEST MRI detects cold-stimulated BAT activation in humans (both males and females) using a 3T clinical scanner, with data-matching results from [18F]FDG PET and CT measurements. This study establishes Cr-CEST MRI as a promising noninvasive and radiation-free approach for in vivo mapping of BAT activity.


Conflict of interest statement

K.C., Z.C. and Z.L. filed a US patent application through the University of Illinois at Chicago, ‘Systems and methods for magnetic resonance imaging (MRI) noninvasive mapping of brown adipose tissue activity’. The other authors declare no competing interests.

Figures

Fig. 1
Fig. 1. Z-spectral fitting of adipose tissues producing multi-parametric contrasts including Cr-CEST.
ac, Fitting of the Z-spectra of BAT under different pre-saturation durations: 1.0 μT for 1.0 s (a), 2.0 s (b) and 3.0 s (c). The Cr-CEST peaks (red arrows) could be observed visually. d,e, Z-spectra of WAT (d) and muscle (e) under a 1.0 μT saturation for 3.0 s. f,g, Demonstration of the selection of image slices from the axial (f) and sagittal (g) views of rats’ interscapular fat depots, representative structural T2-weighted images and the corresponding FWF, Cr-CEST and APT maps obtained from the Z-spectral fitting. Representative image from n = 6. In the T2-weighted images, the arrowheads point to the BAT, WAT and muscle regions, respectively.
Fig. 2
Fig. 2. Dynamic Cr-CEST MRI and [18F]FDG PET and CT detect the response to saline and the β3-adrenergic receptor agonist CL.
ad, Dynamic Cr-CEST MRI (n = 6) and [18F]FDG PET and CT (n = 4) of interscapular fat depots after intraperitoneal injection with saline in rats: representative images (Cr-CEST % (a), FDG uptake SUV (c)) and signals (Cr-CEST % (b), FDG uptake SUVmean (d)). Representative image from n = 6 in Cr-CEST MRI and n = 4 in [18F]FDG PET and CT). eh, Dynamic Cr-CEST MRI (n = 6) and [18F]FDG PET and CT (n = 3) of interscapular fat depots after intraperitoneal injection with CL (1.0 mg kg−1) in rats: representative images (Cr-CEST % (e), FDG uptake SUVmean (g)) and signals (Cr-CEST % (f), FDG uptake SUVmean (h)). Representative image from n = 6 in Cr-CEST MRI and n = 3 in [18F]FDG PET and CT). i, 1H-NMR analysis of BAT creatine concentration; the creatine concentration of BAT increased after the administration of CL (1.0 mg kg−1, n = 8, a separate cohort from f). j, Linear regression analysis of Cr-CEST MRI in relation to creatine concentration (cohorts in f,i). kn, Real-time PCR analysis of thermogenesis-related gene expression due to CL (1.0 mg kg−1) in the BAT of rats; all experiments were repeated at least twice with similar results (n = 8). k, DIO2. l, PPARG1α. m, CKB. n, UCP1. o, Dynamic OCR of rats under saline (n = 6) or CL (n = 8) stimulation. Data are presented as the mean ± s.e.m. Statistical analysis was performed using two-tailed paired (f,o) and unpaired (i,kn) Student’s t-tests; each time point (10–120 min) was compared to 0 min (f,i,kn) and −10 min (o), respectively. In the T2-weighted and CT images, the arrowheads indicate the BAT and WAT regions, respectively. Source data
Fig. 3
Fig. 3. Dynamic Cr-CEST MRI detects the response to NE.
ad, Dynamic Cr-CEST MRI (n = 6) and [18F]FDG PET and CT (n = 4) of interscapular fat depots after intraperitoneal injection with NE (1.0 mg kg−1) in rats: representative images (Cr-CEST % (a), FDG uptake SUVmean (c)) and signals (Cr-CEST % (b), FDG uptake SUVmean (d)). Representative image from n = 6 in Cr-CEST MRI and n = 4 in [18F]FDG PET and CT. e,f, Dynamic [18F]FDG PET and CT (n = 3) of interscapular fat depots after intraperitoneal injection with NE (1.0 mg kg−1) in rats: representative images (FDG uptake SUVmean (e)) and signals (FDG uptake SUVmean (f)). g, 1H-NMR analysis of BAT creatine concentration. The creatine concentration of BAT increased after the administration of NE (1.0 mg kg−1, n = 8, separate cohort from b). h, Linear regression analysis of Cr-CEST MRI in relation to creatine concentration (cohorts in b,g). il, Real-time PCR analysis of thermogenesis-related gene expression due to NE (1.0 mg kg−1) in the BAT of rats; all experiments were repeated at least twice with similar results (n = 8). m, Dynamic OCR of rats under saline (n = 6) or NE (n = 8) stimulation. Data are presented as the mean ± s.e.m. The statistical analysis was performed using two-tailed paired (b,m) and unpaired (g,il) Student’s t-tests; each time point (10–120 min) was compared to 0 min (b,g,il) and −10 min (m), respectively. In the T2-weighted and CT images, the arrowheads indicate the BAT and WAT regions, respectively. Source data
Fig. 4
Fig. 4. Cr-CEST MRI detects BAT adrenergic activation in cold-exposed rats.
a, Quantitative maps of BAT Cr-CEST at room temperature and under cold exposure. b, BAT Cr-CEST increased significantly after a 2-h cold exposure, while WAT Cr-CEST showed no significant difference before and after cold exposure. Representative image from n = 7. Data were acquired from Cr-CEST imaging (n = 7). Data are presented as the mean ± s.e.m. The statistical analysis was performed using two-tailed paired Student’s t-tests (b). In the T2-weighted images, the arrowheads indicate the BAT and WAT regions, respectively. Source data
Fig. 5
Fig. 5. Flowchart of the human studies at room temperature (baseline) and after cold exposure.
Fourteen individuals were randomly selected for PET and CT imaging from 50 healthy volunteers selected for Cr-CEST imaging.
Fig. 6
Fig. 6. Cr-CEST MRI detects BAT adrenergic activation in cold-exposed humans.
a, Representative Cr-CEST maps for both the BAT and WAT regions in humans before and after cold exposure. b, BAT Cr-CEST increased significantly after a 2-h cold exposure. c, WAT Cr-CEST showed no difference before and after cold exposure. d, Linear regression analysis of resting-state Cr-CEST MRI in relation to BMI. e, Under the same experimental conditions (room temperature or cold exposure), there was no statistical difference in BAT Cr-CEST between male (n = 27) and female (n = 23) volunteers. f, BAT Cr-CEST in both male and female volunteers showed the same statistical power before and after cold exposure. g, [18F]FDG PET and CT imaging of interscapular fat depots at room temperature and under cold exposure. h,i, Differences in BAT (h) and WAT (i) FDG uptake before and after cold exposure. j, Linear regression analysis on the percentage change of Cr-CEST in relation to FDG uptake using [18F]FDG PET in volunteers who underwent both Cr-CEST and [18F]FDG PET imaging (n = 14). Representative image from n = 50 in Cr-CEST MRI and n = 14 in [18F]FDG PET and CT. Data were acquired from Cr-CEST (n = 50) and PET and CT imaging (n = 14). The statistical analysis was performed using two-tailed paired (b,f,h) and unpaired (e) Student’s t-tests. In the T2-weighted and CT images, the arrowheads indicate the BAT and WAT regions, respectively. Source data
Extended Data Fig. 1
Extended Data Fig. 1. Representative Z-spectra (a-c), CrCEST (d), and CrCEST maps (e) under CL 316, 243 stimulation for 2 hours in rats.
Representative image (from n = 6). Data are presented as means ± s.e.m, n = 6. When activated, the CrCEST signal of BAT increased, accompanied by the increase of water signal and the decrease of fat signal. Statistical analysis was performed using two-tailed paired Student’s t-tests, and each time point (10–120 min) was compared to 0 min (d), respectively. In Z-spectra, arrows were pointed to the water, fat, CrCEST, and APT peaks, respectively. Note that the area containing lung cavity is not shown due to sparse signal and artifacts. Source data
Extended Data Fig. 2
Extended Data Fig. 2. Representative Z-spectra (a-c), CrCEST (d), and CrCEST maps (e) under NE stimulation for 2 hours in rats.
Representative image (from n = 6). Data are presented as means ± s.e.m, n = 6. When activated, the CrCEST signal of BAT increased, accompanied by the increase of water signal and the decrease of fat signal. Statistical analysis was performed using two-tailed paired Student’s t-tests, and each time point (10–120 min) was compared to 0 min (d) respectively. In Z-spectra, arrows were pointed to the water, fat, CrCEST, and APT peaks, respectively. Note that the area containing lung cavity is not shown due to sparse signal and artifacts. Source data
Extended Data Fig. 3
Extended Data Fig. 3. CrCEST MRI at different spatial resolutions.
Increasing the spatial resolution helps to reduce the partial volume effect, delineate tissue boundaries, and therefore differentiate different types of adipose tissues. However, a longer scan time is required (8 mins vs. 16 mins). Representative image (from n = 3). Source data
Extended Data Fig. 4
Extended Data Fig. 4. Multi-slice CrCEST imaging of the entire interscapular fat depot 30-min post-injection of NE.
The total scanning time is 14 mins. Representative image (from n = 3).
Extended Data Fig. 5
Extended Data Fig. 5. Representative Z-spectra (a-c), CrCEST maps (d), and CrCEST (e) under room temperature (RT, 0 min) and 2-hour cold exposure in rats.
Representative image (from n = 7). Data are presented as means ± s.e.m, n = 7. When activated, the CrCEST signal of BAT increased, accompanied by the increase of water signal and the decrease of fat signal. Statistical analysis was performed using two-tailed paired Student’s t-tests (d). In Z-spectra, arrows were pointed to the water, fat, CrCEST, and APT peaks, respectively. Note that the area containing lung cavity is not shown due to sparse signal and artifacts. Source data
Extended Data Fig. 6
Extended Data Fig. 6. Z-spectra under room temperature (RT, 0 min) and 2-hour cold exposure in humans.
The CrCEST and water signals of BAT Z-spectra increased significantly after 2 hours mild-cold exposure. In Z-spectra, arrows were pointed to the water, fat, CrCEST, and APT peaks, respectively.
Extended Data Fig. 7
Extended Data Fig. 7. CrCEST MRI of creatine solutions at different temperatures.
Relationship between CrCEST and temperature for different creatine concentrations (2.5 mM, 5.0 mM, 7.5 mM, 10 mM, 15 mM, and 20 mM), n = 3. (a) T2WI, and the CrCEST maps at different temperatures (35 °C, 37 °C, and 39 °C respectively). (b) When the concentration of creatine was equal to or higher than 10 mM, the CrCEST signal showed a tendency to gradually decrease from 35 °C to 39 °C. Representative image (from n = 3). Data are presented as means ± s.d. Statistical analysis was performed using two-tailed paired Student’s t-tests. Each temperature (37 and 39 °C) was compared to 35 °C. Source data
Extended Data Fig. 8
Extended Data Fig. 8. B0 and B1 mapping of the interscapular fat depot in rats.
(a-c) Dynamic B0 mapping based on WASSR and Z-spectral fitting of fat depot before and post the injection of CL 316, 243 in rats, representative B0 maps (from n = 3). (d) The dynamics of WASSR-based and Z-spectral fitting-based B0 shift in muscle, BAT, and WAT during the 2-hour CL 316, 243 stimulation. (e) A representative B1 map of the interscapular fat depot in rats, representative B1 map (from n = 3). Note that the area containing lung cavity is not shown due to sparse signal and artifacts. Source data
Extended Data Fig. 9
Extended Data Fig. 9. B0 and B1 inhomogeneity of human subjects did not affect the results of CrCEST MRI at 3T.
(a–c) The representative T2WI and B0 and the B1 maps for the interscapular fat depot in human. (d, e) BAT CrCEST results showed no statistical differences between the left and right sides of the body before and after cold exposure (n = 50). (f) Percentage changes of CrCEST before and after cold exposure showed no statistical differences between the left and right sides (n = 50). RT, room temperature. Representative image (from n = 50). Data are presented as means ± s.d. Statistical analysis was performed using two-tailed paired Student’s t-tests. Source data
Extended Data Fig. 10
Extended Data Fig. 10. Normalized CrCEST maps of human subjects before and after cold exposure.
(a) Besides rescaling the values, CrCEST maps normalized to the water signal did not change the overall spatial pattern of BAT activation. (b) Both types of normalized CrCEST showed significantly increased CrCEST due to cold exposure in humans. Statistical analysis was performed using two-tailed paired Student’s t-tests, n = 50 (b). Representative image (from n = 50). RT, room temperature. In T2WI, arrowheads were pointed to the BAT and WAT regions, respectively. Source data

References

    1. Blüher, M. Obesity: global epidemiology and pathogenesis. Nat. Rev. Endocrinol.15, 288–298 (2019). 10.1038/s41574-019-0176-8 - DOI - PubMed
    1. Piché, M. E., Tchernof, A. & Després, J. P. Obesity phenotypes, diabetes, and cardiovascular diseases. Circ. Res.126, 1477–1500 (2020). 10.1161/CIRCRESAHA.120.316101 - DOI - PubMed
    1. Deng, T., Lyon, C. J., Bergin, S., Caligiuri, M. A. & Hsueh, W. A. Obesity, inflammation, and cancer.Annu. Rev. Pathol.11, 421–449 (2016). 10.1146/annurev-pathol-012615-044359 - DOI - PubMed
    1. Kahn, B. B. & Flier, J. S. Obesity and insulin resistance. J. Clin. Invest.106, 473–481 (2000). 10.1172/JCI10842 - DOI - PMC - PubMed
    1. Müller, T. D., Blüher, M., Tschöp, M. H. & DiMarchi, R. D. Anti-obesity drug discovery: advances and challenges. Nat. Rev. Drug Discov.21, 201–223 (2022). 10.1038/s41573-021-00337-8 - DOI - PMC - PubMed

LinkOut - more resources