. 2024 Jul 25;8(1):156.
doi: 10.1038/s41698-024-00653-3.

Combined inhibition of EZH2 and CDK4/6 perturbs endoplasmic reticulum-mitochondrial homeostasis and increases antitumor activity against glioblastoma

Affiliations

Combined inhibition of EZH2 and CDK4/6 perturbs endoplasmic reticulum-mitochondrial homeostasis and increases antitumor activity against glioblastoma

Thomas Freitag et al. NPJ Precis Oncol. .

Abstract

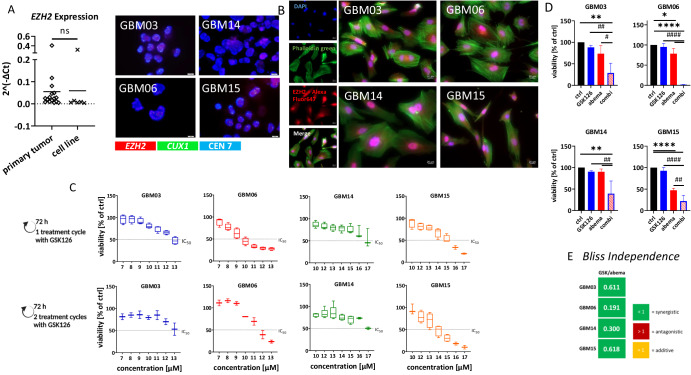
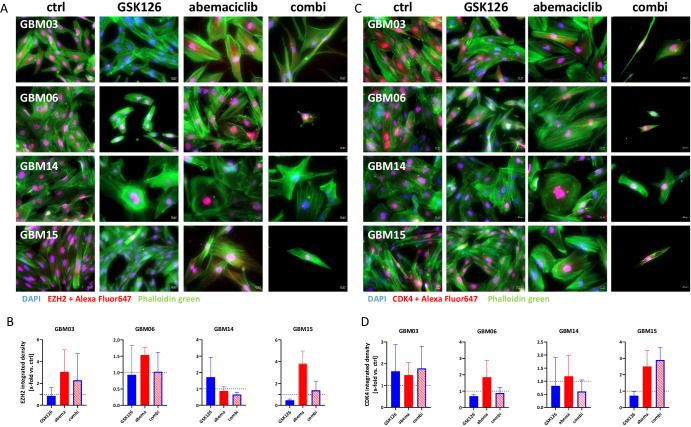
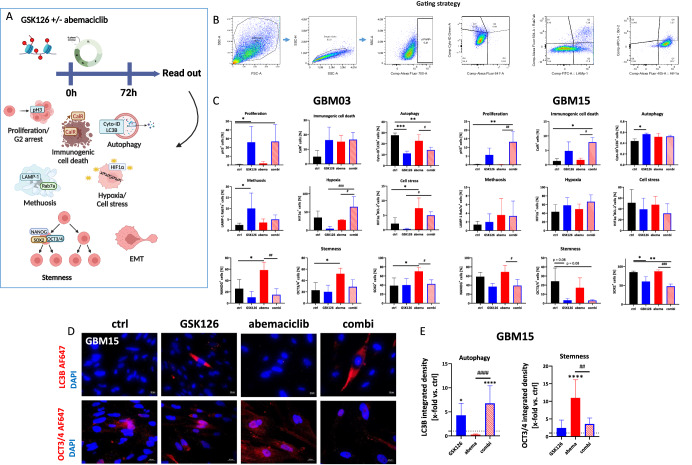
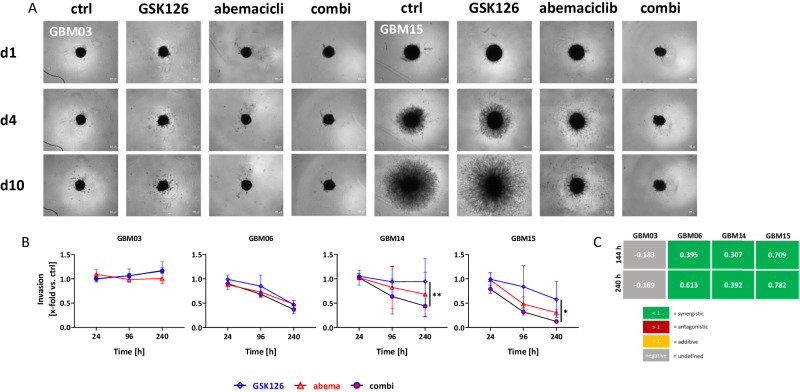
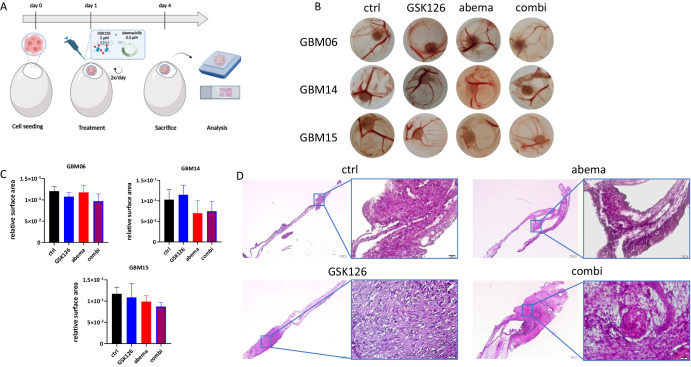
He, we show that combined use of the EZH2 inhibitor GSK126 and the CDK4/6 inhibitor abemaciclib synergistically enhances antitumoral effects in preclinical GBM models. Dual blockade led to HIF1α upregulation and CalR translocation, accompanied by massive impairment of mitochondrial function. Basal oxygen consumption rate, ATP synthesis, and maximal mitochondrial respiration decreased, confirming disrupted endoplasmic reticulum-mitochondrial homeostasis. This was paralleled by mitochondrial depolarization and upregulation of the UPR sensors PERK, ATF6α, and IRE1α. Notably, dual EZH2/CDK4/6 blockade also reduced 3D-spheroid invasion, partially inhibited tumor growth in ovo, and led to impaired viability of patient-derived organoids. Mechanistically, this was due to transcriptional changes in genes involved in mitotic aberrations/spindle assembly (Rb, PLK1, RRM2, PRC1, CENPF, TPX2), histone modification (HIST1H1B, HIST1H3G), DNA damage/replication stress events (TOP2A, ATF4), immuno-oncology (DEPDC1), EMT-counterregulation (PCDH1) and a shift in the stemness profile towards a more differentiated state. We propose a dual EZH2/CDK4/6 blockade for further investigation.


Conflict of interest statement

The authors declare no competing interests.

Figures

Fig. 1
Fig. 1. EZH2 as a target in glioblastoma.
A EZH2 expression levels (qPCR) in primary tumors and patient-derived GBM cell lines (left) (ns not significant), as well as FISH analysis (right) to detect EZH2 in GBM cells. FISH was performed using the ZytoLight FISH Cytology implementation Kit according to the manufacturer’s protocol using the following probes: ZytoLight SPEC CUX1 (green)/EZH2 (red)/CEN 7 (blue) Triple Color Probe. The criteria for gene amplification were defined as the presence of either four (or more) gene signals or more than 2.5 times as many gene signals as centromere signals of the related chromosome. B protein abundance in four patient-derived GBM cell lines. Representative immunofluorescence images are shown. Nuclei were stained with DAPI (blue), actin filaments with Phalloidin green (green), EZH2 using an Alexa Fluor® 647-conjugated secondary antibody (red). Single-channel and merged fluorescence are presented (scale bar: 20 μm). CE Influence of GSK126 alone and in combination with abemaciclib on the viability of GBM cells. C Concentration-response relationships to GSK126 for one (72 h) and two (2 × 72 h) treatment cycles to determine the IC20 and IC50 concentrations. D Presented is the response to GSK126 (10 µM), abemaciclib (1 µM) and the combination (C, D) of both after 2 treatment cycles with 72 h each; n = 3, mean ± s.d. One-way ANOVA (Tukey’s multiple comparisons test); *p < 0.05; **p < 0.01; ****p < 0.0001 (comparison between control and test group); #p < 0.05; ##p < 0.001; ####p < 0.0001 (comparison between testing groups). E The Bliss independence model was used to assess additive or synergistic effects in the combination compared to each monotherapy after 2 × 72 h of treatment. Created with Biorender.com.
Fig. 2
Fig. 2. Treatment-induced changes in the EZH2 and CDK4 protein expression.
Immunofluorescence for assessment of A, B EZH2 and C, D CDK4 protein levels in 2D cell cultures with or without treatment (GSK126 10 µM, abemaciclib 1 µM, combination, 2 × 72 h). Nuclei were stained with DAPI (blue), actin filaments with Phalloidin green (green), EZH2/CDK4 using an Alexa Fluor® 647-conjugated secondary antibody (red). B, D The quantification is presented as the x-fold change (integrated density) relative to the control (DMSO), which was set to =1 (dotted line); n = 3, mean ± s.d. Kruskal–Wallis test (Dunn’s multiple comparisons test).
Fig. 3
Fig. 3. Influence on autophagy, proliferation, cell stress, methuosis, and stemness.
A Schematic overview of the treatment strategy and its impact on different cell death and escape mechanisms. Created with Biorender.com. B Gating strategy for flow cytometry quantification. C Quantitative analysis of the investigated markers using spectral flow cytometry. Given is the % of positive cells after exposure to GSK126 (10 µM), abemaciclib (1 µM) and the combination of both (treatment: 1 × 72 h); n = 3–5, mean ± s.d. One-way ANOVA (Tukey’s multiple comparisons test); *p < 0.05; **p < 0.01; ***p < 0.001; (comparison between control and test group) #p < 0.05; ##p < 0.001; ###p < 0.001 (comparison between testing groups). D, E Immunofluorescence for assessment of autophagy (LC3B) and stemness (OCT3/4). Expression levels of LC3B and OCT3/4 were determined after 2× 72 h with or without treatment (GSK126 10 µM, abemaciclib 1 µM, combination) D Representative images of GBM15 cells. Nuclei were stained with DAPI (blue), autophagocytotic cells with an Alexa Fluor® 647 anti-LC3B antibody (red) or an Alexa Fluor® 647 anti-OCT3/4 antibody (red). E The quantification is presented as the x-fold change (integrated density) relative to the control (DMSO), which was set to =1 (dotted line); n = 3, mean ± s.d. One-way ANOVA (Tukey’s multiple comparisons test); *p < 0.05; ****p < 0.0001 (comparison between control and test group) #p < 0.05; ##p < 0.001; ####p < 0.0001 (comparison between testing groups).
Fig. 4
Fig. 4. Impact on ER stress, lysosomes, mitochondria, and extracellular flux analysis.
A, B ER stress (ER-tracker), acidic compartments (LysoTracker), and mitochondrial function (Mitotracker) were examined in 2D-cultured GBM cells with or without treatment (GSK126 10 µM, abemaciclib 1 µM, combination, 2× 72 h) by immunofluorescence staining as described in the “Methods” section (ER- [blue], Lyso- [green], and Mitotracker [red]). A Single-channel and merged fluorescence are presented (representative images are shown, scale bar A: 20 μm, n = 3). B Quantification determined as the x-fold change (integrated density) in relation to the control, which was set to be =1 (dotted line); Kruskal–Wallis test (Dunn’s multiple comparisons test); *p < 0.05; **p < 0.01 (comparison between control and test group); ##p < 0.01 (comparison between testing groups); Complex cellular stress responses were seen in all cell lines, with individual effects of the treatments. CE The oxygen consumption rate (OCR) and extracellular acidification rate (ECAR) of GBM15 cells were measured using a Seahorse XFe24 Analyzer. C OCR and ECAR decreased after treatment with GSK126 (10 µM), abemaciclib (1 µM), or a combination of both. One-way ANOVA (Tukey’s multiple comparisons test); *p < 0.05 (comparison between control and test group). D Mitochondrial stress test was applied with injection of 1.5 µM oligomycin, 1.5 µM FCCP, and 0.5 µM antimycin A and rotenone, each. Kruskal–Wallis test (Dunn’s multiple comparisons test); ***p < 0.001 (comparison between control and test group); #p < 0.05; ##p < 0.01 (comparison between testing groups). E To determine the basal respiration (basal), ATP-dependent respiration (ATP), Spare respiratory capacity (spare), and proton leak (leak) were determined. One-way ANOVA (Tukey’s multiple comparisons test); **p < 0.01;***p < 0.001 (comparison between control and test group). Reduction of basal OCR and spare respiratory capacity was shown, indicating massively reduced cellular fitness. F JC-10 Mitochondrion Membrane Potential Assay. One-way ANOVA (Tukey’s multiple comparisons test); *p < 0.05 (comparison between control and test group); #p < 0.05 (comparison between testing groups); BF n = 4; mean ± s.d. All experiments were done after 2 × 72 h treatment with GSK126 (10 µM), abemaciclib (1 µM), or the combination of both.
Fig. 5
Fig. 5. Immunofluorescence for analysis of the unfolded protein response and mitochondrial impairment.
A, B MitoSOX™ red was used as an indicator of ROS production in GBM cells. Cells were counterstained with Calcein AM [green] for the spatial distribution. A Single-channel and merged fluorescence are presented (representative images for GBM15 are shown, scale bar A: 20 μm). Analysis was done after 1× and 2 × 72 h treatment with GSK126 (10 µM), abemaciclib (1 µM), or a combination of both. B Quantification determined as the x-fold change (integrated density) in relation to the control, which was set to be =1 (dotted line); n = 3, mean ± s.d. Kruskal–Wallis test (Dunn’s multiple comparisons test); **p < 0.01; ****p < 0.0001 (comparison between control and test group); ####p < 0.0001 (comparison between testing groups); There was a significant time-dependent increase in ROS production when GBM cells were exposed to the GSK126/abemaciclib combination. C, D ATF4 immunofluorescence for detection of the integrated stress response in GBM cells (GBM06, GBM15). C Single-channel and merged fluorescence are presented (representative images for GBM15 are shown, scale bar A: 20 μm). Analysis was done after 2× 72 h treatment with GSK126 (10 µM), abemaciclib (1 µM), or a combination of both. Nuclei were stained with DAPI (blue), ATF4 was detected by using an Alexa Fluor® 647 anti-ATF4 antibody. D The quantification is presented as the x-fold change (integrated density) relative to the control (DMSO), which was set to =1 (dotted line); n = 3, mean ± s.d. One-way ANOVA (Tukey’s multiple comparisons test); **p < 0.01; ***p < 0.001 (comparison between control and test group); ##p < 0.01 (comparison between testing groups). E, F Immunofluorescence for detection of the unfolded protein response in GBM cells (GBM06, GBM15). E Single-channel and merged fluorescence is presented (representative images for GBM15 are shown, scale bar A: 20 μm). Analysis was done after 2× 72 h treatment with GSK126 (10 µM), abemaciclib (1 µM), or a combination of both. Nuclei were stained with DAPI (blue), antibody staining included the following: Alexa Fluor® 488 anti-ATF6α, Alexa Fluor® 546 anti-PERK, Alexa Fluor® 647 anti-IRE1α. F The quantification is presented as the x-fold change (integrated density) relative to the control (DMSO), which was set to =1 (dotted line); n = 4, mean ± s.d. One-way ANOVA (Tukey’s multiple comparisons test); **p < 0.01; ***p < 0.001 (comparison between control and test group); #p < 0.05; ##p < 0.01; (comparison between testing groups). Combined treatment with GSK126 and abemaciclib enhanced cellular PERK and IRE1α levels and confirmed the induction of a UPR in GBM cells.
Fig. 6
Fig. 6. Invasion capability of the different cell lines and calculation of synergistic effects.
A Representative images of the invasion under treatment with GSK126 (10 µM), abemaciclib (1 µM), the combination of both, or with vehicle control after the spheroids were embedded in matrigel. Images were taken on day 1, 4, and 10. The spheroids were treated on day 0 and day 3 (2 × 72 h in total). B Increase in the spheroid area compared to the spheroid area of control spheroids on the respective day, which was set to 1. n = 3; mean ± s.d; Two-way ANOVA (Tukey’s multiple comparisons test); *p < 0.05; **p < 0.01 (comparison between testing groups). C The Bliss independence model was used to assess whether the combination showed additive or synergistic effects compared to each individual monotherapy. Created with Biorender.com.
Fig. 7
Fig. 7. Treatment of GBM cells with abemaciclib in combination therapy induces changes in genes involved in mitotic aberrations/spindle assembly, histone modification, DNA damage/replication stress events, and immuno-oncology.
A Microarray analysis with resulting heatmap displaying the top differentially expressed genes across all conditions, sorted by fold change. B Volcano plot representing all up- and downregulated genes between controls and the combination group (GSK126 10 µM, abemaciclib 1 µM, 2× 72 h). C Protein-protein interaction network of gene clusters top 20 downregulated and upregulated genes between control cells and the combination. Isolated nodes were removed from the network. The edges indicate both functional and physical protein interactions and the line thickness of network edges indicates the strength of data support, where minimum interaction score was set to high confidence (0.700) and FDR < 0.01. The clustering was performed using the Markov Cluster Algorithm (MCL) with an inflation parameter set to 3. D The Venn diagram visualizes the shared and exclusively DEGs between the combination treatment group and the abemaciclib treatment group. E Radar chart illustrates the exclusively DEGs associated with transcription factors under combination treatment.
Fig. 8
Fig. 8. Impact of treatments on in ovo cultured tumors.
A Schematic representation of the experimental set-up. Created with Biorender.com. B Macroscopic images of tumors from GBM cell lines under different treatment conditions (GSK126 5 µM, abemaciclib 0.5 µM, twice a day, for a total of 3 days). C Quantitative evaluation of the relative surface area of tumor size. n = 4–5; mean ± s.d. D HE images of GBM15 in ovo cultures from controls or treatment with GSK126, abema or the combination. Representative images at low and high magnification (4× and 40×, respectively), Scale bar = 200 µm, 5–6 eggs per condition.
Fig. 9
Fig. 9. Generation of patient-derived organoids for targeted treatment.
A PDOs were generated from frozen tissue of n = 5 individual GBM cases. Representative phase contract images of PDOs at day 14 and day 35 of culture in defined PDO medium. B Calcein AM staining was done to visualize the 3D-structure of PDOs and to assess the viability via confocal laser scanning microscopy (Z-stack analysis). Therefore, growing PDOs (at ~day 35 of culture) were cut into defined pieces (~200 µm), transferred into 96-well ULA plates, and exposed to treatments. Confocal laser scanning microscopy was done after 10 days of treatment (including 2× 72 h, +4 days follow-up). C Quantitative analysis of PDO viability was assessed after 10 days of treatment (including 2 × 72 h, +4 days follow-up) using the CellTiter 3D Glo assay as described in the “Methods” section. n = 2; mean ± s.d. One-way ANOVA (Tukey’s multiple comparisons test); *p < 0.05; ****p < 0.0001 (comparison between control and test group); ##p < 0.01; ###p < 0.001 (comparison between testing groups).

References

    1. Banerjee, K. et al. Current approaches for glioma gene therapy and virotherapy. Front. Mol. Neurosci.14, 621831 (2021). 10.3389/fnmol.2021.621831 - DOI - PMC - PubMed
    1. Silantyev et al. Current and future trends on diagnosis and prognosis of glioblastoma: from molecular biology to proteomics. Cells8, 863 (2019). 10.3390/cells8080863 - DOI - PMC - PubMed
    1. Louis, D. N. et al. The 2021 WHO classification of tumors of the central nervous system: a summary. Neuro. Oncol.23, 1231–1251 (2021). 10.1093/neuonc/noab106 - DOI - PMC - PubMed
    1. Liu, H. et al. EZH2 phosphorylation promotes self-renewal of glioma stem-like cells through NF-κB methylation. Front. Oncol.9, 641 (2019). 10.3389/fonc.2019.00641 - DOI - PMC - PubMed
    1. Zhao, G. et al. Targeting EZH2 regulates the biological characteristics of glioma stem cells via the Notch1 pathway. Exp. Brain Res.241, 2409–2418 (2023). 10.1007/s00221-023-06693-8 - DOI - PubMed