. 2024 Oct;30(4):863-882.
doi: 10.3350/cmh.2024.0268. Epub 2024 Jul 26.

TM6SF2 E167K variant decreases PNPLA3-mediated PUFA transfer to promote hepatic steatosis and injury in MASLD

Affiliations

TM6SF2 E167K variant decreases PNPLA3-mediated PUFA transfer to promote hepatic steatosis and injury in MASLD

Baokai Sun et al. Clin Mol Hepatol. 2024 Oct.

Abstract

Backgrounds/aims: Transmembrane 6 superfamily member 2 (TM6SF2) E167K variant is closely associated with the occurrence and development of metabolic dysfunction-associated steatotic liver disease (MASLD). However, the role and mechanism of TM6SF2 E167K variant during MASLD progression are not yet fully understood.

Methods: The Tm6sf2167K knock-in (KI) mice were subjected to high-fat diet (HFD). Hepatic lipid levels of Tm6sf2167K KI mice were detected by lipidomics analysis. Thin-layer chromatography (TLC) was used to measure the newly synthesized triglyceride (TG) and phosphatidylcholine (PC).

Results: The TM6SF2 E167K variant significantly aggravated hepatic steatosis and injury in HFD-induced mice. Decreased polyunsaturated PC level and increased polyunsaturated TG level were found in liver tissue of HFD-induced Tm6sf2167K KI mice. Mechanistic studies demonstrated that the TM6SF2 E167K variant increased the interaction between TM6SF2 and PNPLA3, and impaired PNPLA3-mediated transfer of polyunsaturated fatty acids (PUFAs) from TG to PC. The TM6SF2 E167K variant increased the level of fatty acid-induced malondialdehyde and reactive oxygen species, and decreased fatty acid-downregulated cell membrane fluidity. Additionally, the TM6SF2 E167K variant decreased the level of hepatic PC containing C18:3, and dietary supplementation of PC containing C18:3 significantly attenuated the TM6SF2 E167K-induced hepatic steatosis and injury in HFD-fed mice.

Conclusion: The TM6SF2 E167K variant could promote its interaction with PNPLA3 and inhibit PNPLA3-mediated transfer of PUFAs from TG to PC, resulting in the hepatic steatosis and injury during MASLD progression. PC containing C18:3 could act as a potential therapeutic supplement for MASLD patients carrying the TM6SF2 E167K variant.

Keywords: Hepatic steatosis; Metabolic dysfunction-associated steatotic liver disease; Patatin-like phospholipase domain-containing protein 3; Polyunsaturated fatty acids; Transmembrane 6 superfamily member 2.


Conflict of interest statement

Conflicts of Interest

The authors have no conflicts to disclose.

Figures
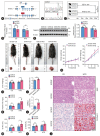
Figure 1.
Figure 1.
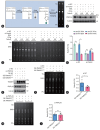
The TM6SF2 E167K variant exacerbates HFD-induced hepatic steatosis and injury in mice. (A) Strategy of constructing Tm6sf2167K KI mouse model using CRISPR/Cas9 technology. (B) Gene sequencing of Tm6sf2167E/E and Tm6sf2167K/K mice. (C) Mice fed with CD and HFD diets for 16 weeks to establish MASLD mouse model. (D) Relative expression level of Tm6sf2 mRNA in liver tissue of the Tm6sf2167E/E and Tm6sf2167K/K mice after MASLD modeling, β-Actin served as an internal reference. (E) WB results of TM6SF2 protein in liver tissue of the Tm6sf2167E/E and Tm6sf2167K/K mice after MASLD modeling, β-Actin was used as a loading control. (F–M) Body size and liver morphology (F), body weight (G), liver weight (H), hepatic index (I), H&E staining and Oil Red O (J, scale: 50 μm), hepatic TG content (K), MASLD activity score (L), plasma ALT level (M) and plasma AST level (N) of the Tm6sf2167E/E and Tm6sf2167K/K mice after MASLD modeling. Data are presented as means and SD. Statistical significance was calculated by two-tailed Student’s t test. *P<0.05, **P<0.01; NS, no significance. TM6SF2 transmembrane 6 superfamily member 2; HFD, high-fat diet; KI, knock-in; CD, control diet; MASLD, metabolic dysfunction-associated steatotic liver disease; WB, western blotting; ALT, alanine aminotransferase; AST, aspartate aminotransferase.
Figure 2.
Figure 2.
The TM6SF2 E167K variant causes the accumulation of PUFA-containing TG and downregulation of PUFA-containing PC in liver tissue of HFD-fed mice. (A) PCA score plots of untargeted lipidomics in liver tissue of the Tm6sf2167E/E and Tm6sf2167K/K mice after MASLD modeling. (B) Statistical graphs of lipid subclasses and lipid molecule quantities detected in untargeted lipidomics analysis of mouse liver tissue. (C, D) Relative levels of TG (C) and PC (D) in liver tissue of the Tm6sf2167E/E and Tm6sf2167K/K mice after MASLD modeling. (E) Relative levels of SFA-TG, MUFA-TG and PUFA-TG in liver tissue of the Tm6sf2167E/E and Tm6sf2167K/K mice after MASLD modeling. The lipids were divided into three categories based on the number of unsaturated bonds: SFA-lipids (containing only SFAs), MUFAlipids (containing one or more MUFAs and no PUFAs) and PUFA-lipids (containing one or more PUFAs). (F) Relative levels of SFA-PC, MUFA-PC, and PUFA-PC in liver tissue of the Tm6sf2167E/E and Tm6sf2167K/K mice after MASLD modeling. (G) The ratio of hepatic PC and TG in the Tm6sf2167E/E and Tm6sf2167K/K mice after MASLD modeling in the three groups. (H) The percentages of SFA-TG, MUFA-TG and PUFA-TG in the three groups from both the Tm6sf2167E/E and Tm6sf2167K/K mice after MASLD modeling. (I) The percentages of SFA-PC, MUFA-PC and PUFA-PC in the three groups from both the Tm6sf2167E/E and Tm6sf2167K/K mice after MASLD modeling. n=6 per group. Data are presented as means and SD. Statistical significance was calculated by two-tailed Student’s t test. *P<0.05; NS, no significance. TM6SF2 transmembrane 6 superfamily member 2; PUFA, polyunsaturated fatty acid; TG, triglyceride; PC, phosphatidylcholine; HFD, high-fat diet; MUFA, monounsaturated fatty acid; SFA, saturated fatty acid; MASLD, metabolic dysfunction-associated steatotic liver disease.
Figure 3.
Figure 3.
The TM6SF2 E167K variant enhances the interaction between TM6SF2 and PNPLA3 proteins. (A) IF analysis for the co-localization of TM6SF2 and PNPLA3 proteins from primary hepatocytes of the Tm6sf2167E/E and Tm6sf2167K/K mice under conditions with and without FFAs. Scale bar: 20 μm. (B) Co-IP analysis for the interaction between TM6SF2 and PNPLA3 proteins from primary hepatocytes of the Tm6sf2167E/E and Tm6sf2167K/K mice under conditions with and without FFAs. (C) Co-IP analysis for the interaction between TM6SF2 and PNPLA3 in 293T cells co-transfected with Myc-TM6SF2167E or Myc-TM6SF2167K plasmids and PNPLA3148I plasmids. (D, E) WB analysis for the PNPLA3 expression in the ER (D) and LDs (E) from primary hepatocytes of the Tm6sf2167E/E and Tm6sf2167K/K mice under conditions with and without FFAs. ERP72 and PLIN2 were employed as marker proteins for the ER and LDs. (F, G) WB analysis for the PNPLA3 expression in the ER (F) and LDs (G) in 293T cells co-transfected with Myc-TM6SF2167E or Myc-TM6SF2167K plasmids and PNPLA3148I plasmids under conditions with and without FFAs. ERP72 and PLIN2 were employed as marker proteins for the ER and LDs. (H, I) IF analysis for the colocalization of PNPLA3 with the ER (H) and LDs (I) from primary hepatocytes of the Tm6sf2167E/E and Tm6sf2167K/K mice under conditions with and without FFAs. Scale bar: 20 μm. IF, immunofluorescence; TM6SF2 transmembrane 6 superfamily member 2; FFAs, free fatty acids; Co-IP, co-immunoprecipitation; PNPLA3, patatin-like phospholipase domain-containing protein 3; WB, western blotting; ER, endoplasmic reticulum; LDs, lipid droplets.
Figure 4.
Figure 4.
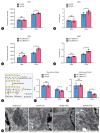
The TM6SF2 E167K variant impairs PNPLA3-mediated transfer of PUFAs from TG to PC. (A) Scheme for tracing fatty acids using click chemistry. Lipids were separated by TLC and visualized by fluorescence imaging. (B) WB analysis for PNPLA3 in primary hepatocytes, which were transfected with si-NC or si-Pnpla3 under conditions with and without FFAs, from the Tm6sf2167E/E and Tm6sf2167K/K mice. (C) TLC analysis of newly synthesized TG and PC in primary hepatocytes from the Tm6sf2167E/E and Tm6sf2167K/K mice. Primary hepatocytes were transfected with si-NC or si-Pnpla3 under conditions with and without FFAs. (D) Quantitative analysis of results from (C): Bar graphs represent the ratio of newly synthesized PC to TG. (E) WB analysis for 293T cells with TM6SF2 overexpression and PNPLA3 knockdown. (F, H) TLC analysis of newly synthesized TG and PC in 293T cells overexpressed with TM6SF2167E or TM6SF2167K plasmids, and transfected with si-NC (F) or si-PNPLA3 (H). (G, I) Quantitative analysis of results from (F, H): Bar graphs represent the ratio of newly synthesized PC to TG. Data are presented as means and SD. Statistical significance was calculated by two-tailed Student’s t test. *P<0.05, ***P<0.001; NS, no significance. TM6SF2 transmembrane 6 superfamily member 2; PNPLA3, patatin-like phospholipase domain-containing protein 3; PUFA, polyunsaturated fatty acid; TG, triglyceride; PC, phosphatidylcholine; TLC, thin-layer chromatography; WB, western blotting; FFAs, free fatty acids.
Figure 5.
Figure 5.
The TM6SF2 E167K variant leads to an increase in MDA and ROS levels, and a decrease in cell-membrane fluidity of fatty acid-treated hepatic cells. (A, B) The ROS (A) and MDA (B) levels of primary hepatocytes treated with 0.5 mM FFAs for 24 hours in the Tm6sf2167E/E and Tm6sf2167K/K mice. (C, D) The ROS (C) and MDA (D) levels in 0.5 mM FFA-treated 293T cells overexpressing TM6SF2167E or TM6SF2167K plasmids. (E) Pattern diagram for detecting cellular membrane fluidity. Relative membrane fluidity (relative fluorescence units, RFUs) is a ratio of excimer to monomer fluorescence. (F) The membrane fluidity of primary hepatocytes treated with 0.5 mM FFAs for 24 hours in the Tm6sf2167E/E and Tm6sf2167K/K mice. (G) The membrane fluidity in 0.5 mM FFA-treated 293T cells overexpressing TM6SF2167E or TM6SF2167K plasmids. (H) Transmission electron microscopy images of liver tissue from the Tm6sf2167E/E and Tm6sf2167K/K mice fed with HFD. The red arrows indicate the ER. Scale bar: 500 nm. Data are presented as means and SD. Statistical significance was calculated by two-tailed Student’s t test. *P<0.05, **P<0.01; NS, no significance. TM6SF2 transmembrane 6 superfamily member 2; MDA, malondialdehyde; ROS, reactive oxygen species; FFAs, free fatty acids.
Figure 6.
Figure 6.
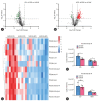
The TM6SF2 E167K variant causes a decrease in the level of PC containing C18:3 in liver. (A, B) Volcano plots of untargeted lipidomics data in liver tissue of the Tm6sf2167E/E and Tm6sf2167K/K mice fed with CD or HFD diet. Green points indicate significantly downregulated lipids (FC<0.65, P<0.05), while red points indicate significantly up-regulated lipids (FC>1.54, P<0.05). (C) Hierarchical clustering analysis of untargeted lipidomics in liver tissue from the Tm6sf2167E/E and Tm6sf2167K/K mice fed with CD or HFD diet. Each row represents a differential lipid molecule. Red represents relatively high expression level, while blue represents relatively low expression level. (D, E) The relative levels of PC (16:0/18:3) +H and PC (18:3/20:4) +H in liver tissue of the Tm6sf2167E/E and Tm6sf2167K/K mice. n=6 per group. Data are presented as means and SD. Statistical significance was calculated by two-tailed Student’s t test. *P<0.05, **P<0.01; NS, no significance. TM6SF2 transmembrane 6 superfamily member 2; PC, phosphatidylcholine; CD, control diet; HFD, high-fat diet.
Figure 7.
Figure 7.
Dietary intervention with PC containing C18:3 significantly attenuates the TM6SF2 E167K-induced hepatic steatosis and injury in HFD-fed mice. (A) PC containing C18:3 dietary intervention in HFD-induced Tm6sf2167E/E and Tm6sf2167K/K mice. (B–L) Body size and liver morphology (B), body weight (C), liver weight (D), hepatic index (E), MDA level of liver tissue (F), hepatocyte membrane fluidity (G), H&E and Oil Red O staining (H), hepatic TG content (I), MASLD activity score (J), plasma ALT level (K), plasma AST level (L) in CD or HFD-induced Tm6sf2167E/E and Tm6sf2167K/K mice with PC containing C18:3 dietary intervention. Scale bar: 50 μm. Data are presented as means and SD. Statistical significance was calculated by two-tailed Student’s t test. *P<0.05, **P<0.01; NS, no significance. PC, phosphatidylcholine; TM6SF2 transmembrane 6 superfamily member 2; HFD, high-fat diet; MDA, malondialdehyde; TG, triglyceride; MASLD, metabolic dysfunction-associated steatotic liver disease; ALT, alanine aminotransferase; AST, aspartate aminotransferase.
Figure 8.
Figure 8.
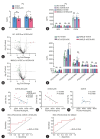
PC (16:0/18:3) is decreased in the plasma of MASLD patients carrying the TM6SF2 E167K variant. (A) Plasma PC level of HC and MASLD patients with TM6SF2167E/E or TM6SF2167E/K+K/K based on targeted lipidomics analysis. (B) Plasma SFA-PC, MUFA-PC, and PUFA-PC levels of HC and MASLD patients with TM6SF2167E/E or TM6SF2167E/K+K/K. (C, D) Volcano plots of targeted lipidomics data in plasma of HC (C) and MASLD patients (D) with TM6SF2167E/E or TM6SF2167E/K+K/K. Green dots represent significantly downregulated lipids (P<0.05), and red dots represent significantly upregulated lipids (P<0.05). (E) Changes in the levels of PC containing C18:3 in HC and MASLD patients with TM6SF2167E/E or TM6SF2167E/K+K/K. (F–H) Correlation between the plasma PC (16:0/18:3) level and the liver fat content in MASLD patients (F), MASLD patients with TM6SF2167E/K+K/K (G), and MASLD patients with TM6SF2167E/E (H). (I) ROC analysis of the plasma PC (16:0/18:3) level for discriminating MASLD patients with TM6SF2167E/E from MASLD patients with TM6SF2167E/K+K/K. (J) ROC analysis of the plasma PC (16:0/18:3) level for discriminating HC from MASLD patients. HC-TM6SF2167E/E (n=6), HC-TM6SF2167E/K+K/K (n=5), MASLD-TM6SF2167E/E (n=11), MASLD-TM6SF2167E/K+K/K (n=10). Data are presented as means and SD. Two-tailed Student’s t test or Mann– Whitney U test was used to compare normally or non-normally distributed data, respectively. Pearson correlation analysis was used to assess the correlation between two parameters. *P<0.05; NS, no significance. PC, phosphatidylcholine; MASLD, metabolic dysfunctionassociated steatotic liver disease; SFA, saturated fatty acid; MUFA, monounsaturated fatty acid; PUFA, polyunsaturated fatty acid; HC, healthy controls; TM6SF2 transmembrane 6 superfamily member 2; ROC, receiver operator characteristic.
None

References

    1. Rinella ME, Lazarus JV, Ratziu V, Francque SM, Sanyal AJ, Kanwal F, et al. A multisociety Delphi consensus statement on new fatty liver disease nomenclature. J Hepatol. 2023;79:1542–1556. - PubMed
    1. Sheka AC, Adeyi O, Thompson J, Hameed B, Crawford PA, Ikramuddin S. Nonalcoholic steatohepatitis: A review. JAMA. 2020;323:1175–1183. - PubMed
    1. Le MH, Le DM, Baez TC, Wu Y, Ito T, Lee EY, et al. Global incidence of non-alcoholic fatty liver disease: A systematic review and meta-analysis of 63 studies and 1,201,807 persons. J Hepatol. 2023;79:287–295. - PubMed
    1. Wong RJ, Aguilar M, Cheung R, Perumpail RB, Harrison SA, Younossi ZM, et al. Nonalcoholic steatohepatitis is the second leading etiology of liver disease among adults awaiting liver transplantation in the United States. Gastroenterology. 2015;148:547–555. - PubMed
    1. Stefan N, Häring HU, Cusi K. Non-alcoholic fatty liver disease: causes, diagnosis, cardiometabolic consequences, and treatment strategies. Lancet Diabetes Endocrinol. 2019;7:313–324. - PubMed

MeSH terms

LinkOut - more resources