. 2024 Jul 11:15:1416990.
doi: 10.3389/fimmu.2024.1416990. eCollection 2024.

Novel biomarkers for prediction of atonic postpartum hemorrhage among 'low-risk' women in labor

Affiliations

Novel biomarkers for prediction of atonic postpartum hemorrhage among 'low-risk' women in labor

Pei Zhang et al. Front Immunol. .

Abstract

Background: Postpartum hemorrhage (PPH) is the primary cause of maternal mortality globally, with uterine atony being the predominant contributing factor. However, accurate prediction of PPH in the general population remains challenging due to a lack of reliable biomarkers.

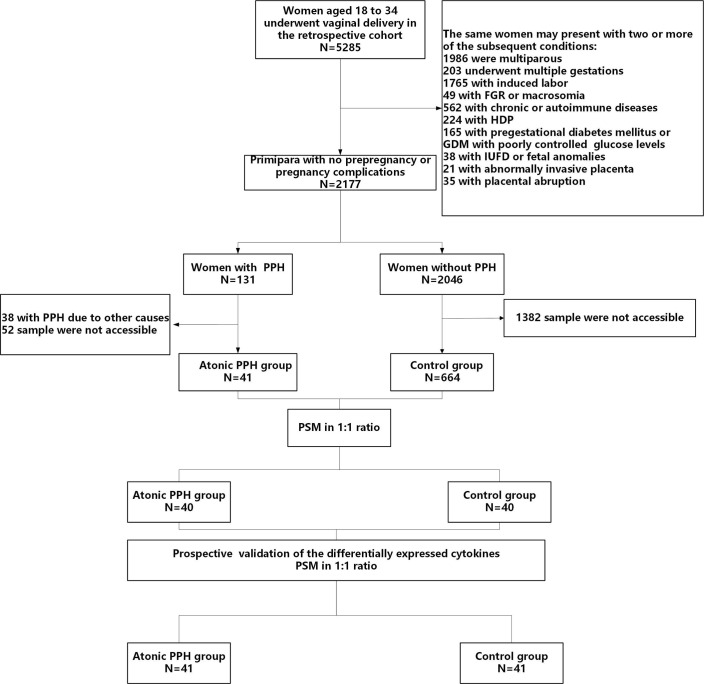
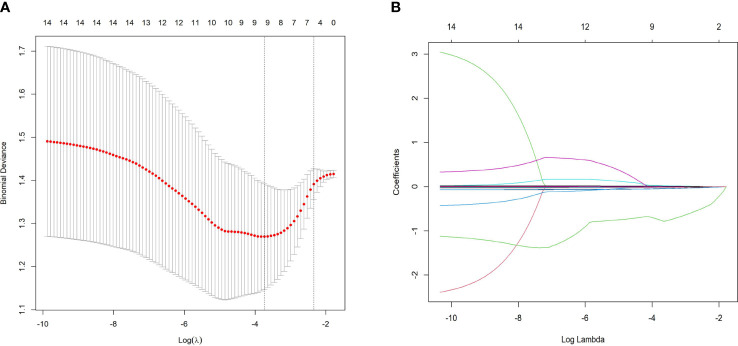
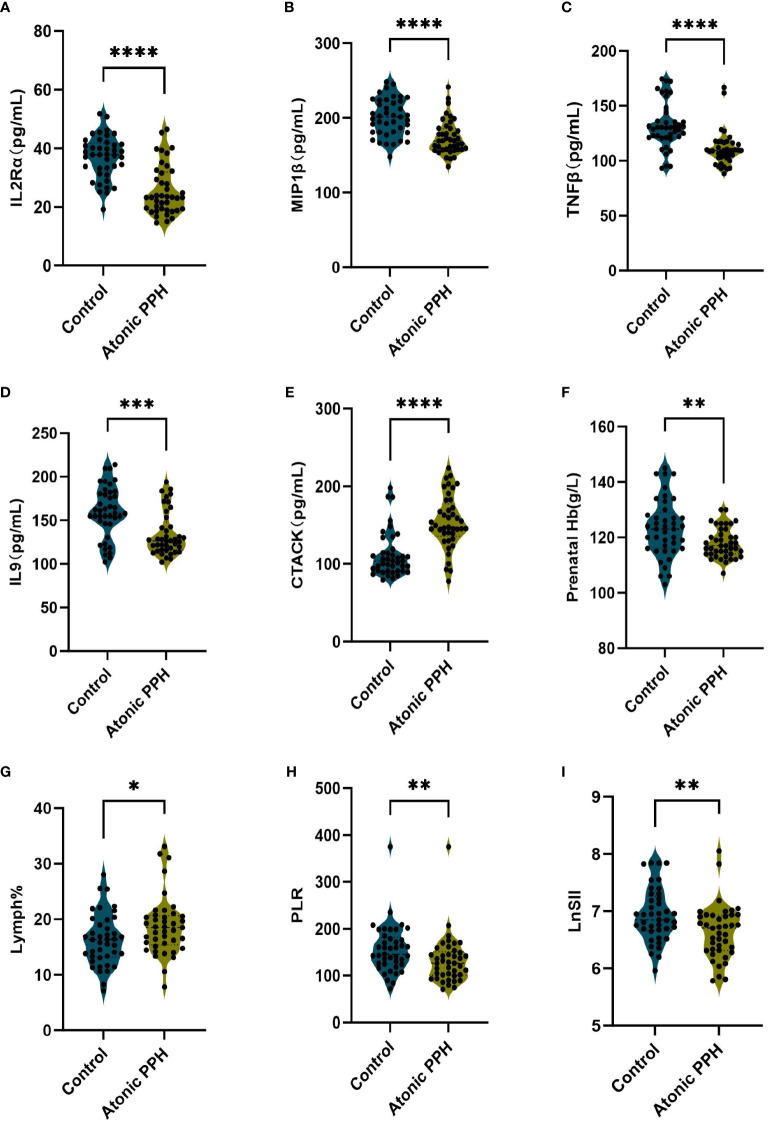
Methods: Using retrospective cohort data, we quantified 48 cytokines in plasma samples from 40 women diagnosed with PPH caused by uterine atony. We also analyzed previously reported hemogram and coagulation parameters related to inflammatory response. The least absolute shrinkage and selection operator (LASSO) and logistic regression were applied to develop predictive models. Established models were further evaluated and temporally validated in a prospective cohort.

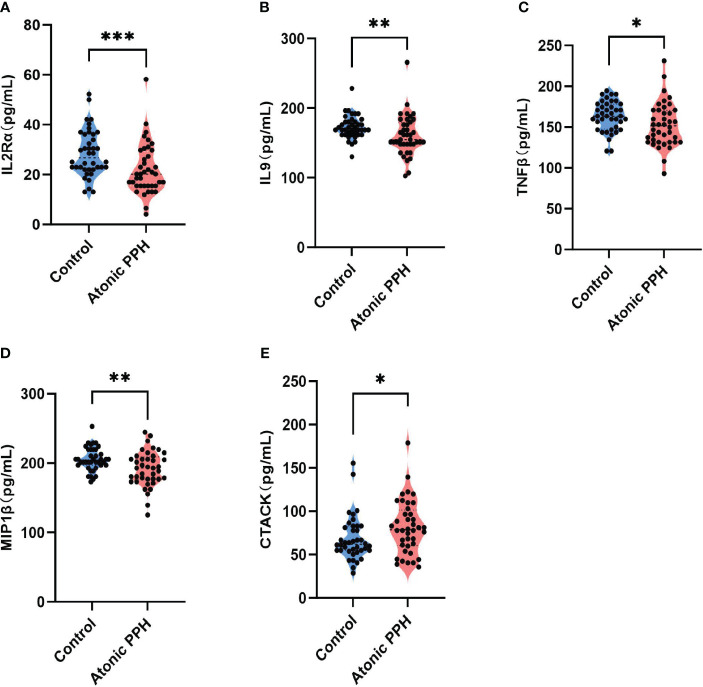
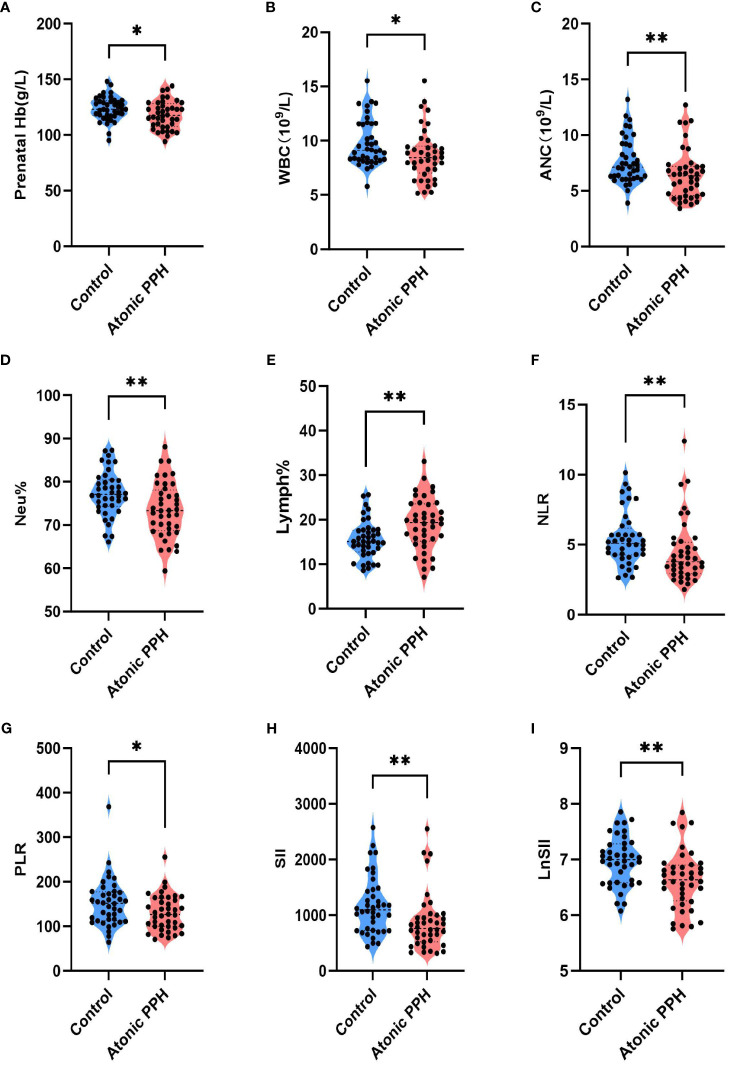
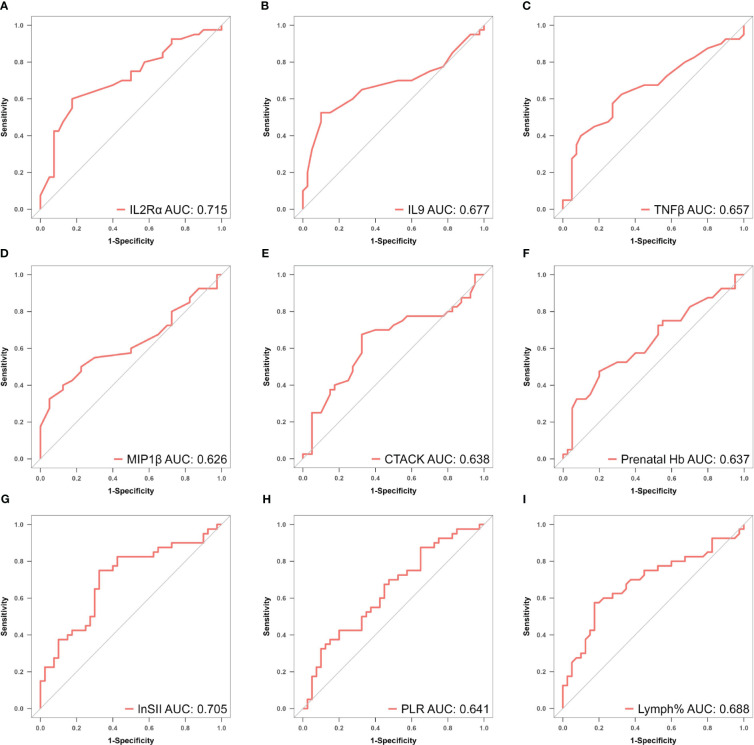
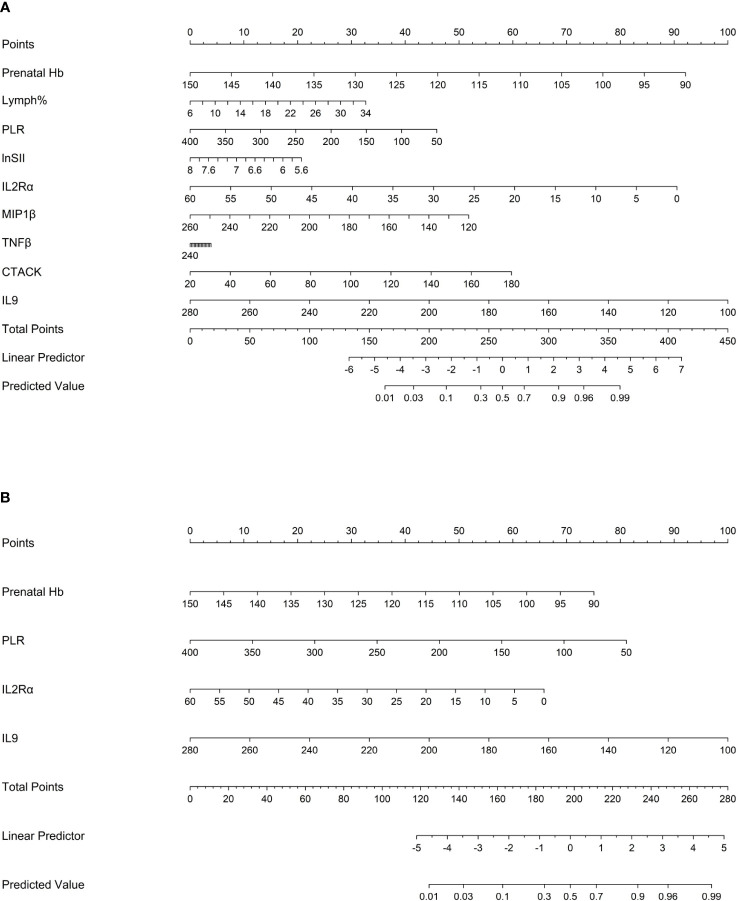
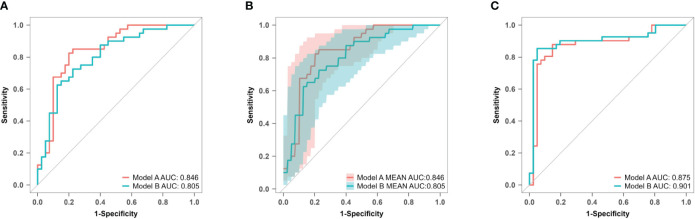
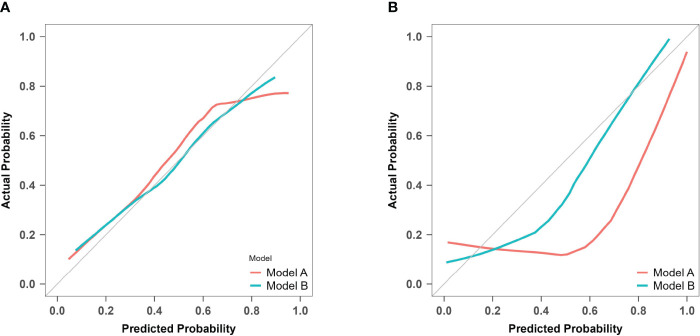
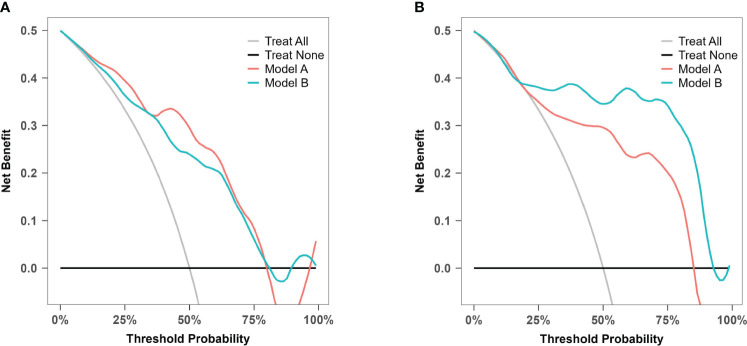
Results: Fourteen factors showed significant differences between the two groups, among which IL2Rα, IL9, MIP1β, TNFβ, CTACK, prenatal Hb, Lymph%, PLR, and LnSII were selected by LASSO to construct predictive model A. Further, by logistic regression, model B was constructed using prenatal Hb, PLR, IL2Rα, and IL9. The area under the curve (AUC) values of model A in the training set, internal validation set, and temporal validation set were 0.846 (0.757-0.934), 0.846 (0.749-0.930), and 0.875 (0.789-0.961), respectively. And the corresponding AUC values for model B were 0.805 (0.709-0.901), 0.805 (0.701-0.894), and 0.901 (0.824-0.979). Decision curve analysis results showed that both nomograms had a high net benefit for predicting atonic PPH.

Conclusion: We identified novel biomarkers and developed predictive models for atonic PPH in women undergoing "low-risk" vaginal delivery, providing immunological insights for further exploration of the mechanism underlying atonic PPH.

Keywords: atonic postpartum hemorrhage; biomarker; coagulation; cytokine; hemogram; prediction.


Conflict of interest statement

The authors declare that the research was conducted in the absence of any commercial or financial relationships that could be construed as a potential conflict of interest.

Figures

Figure 1
Figure 1
Flow diagram illustrating the process of participant screening and enrollment. FGR, fetal growth restriction; HDP, hypertensive disorders of pregnancy; GDM, gestational diabetes mellitus; IUFD, intrauterine fetal death; PPH, postpartum hemorrhage; PSM, propensity score matching.
Figure 2
Figure 2
(A–E) Violin plots show significant differences in 5 plasma cytokines between the atonic PPH group and the normal control group, including (A) IL-2rα, (B) IL-9, (C) TNF-β, (D) MIP1β and (E) CTACK. IL-2rα, interleukin−2Rα; IL-9, interleukin−9; TNF-β, tumor necrosis factor−β; MIP1β, macrophage inflammatory protein-1β; CTACK, cutaneous T cell-attracting chemokine. Mann-Whitney U test was used for assessing intergroup differences across these factors. * P<0.05; ** P<0.01; *** P<0.001.
Figure 3
Figure 3
(A–I) Violin plots show significant differences in 9 hemogram and coagulation indicators between the atonic PPH group and the normal control group, including (A) Prenatal Hb, (B) WBC, (C) ANC, (D) Neu%, (E) Lymph%, (F) NLR, (G) PLR, (H) SII and (I) LnSII. Hb, hemoglobin; WBC, white blood cell count; ANC, absolute neutrophil count; Neu%, proportion of neutrophils; Lymph%, proportion of lymphocytes; NLR, neutrophil-to-lymphocyte ratio; PLR, platelet-to-lymphocyte ratio; SII, systemic immune-inflammation index; LnSII, natural logarithm of SII. Independent samples t-test was employed for Prenatal Hb, Neu%, Lymph% and LnSII. Mann-Whitney U test was used for WBC, ANC, NLR, PLR, and SII. * P<0.05; ** P<0.01; *** P<0.001.
Figure 4
Figure 4
Predictor selection using LASSO regression analysis with tenfold cross-validation. (A) LASSO coefficient profiles of the 14 risk factors were created against the log (λ) sequence. (B) Tuning parameter (lambda, λ) selection of deviance in the LASSO regression based on the minimum criterion (left dotted line) and the 1-SE criterion (right dotted line). In the present study, predictor selection was performed according to the minimum criterion (including Prenatal Hb, Lymph%, PLR, LnSII, IL2Rα, MIP1β, TNFβ, CTACK, and IL9). LASSO least absolute shrinkage and selection operator, SE standard error.
Figure 5
Figure 5
(A–I) ROC curves of identified biomarkers for atonic PPH: (A) IL−2Rα (AUC: 715, 95% CI 0.600–0.829, P < 0.001), (B) IL−9 (AUC: 0.677, 95% CI 0.554–0.800, P = 0.003), (C) TNF−β (AUC: 0.657, 95% CI 0.535–0.764, P = 0.017), (D) MIP1β(AUC: 0.626, 95% CI 0.501–0.752, P = 0.026), (E) CTACK (AUC: 0.638, 95% CI 0.513–0.767, P = 0.039), (F) Prenatal Hb (AUC: 0.637, 95% CI 0.514–0.760, P = 0.017), (G) Lymph% (AUC: 0.688, 95% CI 0.568–0.807, P = 0.002), (H) PLR (AUC: 0.641, 95% CI 0.519–0.762, P = 0.015), and (I) LnSII (AUC: 0.705, 95% CI 0.589–0.821, P = 0.001). IL2Rα, interleukin-2 receptor subunit α; MIP1β, macrophage inflammatory protein-1β; TNF-β, tumor necrosis factor-β; IL9, interleukin-9; CTACK, cutaneous T cell-attracting chemokine; Hb, hemoglobin; Lymph%, lymphocyte ratio; PLR, platelet-to-lymphocyte ratio; SII, systemic immune-inflammation index; LnSII, natural logarithm of SII; ROC, receiver operating characteristic; AUC, area under the ROC curve.
Figure 6
Figure 6
Nomogram1 and nomogram2 were constructed to predict the incidence of atonic PPH among women in labor. (A) Nomogram1 including IL2Rα, IL9, MIP1β, TNF-β, CTACK, Prenatal Hb, Lymph%, PLR, and LnSII for assessing the risk of atonic PPH among women in labor. (B) Nomogram2 including IL2Rα, IL9, Prenatal Hb, and PLR for assessing the risk of atonic PPH among women in labor. Nomogram1 and nomogram2 are used to obtain the risk of atonic PPH by adding up the points identified on the points’ scale for each variable. IL2Rα, interleukin-2 receptor subunit α; MIP1β, macrophage inflammatory protein-1β; TNF-β, tumor necrosis factor-β; IL9, interleukin-9; CTACK, cutaneous T cell-attracting chemokine; Hb, hemoglobin; Lymph%, lymphocyte ratio; PLR, platelet-to-lymphocyte ratio; SII, systemic immune-inflammation index; LnSII, natural logarithm of SII.
Figure 7
Figure 7
(A–I) Violin plots illustrate validated differentially expressed biomarkers between the atonic PPH group and control group in a prospective cohort, including (A) IL-2rα, (B) IL-9, (C) TNF-β, (D) MIP1β, (E) CTACK, (F) Prenatal Hb, (G) Lymph%, (H) PLR and (I) LnSII. IL-2rα, interleukin−2Rα; IL-9, interleukin−9; TNF-β, tumor necrosis factor−β; MIP1β, macrophage inflammatory protein-1β; CTACK, cutaneous T cell-attracting chemokine; Hb, hemoglobin; Lymph%, proportion of lymphocytes; PLR, platelet-to-lymphocyte ratio; LnSII, natural logarithm of SII. Data are presented as mean ± standard deviation or median (interquartile range). Independent samples t-test was employed for Prenatal Hb and LnSII. Mann-Whitney U test was used for IL-2rα, IL-9, TNF-β, MIP1β, CTACK, Lymph% and PLR. * P <0.05; ** P <0.01; *** P <0.001; **** P <0.0001.
Figure 8
Figure 8
ROC curves of model A and model B for predicting atonic PPH. (A) ROC curves of predictive models A and B in the training set. Model A (AUC: 0.846, 95% CI 0.757–0.934, P< 0.001), model B (AUC: 0.805, 95% CI 0.709–0.901, P< 0.001). (B) ROC curves of predictive models A and B in the internal validation set. Model A (AUC: 0.876, 95% CI 0.749–0.930, P< 0.001), model B (AUC: 0.805, 95% CI 0.701–0.894, P< 0.001). (C) ROC curves of predictive models A and B in the temporal validation set. Model A (AUC: 0.875, 95% CI 0.789–0.961, P< 0.001), model B (AUC: 0.901, 95% CI 0.824–0.979, P< 0.001). ROC receiver operating characteristic, AUC area under the ROC curve.
Figure 9
Figure 9
Calibration curves of model A and model B for predicting atonic PPH. (A) Calibration curves for the training cohort of predictive models A and B The red line (Bias corrected line for model A) and the green line (Bias corrected line for model B) represent the performance during internal validation by bootstrapping (B = 1000 repetitions). (B) Calibration curves for the prospective validation of predictive models A and B The red line (Apparent line for model A) and the green line (Apparent line for model B) represent the original performance in a prospective cohort.
Figure 10
Figure 10
Decision curve analysis for model A and model B. (A) Decision curve analysis for prediction model A and B in the training cohort. (B) Decision curve analysis for prediction model A and B in the prospective validation cohort.

Similar articles

References

    1. Bienstock JL, Eke AC, Hueppchen NA. Postpartum hemorrhage. N Engl J Med. (2021) 384:1635–45. doi: 10.1056/NEJMra1513247 - DOI - PMC - PubMed
    1. Say L, Chou D, Gemmill A, Tuncalp O, Moller AB, Daniels J, et al. . Global causes of maternal death: a WHO systematic analysis. Lancet Global Health. (2014) 2:e323–333. doi: 10.1016/S2214-109X(14)70227-X - DOI - PubMed
    1. Dilla AJ, Waters JH, Yazer MH. Clinical validation of risk stratification criteria for peripartum hemorrhage. Obstetrics Gynecol. (2013) 122:120–6. doi: 10.1097/AOG.0b013e3182941c78 - DOI - PubMed
    1. Ruppel H, Liu VX, Gupta NR, Soltesz L, Escobar GJ. Validation of postpartum hemorrhage admission risk factor stratification in a large obstetrics population. Am J Perinatol. (2020) 38:1192–200. doi: 10.1055/s-0040-1712166 - DOI - PMC - PubMed
    1. Escobar MF, Nassar AH, Theron G, Barnea ER, Nicholson W, Ramasauskaite D, et al. . FIGO recommendations on the management of postpartum hemorrhage 2022. Int J Gynaecol Obstet. (2022) 157 Suppl 1:3–50. doi: 10.1002/ijgo.14116 - DOI - PMC - PubMed

LinkOut - more resources