. 2024 Jul 11:15:1423141.
doi: 10.3389/fimmu.2024.1423141. eCollection 2024.

Impaired B-cell function in ERCC2 deficiency

Affiliations

Impaired B-cell function in ERCC2 deficiency

Raphael Rossmanith et al. Front Immunol. .

Abstract

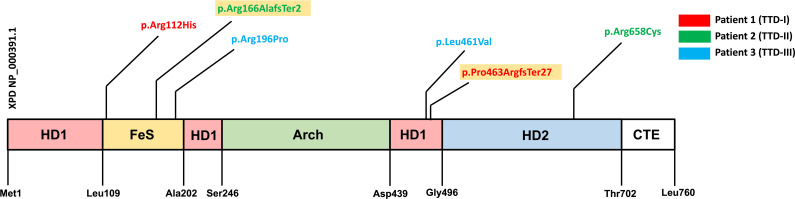
Background: Trichothiodystrophy-1 (TTD1) is an autosomal-recessive disease and caused by mutations in ERCC2, a gene coding for a subunit of the TFIIH transcription and nucleotide-excision repair (NER) factor. In almost half of these patients infectious susceptibility has been reported but the underlying molecular mechanism leading to immunodeficiency is largely unknown.

Objective: The aim of this study was to perform extended molecular and immunological phenotyping in patients suffering from TTD1.

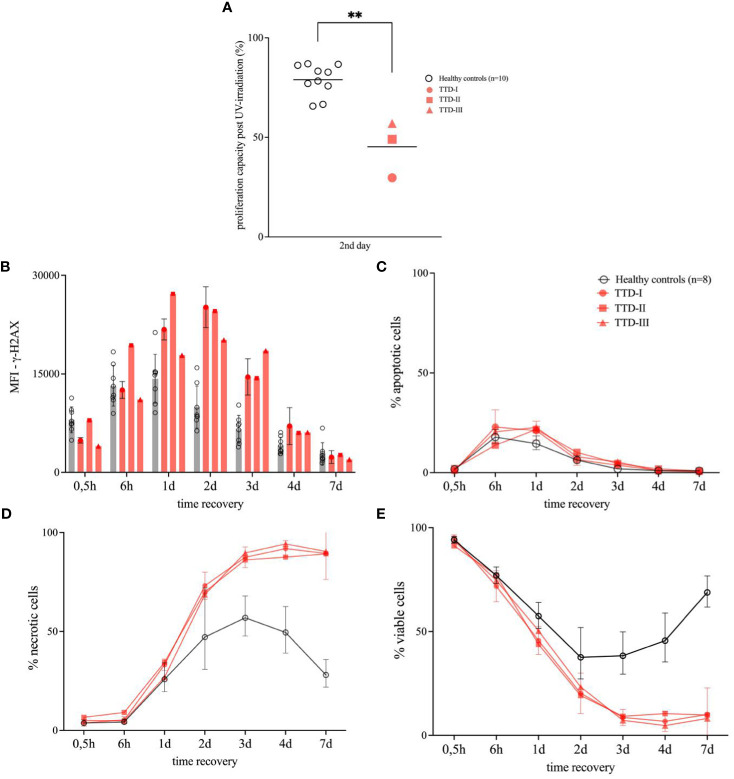
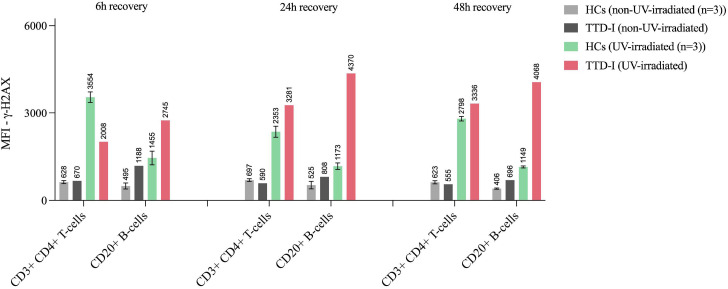
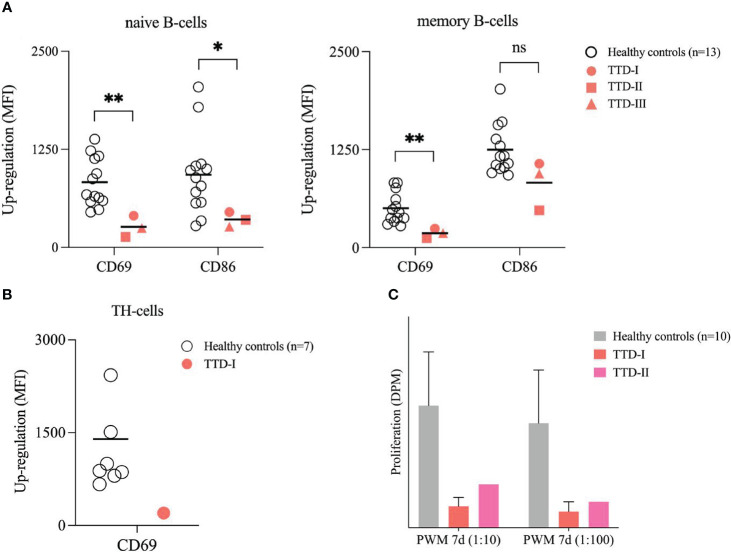
Methods: Cellular immune phenotype was investigated using multicolor flow cytometry. DNA repair efficiency was evaluated in UV-irradiation assays. Furthermore, early BCR activation events and proliferation of TTD1 lymphocytes following DNA damage induction was tested. In addition, we performed differential gene expression analysis in peripheral lymphocytes of TTD1 patients.

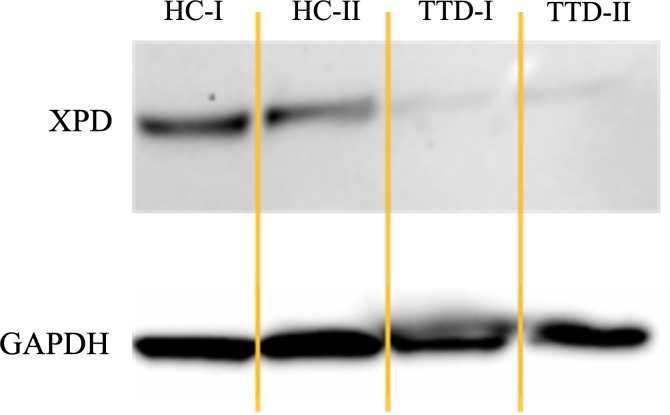
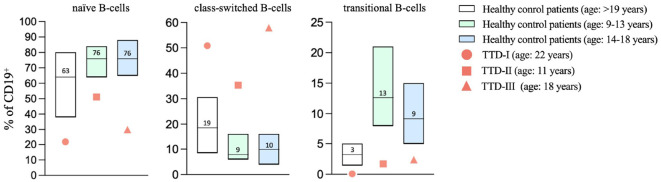
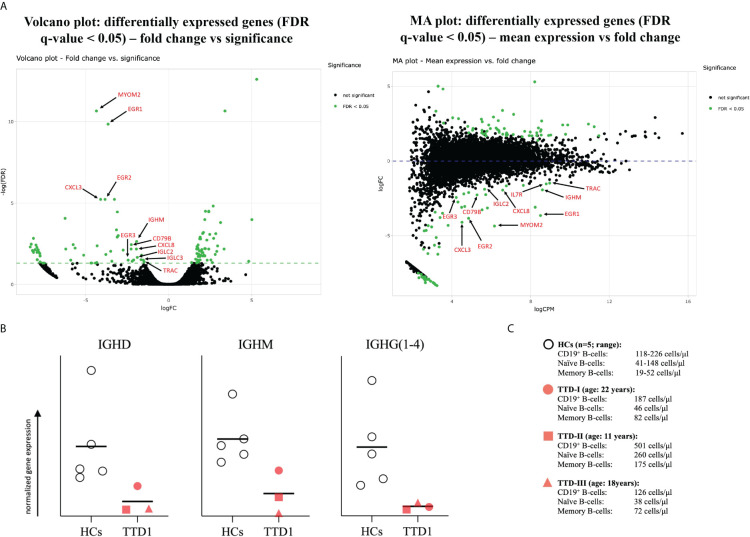
Results: We investigated three unrelated TTD1 patients who presented with recurrent infections early in life of whom two harbored novel ERCC2 mutations and the third patient is a carrier of previously described pathogenic ERCC2 mutations. Hypogammaglobulinemia and decreased antibody responses following vaccination were found. TTD1 B-cells showed accumulation of γ-H2AX levels, decreased proliferation activity and reduced cell viability following UV-irradiation. mRNA sequencing analysis revealed significantly downregulated genes needed for B-cell development and activation. Analysis of B-cell subpopulations showed low numbers of naïve and transitional B-cells in TTD1 patients, indicating abnormal B-cell differentiation in vivo.

Conclusion: In summary, our analyses confirmed the pathogenicity of novel ERCC2 mutations and show that ERCC2 deficiency is associated with antibody deficiency most likely due to altered B-cell differentiation resulting from impaired BCR-mediated B-cell activation and activation-induced gene transcription.

Keywords: B-cell activation; DNA repair deficiency; ERCC2; XPD; antibody deficiency; nucleotide excision repair; primary immunodeficiency; trichothiodystrophy.


Conflict of interest statement

The authors declare that the research was conducted in the absence of any commercial or financial relationships that could be construed as a potential conflict of interest.

Figures

Figure 1
Figure 1
Protein coding variants in the three investigated ERCC2 deficient patients. Schematic presentation of the XPD protein sequence and mutations harbored by the three TTD1 patients. XPD protein domains are shown [HD1, helicase motor domain 1; FeS, iron sulfur cluster domain; Arch, arch domain; HD2, helicase motor domain 2; CTE, c-terminal extension domain (p44 interacting domain)] and amino acid location. Variants are color coded due to three investigated TTD1 patients. Yellow colored variants indicate truncating mutations.
Figure 2
Figure 2
XPD protein expression in TTD1 patients as compared to that of the housekeeping gene GAPDH. LCLs from two healthy controls (HC-I and HC-II) and two patients with trichothiodystrophy-1 (patient 1: TTD-I, patient 2: TTD-II) were harvested, lysed, and examined by Western Blot analysis.
Figure 3
Figure 3
Cellular response to UV-irradiation in lymphoblastoid cell lines (LCLs). LCLs were generated from ≥8 healthy anonymous blood donors (HCs) as well as TTD1 patients (TTD-I, TTD-II and TTD-III) and were used for UV-irradiation experiments. (A) Proliferation capacity of UV-irradiated LCLs. Non-irradiated control cells served as reference for calculation of proliferation activity in each sample (proliferation activity measured in disintegrations per minute (DPM)). LCL cultures were UV-irradiated and thymidine-[methyl-3H] was added 24 hours (2nd day) later. Cells were then incubated for 24 hours to investigate proliferation. Relative values represent proliferation capacity following UV-irradiation. Individual values from HCs are shown as rings and line indicates mean. TTD1 patients are shown in red and line indicates mean. (p-value: **p < 0.01, non-parametric Mann-Whitney U test) (B–E) Viability following UV-irradiation in LCLs. Intracellular signals of γ-H2AX (B, DNA damage), active caspase-3 (C, apoptotic cells) and viability dye (D, necrotic cells) were evaluated by intracellular multicolor flow-cytometry analysis following UV-irradiation and recovery. Mean fluorescence intensities (MFI) represent γ-H2AX levels. Percentage apoptotic cells represent amount of active-caspase-3 positive cells in the culture and percentage necrotic cells were identified by increased levels of intracellular signals of viability dye. Percentage viable cells (E) represent the sum of non-apoptotic and non-necrotic cells in each UV-irradiated cell culture. Non-UV-irradiated cells from each tested individual served as untreated controls (data not shown). Error bars show standard deviations from the mean in HCs. Error bars of TTD1 patient 1 represent the mean of ≥3 performed experiments.
Figure 4
Figure 4
DNA damage response of UV-irradiated lymphocyte subpopulations. Intracellular γ-H2AX intensities following UV-irradiation. CD3+CD4+ T-cells and CD20+ B-cells from 3 healthy controls (HCs) and a TTD1 patient (patient 1). PBMCs were isolated from whole blood via density grade medium and rested overnight. Cells were then UV-irradiated and recovered for 6, 24 and 48 hours. Intracellular staining procedure and multicolor flow cytometry analysis was performed. Mean fluorescence intensities (MFI) represent γ-H2AX levels. Non-irradiated cells served as negative controls (light grey= HCs, dark grey=TTD-I) for UV-irradiated samples (light green= HCs, red= TTD-I). Error bars show the standard deviation from the mean and top numbers represent mean values.
Figure 5
Figure 5
Altered B-cell maturation in TTD1. Peripheral blood samples were collected from healthy blood donors (age: ≥18 years; n=84; white bars present median, P10-P90) and ERCC2 deficient patients (TTD-I: 22 years old, female, values shown as red bullets; TTD-II: 11 years old, male, values shown as red squares, TTD-III: 18 years old, female, values shown as red triangles). Lymphoid subpopulations were analyzed using multicolor flow cytometry. Age-matched controls for patient 2 and 3 (patient 2: age 9-13 years; n=40; light green bars represent median, P10-P90, patient 3: age 14-18 years; n=34, light blue bars represent median, P10-P90) were taken from the literature (Garcia et al., 2019). Bars represent range P10-90, line and counts indicate median values; symbols present values found in ERCC2 deficient patients.
Figure 6
Figure 6
Stimulation of peripheral B- and T-cells. (A) Activation of B-cells in isolated PBMCs. PBMCs from 13 healthy blood donors (HCs; white bullets) and the ERCC2 deficient patients (TTD-I: red bullet, TTD-II: red square; TTD-III: red triangle) were isolated using density gradient medium and adjusted to 1x10⁶ cells/ml medium. Cells were stimulated with SAC/IL-2 for 24 hours. Then the activation capacity was investigated using multicolor flow cytometry. CD69 and CD86 served as early activation markers on cell surface. MFI of non-stimulated cells served as reference for calculation of up-regulation. Lines indicate mean. (p-value: ns= not significant p > 0.05, *p < 0.05, **p < 0.01, non-parametric Mann-Whitney U test) (B) Activation of TH-cells in isolated PBMCs. PBMCs from 10 healthy blood donors (HCs; white bullets) and one ERRC2 deficient patient 1 (TTD-I: red bullet) were isolated as described above and stimulated for 4 hours by addition of PMA/Ionomycin. The up-regulation of CD69 on the TH-cell surface was determined and calculated as described above. Lines indicate mean. (C) Proliferation of lymphocytes following whole blood stimulation. 10 healthy anonymous blood donors (HCs; light grey) and two TTD1 patients (TTD-I= red; TTD-II= magenta) were investigated. With medium diluted (1:20) whole blood was stimulated using different concentrations of pokeweed mitogen (PWM) and incubated for 7 days. Thymidine-[methyl-3H] was added 16-20 hours before cells were harvested for counting beta-radiation. Proliferation activity was recalculated in disintegrations per minute (DPM). Bars indicate mean values (TTD-I: 3 experiments) and error bars of HCs show standard deviation from the mean.
Figure 7
Figure 7
mRNA differential expression and IGH-chain analysis in PBMCs from TTD1 patients. Total RNA was isolated from PBMCs of 5 healthy controls (HCs; light grey bullets) and 3 TTD1 patients (TTD1; red symbols). Library preparation, sequencing and initial bioinformatical analysis was performed by the team of Matthias Hackl, PhD (TAmiRNA GmbH, Vienna, Austria). (A) mRNA differential expression analysis. Volcano and MA plots show significantly (FDR < 0.05) up- and downregulated genes (dots represent gene transcripts; green indicate significance) in PBMCs from three TTD1 patients. Transcripts of immunological importance are marked by red arrows and named by gene symbols. (B) Quantitative evaluation of IGH-chain gene expression. Gene expression of IGH genes (IGHD, IGHM, IGHG(1 to 4) was evaluated from mRNA sequencing data (RPM normalized) and normalized to absolute B-cell counts (IGHD, IGHM to naïve B-cell counts, IGHG to memory B-cells) determined in peripheral blood of each tested individual [shown in (C)]. Results indicate quantitative differences of IGH-chain gene expression from TTD1 patients compared to that found in HC group. Lines indicate mean values.

References

    1. Kusakabe M, Onishi Y, Tada H, Kurihara F, Kusao K, Furukawa M, et al. Mechanism and regulation of DNA damage recognition in nucleotide excision repair. Genes Environ Off J Jpn Environ Mutagen Soc. (2019) 41:2. doi: 10.1186/s41021-019-0119-6 - DOI - PMC - PubMed
    1. Bergmann E, Egly JM. Trichothiodystrophy, a transcription syndrome. Trends Genet TIG. (2001) 17:279–86. doi: 10.1016/S0168-9525(01)02280-6 - DOI - PubMed
    1. Faghri S, Tamura D, Kraemer KH, Digiovanna JJ. Trichothiodystrophy: a systematic review of 112 published cases characterises a wide spectrum of clinical manifestations. J Med Genet. (2008) 45:609–21. doi: 10.1136/jmg.2008.058743 - DOI - PMC - PubMed
    1. Lehmann AR. DNA repair-deficient diseases, xeroderma pigmentosum, Cockayne syndrome and trichothiodystrophy. Biochimie. (2003) 85:1101–11. doi: 10.1016/j.biochi.2003.09.010 - DOI - PubMed
    1. Kraemer KH, Patronas NJ, Schiffmann R, Brooks BP, Tamura D, DiGiovanna JJ. Xeroderma pigmentosum, trichothiodystrophy and Cockayne syndrome: a complex genotype-phenotype relationship. Neuroscience. (2007) 145:1388–96. doi: 10.1016/j.neuroscience.2006.12.020 - DOI - PMC - PubMed

Substances