. 2024 Jul 11:15:1405318.
doi: 10.3389/fimmu.2024.1405318. eCollection 2024.

Differential tumor immune microenvironment coupled with tumor progression or tumor eradication in HPV-antigen expressing squamous cell carcinoma (SCC) models

Affiliations

Differential tumor immune microenvironment coupled with tumor progression or tumor eradication in HPV-antigen expressing squamous cell carcinoma (SCC) models

Arpitha H Shivarudrappa et al. Front Immunol. .

Abstract

Human papilloma virus (HPV) is an etiological factor of head and neck squamous cell carcinoma (HNSCC). To investigate the role of HPV antigen in anti-tumor immunity, we established mouse models by expressing HPV16 E6 and E7 in a SCC tumor cell line. We obtained two HPV antigen-expressing clones (C-225 and C-100) transplantable into C57BL/6 recipients. We found that C-225 elicited complete eradication in C57BL/6 mice (eradicated), whereas C-100 grew progressively (growing). We examined immune tumor microenvironment (TME) using flow cytometry and found that eradicated or growing tumors exhibited differential immune profiles that may influence the outcome of anti-tumor immunity. Surprisingly, the percentage of CD8 and CD4 tumor-infiltrating lymphocytes (TILs) was much higher in growing (C-100) than eradicated (C-225) tumor. However, the TILs upregulated PD-1 and LAG-3 more potently and exhibited impaired effector functions in growing tumor compared to their counterparts in eradicated tumor. C-225 TME is highly enriched with myeloid cells, especially polymorphonuclear (PMN) myeloid-derived suppressor cells (MDSC), whereas the percentage of M-MDSC and tumor-associated macrophages (TAMs) was much higher in C-100 TME, especially M2-TAMs (CD206+). The complete eradication of C-225 depended on CD8 T cells and elicited anti-tumor memory responses upon secondary tumor challenge. We employed DNA sequencing to identify differences in the T cell receptor of peripheral blood lymphocytes pre- and post-secondary tumor challenge. Lastly, C-225 and C-100 tumor lines harbored different somatic mutations. Overall, we uncovered differential immune TME that may underlie the divergent outcomes of anti-tumor immunity by establishing two SCC tumor lines, both of which express HPV16 E6 and E7 antigens. Our experimental models may provide a platform for pinpointing tumor-intrinsic versus host-intrinsic differences in orchestrating an immunosuppressive TME in HNSCCs and for identifying new targets that render tumor cells vulnerable to immune attack.

Keywords: T cell receptor; head and neck squamous cell carcinoma; immunological heterogeneity; individualized anti-tumor immune responses; tumor immune microenvironment.


Conflict of interest statement

The authors declare that the research was conducted in the absence of any commercial or financial relationships that could be construed as a potential conflict of interest. The author(s) declared that they were an editorial board member of Frontiers, at the time of submission. This had no impact on the peer review process and the final decision.

Figures

Figure 1
Figure 1
Generation of two SCC subclones eliciting opposite outcomes when transplanted in vivo. (A) Detection of E7 DNA. Representative gel image showing PCR products of E7 amplicons in C-100, C-225, and mEER (positive control) but not in parental A1419 tumor cells (negative control). (B) Detection of E7 protein. E7 protein expression detected by western blotting in mEER (positive control), C-100, and C-225 but not in parental A1419 tumor cells (negative control). (C, D) Tumor growth curve of C-100 (C) or C-225 (D) in WT B6 recipient mice. Tumor cells (2×10⁶) were inoculated at the flank region of WT B6 mice (n=9 for C-100; n=6 for C-225). (E) H&E analysis of C-225 tumors. Tumor samples were collected on day 4 and day 7 after tumor inoculation. Top panel: scan of the entire slides; Bottom panel: enlarged images of the selected region (black square in top panel). Magnification: 20×. (F) Tumor growth curve of first and secondary challenge with C-225 tumor cells. WT B6 mice (n=6) that rejected the first tumor challenged were re-challenged again on day 52 after the first tumor inoculation. (G, H) Percentage of recipient mice eradicating or succumbing to C-225 tumors. The percentage of WT B6 (n=13) (H) or CD8-KO (n=16) (G) mice that eradicated C-225 tumors or succumbed to tumor progression. (I) Tumor growth curve of CD8-KO recipient mice (n=8).
Figure 2
Figure 2
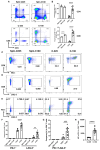
Characterization of CD4 and CD8 TILs in the TME of C-225 vs. C-100 tumors. Flow cytometry analysis was performed for spleen controls from tumor-bearing (TB) mice or CD4 and CD8 TILs from C-225 (n=7) or C-100 (n=12) tumors for all panels. Tumor and spleen samples were collected on day 7 or day 30 post-tumor injection, for C-225 or C-100, respectively. (A) Representative flow plots of CD4 and CD8 T cells in TB spleen (top panel) and tumors (bottom panel). (B) Quantification of the percentage of CD4+ or CD8+ T cells in CD45+ population of spleen controls, C-225 and C-100 tumors. (C-H) Differential expression of immune checkpoint molecules in CD8 T cells. Splenic CD8 T cells and CD8 TILs from C-100 and C-225 tumors were stained with anti-PD1 and anti-LAG-3 Abs. Representative flow plots are shown for CD8 vs. PD-1 (C), CD8 vs. LAG-3 (D), or PD-1 vs. LAG-3 (gated on CD8+ T cells) (E). (F, G) Quantification of the percentage of CD8 T cells expressing different immune checkpoints in TB splenic control and tumors including PD-1 or LAG-3 (F) or both PD-1 and LAG-3 (G). (H) A lower level of PD-1 expression in CD8 TILs of C-225 tumors shown by the MFI of PD-1. Statistical significance was calculated with an unpaired t-test; **P < 0.01, ***P < 0.001, **** <0.0001.
Figure 3
Figure 3
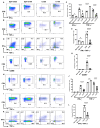
Reduced effector functions of CD4 and CD8 TILs in C-100 tumors. Flow cytometry analysis was performed as described in Figure 2 (n=7 for C-225; n=12 for C-100). (A-G) Effector molecule expression in CD8 T cells. Representative flow plots for the expression levels of IFN-γ (A), TNF-α (B), or IFN-γ+TNF-α+ (D) in CD8 T cells. (C, E) Quantification of the percentage of CD8 T cells expressing IFN-γ or TNF-α (C) or both IFN-γ+TNF-α+ (E) in TB splenic control or C-100 and C225 tumors. (F, G) Expression of GZMB in CD8 T cells. Representative flow plots of CD8 T cells expressing GZMB (F). Quantification of the percentage of CD8 T cells expressing GZMB (G) in different groups. (H-L) Effector molecule expression in CD4 T cells. Representative flow plots for the expression levels of IFN-γ (H), TNF-α (I), or IFN-γ+TNF-α+ (K) in CD4 T cells. (J, L) Quantification of the percentage of CD4 T cells expressing IFN-γ or TNF-α (J) or both IFN-γ+TNF-α+ (L) in different groups. Statistical significance was calculated with an unpaired t-test; *P < 0.05 **P < 0.01.
Figure 4
Figure 4
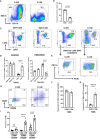
The drastic expansion of PMN-MDSCs in the TME of C-225 tumors. Flow cytometry analysis was performed for TB splenic control or tumor samples from tumor-bearing mice with C-225 (n=7) or C-100 (n=4) tumors, respectively, for all panels. (A, B) Representative flow plots for CD11b+ population within CD45+ population in C-225 or C-100 tumors (A). Quantification of the percentage of CD11b+ population within CD45+ population (B). (C, D) Analysis of different subsets of MDSCs (gated on CD11b+ population). Representative flow plots (C) for different subsets: M-MDSC (Ly6ChighLy6G), PMN-MDSC (Ly6ClowLy6G+), and Ly6CLy6G. Quantification of the percentage of M-MDSC or PMN-MDSC within CD11b+ population in indicated groups (D). (E) Representative flow plots for TAM population gated on Ly6CLy6G population in panel C and displayed for CD11b vs. F4/80. (F, G) Quantification of the percentage of TAMs (CD11b+F4/80+Ly6CLy6G) within Ly6CLy6G population (F) or within total CD11b+ population (G). (H) Representative flow plots for TAMs (CD11b+Ly6CLy6GF4/80+) expressing CD86 and/or CD206 in C-225 or C-100 tumors. (I) Quantification of the percentages of M1 (CD86+CD206) and M2 (CD86CD206+) TAMs. Statistical significance was calculated with an unpaired t-test; **P < 0.01, ***P < 0.001, **** <0.0001.
Figure 5
Figure 5
T cell receptor (TCR) dynamic changes upon secondary challenge of C-225 tumor cells. (A) Schematic of tumor challenge and sample collection. WT B6 mice (n=7) that eradicated C-225 tumors were challenged with C-225 tumor on day 109 after the first tumor inoculation. Blood samples were collected 7 days before (day 102, pre-challenge, n=7) and 7 days after rechallenging (day 116, post-challenge, n=7). (B) Greater TCRβ clonal expansion in post-challenge (post1-post7) samples than pre-challenge (pre1-pre7) ones. Left: individual bar graph representing the occupied repertoire space for each sample sequenced with the proportion of each group’s TCRβ clonotypes shown color-coded according to clonotype indices such as 1:10, 11:20 or 21:50. Right: TCR clonotypes were sorted into different groups according to specific indices such as 1:10 or 11:20. The proportion of the clonotypes in each group was averaged for 7 pre- or 7 post-challenge samples (Pre-PBMC vs. Post-PBMC). P values are listed on top of each bar graph. Statistical difference was calculated with Wilcoxon rank sum test. (C) Clonotype tracking for the prevalent TCRβ clonotypes detected in all 7 pre- or 7 post-challenge samples. The proportion of a given TCRβ clonotype within each sample is shown along the y axis while sample ID is shown along x axis. (D) Newly emerging TCR clonotypes dominate in the top-ranked 20 clones in post-challenge samples. The top-ranked 20 clones from 7 post-challenge samples (n=140) were separated into three groups based on their clonal frequency in pre-challenge samples: newly emerging (clonal frequency=0), pre-existing (clonal frequency>0 but not in pre-top 20) and Pre-top20 (ranked in top 20 clones in the corresponding pre-challenge sample). The percentage of clonotypes in each group is shown. (E) Clonotype tracking of post-challenge (post 1) top-ranked 20 clones in corresponding pre-challenge samples (pre1). (F) Clonotype tracking of pre-challenge (pre 1) top-ranked 20 clones in corresponding post-challenge sample (post 1).
Figure 6
Figure 6
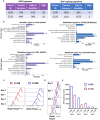
Tumor-intrinsic differences in C-100 and C-225 tumor cells. (A) WES analysis by GATK-pipeline (left) and BCFtools mpileup-pipeline (right) revealed different numbers of variants in C-100 or C-225 tumor cells compared to parental A1419 tumor cells. (B) Mutation types in C-100 or C-225 tumor cells. Number of mutations identified in each category in C-100 or C-225 tumor cells using either GATK or BCFtools mpileup pipeline. (C-E) Tumor cell proliferation assays. Tumor cells were labeled with CellTrace™ Violet and cultured for 1, 2, and 3 days. Cells harvested on specific days along with day 0 samples were analyzed by flow cytometry. Populations with less intensity of CellTrace™ Violet staining (C-100) indicate more cell divisions. (C) Representative histogram for the proliferation of C-100 (red) and C-225 (blue) tumor cells on indicated days. (D) Overlay of the histogram of C-225 vs. C-100 for comparison of cell proliferation on indicated days. C-100 tumor cells exhibited less intensity (more dilution of CellTrace™ Violet) indicating more proliferation. (E) Quantification of mean fluorescence intensity (MFI) of CellTrace™ Violet in C-225 (blue) and C-100 (red) tumor cells on indicated days. Statistical significance was calculated by student’s t test, p value for C-225 vs. C-100 on day 0 = 0.0002, day 1 < 0.0001, day 2 < 0.0001, and day 3 < 0.0001.

References

    1. Bray F, Ferlay J, Soerjomataram I, Siegel RL, Torre LA, Jemal A. Global cancer statistics 2018: GLOBOCAN estimates of incidence and mortality worldwide for 36 cancers in 185 countries. CA: A Cancer J Clin. (2018) 68:394–424. doi: 10.3322/caac.21492 - DOI - PubMed
    1. Cramer JD, Burtness B, Le QT, Ferris RL. The changing therapeutic landscape of head and neck cancer. Nat Rev Clin Oncol. (2019) 16:669–83. doi: 10.1038/s41571-019-0227-z - DOI - PubMed
    1. Du E, Mazul AL, Farquhar D, Brennan P, Anantharaman D, Abedi-Ardekani B, et al. . Long-term survival in head and neck cancer: impact of site, stage, smoking, and human papillomavirus status. Laryngoscope. (2019) 129:2506–13. doi: 10.1002/lary.27807 - DOI - PMC - PubMed
    1. Liang C, Marsit CJ, McClean MD, Nelson HH, Christensen BC, Haddad RI, et al. . Biomarkers of HPV in head and neck squamous cell carcinoma. Cancer Res. (2012) 72:5004–13. doi: 10.1158/0008-5472.CAN-11-3277 - DOI - PMC - PubMed
    1. Wang Z, Xia RH, Ye DX, Li J. Human papillomavirus 16 infection and TP53 mutation: two distinct pathogeneses for oropharyngeal squamous cell carcinoma in an eastern chinese population. PloS One. (2016) 11:e0164491. doi: 10.1371/journal.pone.0164491 - DOI - PMC - PubMed

MeSH terms

Substances