. 2024 Jun 12;27(7):110260.
doi: 10.1016/j.isci.2024.110260. eCollection 2024 Jul 19.

Characterizing replisome disassembly in human cells

Affiliations

Characterizing replisome disassembly in human cells

Rebecca M Jones et al. iScience. .

Abstract

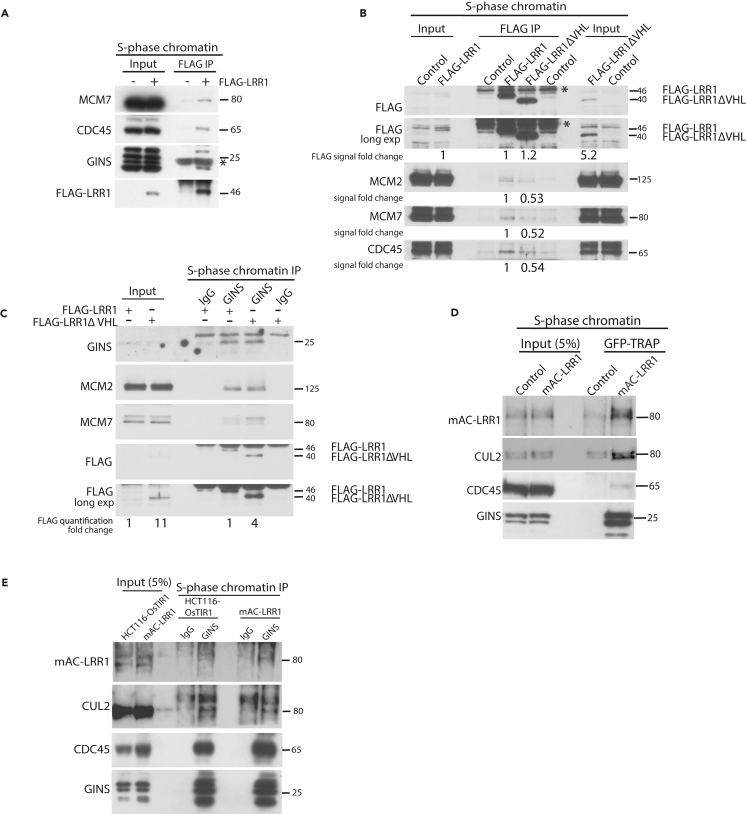
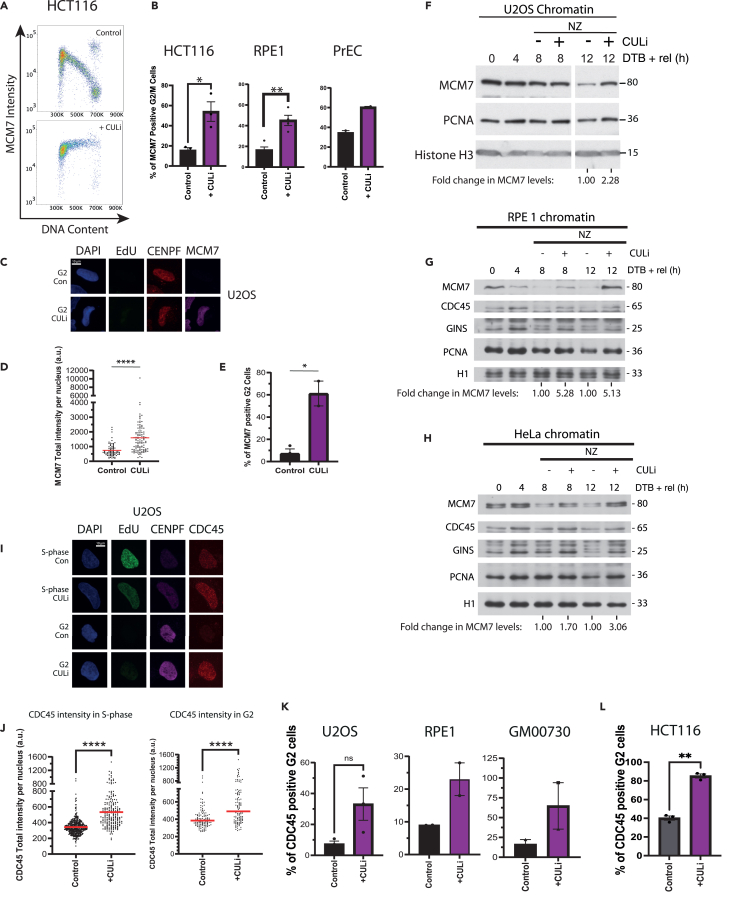
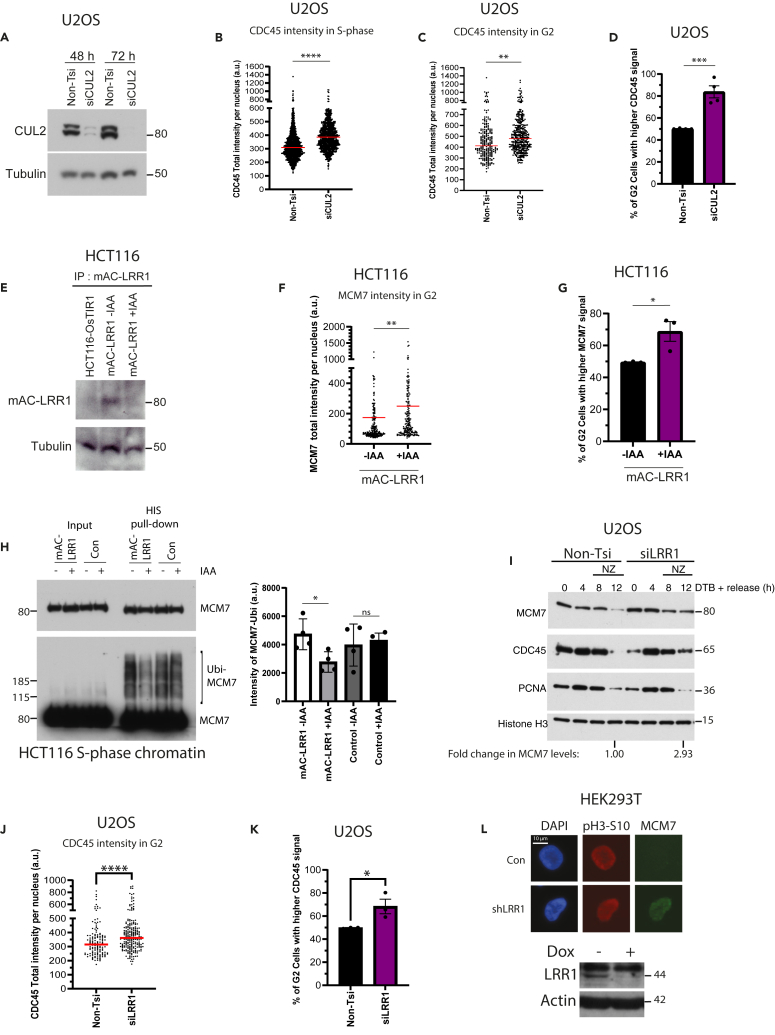
To ensure timely duplication of the entire eukaryotic genome, thousands of replication machineries (replisomes) act on genomic DNA at any time during S phase. In the final stages of this process, replisomes are unloaded from chromatin. Unloading is driven by polyubiquitylation of MCM7, a subunit of the terminated replicative helicase, and processed by p97/VCP segregase. Most of our knowledge of replication termination comes from model organisms, and little is known about how this process is executed and regulated in human somatic cells. Here we show that replisome disassembly in this system requires CUL2LRR1-driven MCM7 ubiquitylation, p97, and UBXN7 for unloading and provide evidence for "backup" mitotic replisome disassembly, demonstrating conservation of such mechanisms. Finally, we find that small-molecule inhibitors against Cullin ubiquitin ligases (CULi) and p97 (p97i) affect replisome unloading but also lead to induction of replication stress in cells, which limits their usefulness to specifically target replisome disassembly processes.

Keywords: biochemistry; cell biology; genetics.


Conflict of interest statement

The authors declare no competing interests.

Figures

None
Graphical abstract
Figure 1
Figure 1
Schematic of replisome unloading during S-phase and mitosis
Figure 2
Figure 2
MCM7 is polyubiquitylated with K48-linked chains in S-phase (A) MCM7 is ubiquitylated on chromatin. U2OS cells expressing FLAG-MCM7 were optionally transfected with HIS-Ubi plasmid for 48 h. Cells from asynchronous population were extracted with CSK buffer, and HIS-tagged/ubiquitylated proteins were then isolated from chromatin samples under denaturing conditions and samples analyzed through western blotting with indicated antibodies. (B) MCM7 is ubiquitylated on chromatin during S-phase. As in (A) but cells were initially synchronized with nocodazole and released so as to gather cells from G1 and S-phase. FLAG-MCM7 signal was detected in HIS-Ubi pull-down samples and bromodeoxyuridine (BrdU) incorporation was determined by FACS analysis for G1 and S-phase samples. (C) MCM7 is ubiquitylated on chromatin in S-phase with K48-linked ubiquitin chains. U2OS cells expressing FLAG-MCM7 were synchronized with DTB and then released for the indicated time before cells were extracted with CSK buffer in denaturing conditions. FLAG-MCM7 was then isolated from chromatin with anti-FLAG beads and samples analyzed through western blotting with indicated antibodies. (D) U2OS cells were transfected with HIS-Ubi-WT or HIS-Ubi-K48R plasmid, synchronized with STB and then released for 6 h. HIS-tagged proteins were isolated using the HIS pull-down assay and samples analyzed by western blotting with the indicated antibodies. Levels of MCM7 ubiquitylation were quantified using ImageJ (n = 3) (p = 0.0424, Two-tailed paired t test); mean value +/− SEM.
Figure 3
Figure 3
CUL2LRR1 interacts with the replisome during S-phase (A) LRR1 interacts with replisome components on chromatin during S-phase. Chromatin extracts of FLAG-LRR1 expressing cells synchronized in S-phase by release from DTB were immunoprecipitated with FLAG M2 beads. Immunoprecipitated samples were analyzed by western blotting with indicated antibodies. (B) LRR1ΔVHL mutant, unable to interact with CUL2, can still interact with the replisome. Chromatin extracts of FLAG-LRR1 or FLAG-LRR1ΔVHL-expressing cells synchronized in S-phase by release from DTB were immunoprecipitated with FLAG M2 beads. Immunoprecipitated samples were analyzed by western blotting with indicated antibodies. The western blot signal was quantified for all proteins in IP samples and FLAG-signal in IP and input (chromatin fraction) and represented as a fold change over the WT FLAG-LRR1 underneath the western blot. (C) GINS was immunoprecipitated from chromatin extracts of FLAG-LRR1 or FLAG-LRR1ΔVHL-expressing cells, synchronized in S-phase (DTB release). Immunoprecipitated samples were analyzed by western blotting with indicated antibodies. The western blot signal was quantified for FLAG-signal in IP and input (chromatin fraction) and represented as a fold change over the WT FLAG-LRR1 underneath the western blot. (D) Endogenous mAC-tagged LRR1 can interact with replisome components on chromatin in S-phase. Chromatin extracts of mAC-LRR1-expressing cells, synchronized in S-phase (with lovastatin release), were enriched on GFP-Trap magnetic agarose. Immunoprecipitated samples were analyzed by western blotting with indicated antibodies. (E) CUL2 and endogenous LRR1 can interact with GINS on S-phase chromatin. Chromatin extracts of mAC-LRR1 expressing cells, synchronized in S-phase as in (D), were co-immunoprecipitated with GINS antibody after treatment with p97i (5 μM). Immunoprecipitated samples were analyzed by western blotting with indicated antibodies.
Figure 4
Figure 4
Cullin ligase inhibitor leads to replisome retention on the chromatin (A) MCM7 accumulates on chromatin upon CULi treatment. Asynchronous HCT116 cells were treated with CULi for 6 h. Cells were harvested and extracted with CSK buffer to visualize MCM7 bound to chromatin. Example FACS plots for the total MCM7 intensity (y axis) against DNA content (x axis) in HCT116 cells. Shown are untreated control (top) and +CULi (bottom). (B) Quantification of the percentage of G2/M cells positive for MCM7 in HCT116 cells from (A) (n = 3) (p = 0.0187, unpaired t test), but also from RPE1 cells (see Figure S5B) (n = 4) (p = 0.0026, unpaired t test) and PrEC cells (see Figure S5C) (n = 2). All mean ± SEM. (C) MCM7 accumulates on chromatin upon CULi treatment; representative immunofluorescence images of chromatin-bound EdU, CENPF, and MCM7 in G2-phase U2OS cells in asynchronous population ± CULi. (D) Quantification of (C): chromatin-bound MCM7 intensity in CENPF-positive/EdU-negative cells (AVG > 30 cells/sample). Red lines indicate the median (n = 3) (p=<0.0001, Two-tailed Mann Whitney test). (E) Quantification of (C): the total proportions of G2 cells positive for MCM7, mean ± SEM (n = 3) (p = 0.0121, Two-tailed unpaired t test). (F) MCM7 accumulates on chromatin upon CULi treatment in synchronized U2OS cells. U2OS cells were synchronized with DTB and released for indicated times ± CULi ± nocodazole (NZ). Cells were extracted with CSK buffer and chromatin samples analyzed through western blotting with indicated antibodies. (G) Same as for (F) but in RPE1 cells. (H) Same as for (F) but in HeLa cells. (I) CDC45 accumulates on chromatin upon CULi treatment - representative immunofluorescence images of chromatin-bound EdU, CENPF, and CDC45 in S-phase and G2-phase U2OS cells in asynchronous population ± CULi. (J) Quantification of (I): total chromatin-bound CDC45 intensity in EdU-positive (S-phase) (AVG > 100 cells/sample) and CENPF-positive (G2) cells (AVG > 35 cells/sample) (n = 3). Red lines indicate the median (p=<0.0001 for both, Two-tailed Mann Whitney test). (K) Quantification of (I): the total proportion of G2 U2OS cells positive for CDC45 (n = 3) (p = 0.0727, Two-tailed paired t test), mean ± SEM. Also for RPE1 cells (n = 2) (AVG > 40 cells/sample) and GM00730 cells (n = 2) (AVG > 35 cells/sample). (L) CDC45 accumulates on chromatin upon CULi treatment in HCT116 cells. Cells were synchronized in mid S-phase (24 h lovastatin and 14 h mevalonic acid release) and treated ± CULi for 2 h, followed by WEE1i for 1 h before cells were fixed and analyzed with QIBC (AVG > 4175 cells/sample). Shown is the quantification of the proportion of G2-phase HCT116 cells positive for CDC45, n = 3, mean ± SEM shown, (p = 0.0083, two-tailed Student’s t test).
Figure 5
Figure 5
CUL2 or LRR1 depletion leads to replisome retention on the chromatin (A) CUL2 downregulation by siRNA. U2OS cells were transfected with Non-T or CUL2 siRNA (two sequences used in combination; see Oligonucleotides in key resources table) for 48 or 72 h. Whole-cell extract samples were then analyzed by western blotting with the indicated antibodies. (B) CDC45 accumulates on chromatin in S-phase upon depletion of CUL2. Asynchronous U2OS cells transfected with Non-T or CUL2 siRNA for 72 h were analyzed by immunofluorescence. Shown is the quantification of total chromatin-bound CDC45 intensity in EdU-positive (S-phase) cells (n = 4) (AVG > 295 cells/sample). Red lines indicate the median (p=<0.0001, Two-tailed Mann-Whitney test). (C) Same as for (B) but in CENPF-positive (G2) cells (n = 4) (p = 0.0076, Two-tailed Mann-Whitney test) (AVG > 80 cells/sample). (D) Same as for (C) but quantification of the percentage of G2 cells with CDC45 signal above the median of Non-Tsi level (n = 4) (p = 0.0009, Two-tailed unpaired t test); mean value +/− SEM. (E) Degradation of mAC-LRR1 after 24 h of auxin treatment. Whole-cell extracts of HCT116-OsTIR1 cells expressing mAC-LRR1 were incubated with GFP-Trap Magnetic Agarose and samples analyzed by western blotting with indicated antibodies. (F) MCM7 accumulates on chromatin in G2 cells upon mAC-LRR1 depletion. HCT116 LRR1-mAC cells were treated with DOX for 48 h and ±IAA for 24 h and analyzed by immunofluorescence. Shown is the quantification of chromatin-bound MCM7 intensity in CENPF-positive (G2) cells (n = 3) (AVG > 70 cells/sample). Red lines indicate the median (p=<0.0001, Two-tailed Mann-Whitney test). (G) Same as for (F) but quantification of the percentage of G2 cells with MCM7 signal above the median of -IAA cells (n = 3) (p = 0.0359, Two-tailed unpaired t test); mean value +/− SEM. (H) Ubiquitylation of MCM7 on chromatin is reduced in S-phase following LRR downregulation. HCT116 LRR1-mAC cells were treated with DOX for 48 h, transfected with HIS-Ubi plasmid, synchronized with STB and released for 6 h ± IAA. HIS-tagged proteins were isolated using the HIS pull-down assay and samples analyzed by western blotting with the indicated antibodies. Levels of MCM7 ubiquitylation were then quantified using ImageJ. Mean ± SEM (n = 4) (p = 0.0145, Two-tailed paired t test). (I) CMG components accumulate on chromatin in synchronized cells upon LRR downregulation. U2OS cells were transfected with Non-T or LRR1 siRNA (see Oligonucleotides in key resources table), synchronized with DTB and then released for indicated time points, with addition of NZ at 8 h. Chromatin was extracted with CSK buffer and samples analyzed by western blotting with indicated antibodies. (J) CDC45 accumulates on chromatin in G2 cells upon LRR1 downregulation. Asynchronous U2OS cells transfected with Non-T or LRR1 siRNA for 72 h were analyzed by immunofluorescence. Shown is the quantification of total chromatin-bound CDC45 intensity in CENPF-positive (G2) cells (n = 3) (p=<0.0001, Two-tailed Mann-Whitney test) (AVG > 60 cells/sample). Red lines indicate the median. (K) Same as for (J) but quantification of the percentage of G2 cells with CDC45 signal above the median of Non-Tsi control cells (n = 3) (p = 0.0417, Two-tailed unpaired t test); mean value +/− SEM. (L) MCM7 accumulates on G2 chromatin upon LRR1 downregulation. Whole-cell extracts of HEK293T cells inducibly expressing LRR1 shRNA (see STAR Methods) for 6 days were analyzed by western blotting with indicated antibodies. Also shown is the representative immunofluorescence images of chromatin-bound pH3-S10 and MCM7 in G2-phase cells expressing LRR1 shRNA.
Figure 6
Figure 6
p97 inhibition leads to replisome retention on the chromatin (A) p97i treatment affects loading and unloading of MCM7 from chromatin. Flow cytometric analysis of the MCM7 chromatin binding pattern following 6 h p97i treatment in asynchronous HCT116 cell culture. Shown are representative plots showing total MCM7 intensity (y axis) against DNA content (x axis). Overall binding pattern throughout the cell cycle (top), gated examples of G1 cells only (middle) and gated examples of G2/M cells only (bottom), used for quantification. (B) Quantification of (A): percentage of G2/M cells positive for MCM7 in HCT116 (n = 3) (p = 0.0068, unpaired t test). Also for RPE1 (see Figure S8A) (n = 4) (p = 0.0051, unpaired t test), PrEC (see Figure S8A) (n = 2) (p = 0.0491) and HEK293T cells (see Figure S8A) (n = 4) (p=<0.0001, unpaired t test). All mean ± SEM. (C) CDC45 accumulates on chromatin in S-phase and G2 phase upon p97i treatment - representative immunofluorescence images of chromatin-bound EdU and CDC45 in EdU-positive (S-phase) and chromatin-bound CENPF and CDC45 in CENPF-positive (G2) U2OS cells from asynchronous population, treated ± p97i for 6 h. Also shown is quantification of chromatin-bound CDC45 intensity in EdU-positive (S-phase) (n = 3) (AVG > 96 cells/sample) and CENPF-positive (G2) (n = 3; relative to nuclei size) (AVG > 35 cells/sample) cells. Red lines indicate the median (p=<0.0001 for both, Two-tailed Mann-Whitney test). (D) Same as for (C) but quantification of the percentage of G2 cells positive for CDC45 in U2OS treated with p97i (n = 3) (p = 0.0074, Two-tailed paired t test) (AVG > 35 cells/sample), RPE1 (n = 2) (AVG > 35 cells/sample) and GM00730 cells (n = 2) (AVG > 45 cells/sample); mean value +/− SEM. (E) Replisome components accumulate on chromatin upon p97i treatment in synchronized RPE1 cells. RPE1 cells were synchronized with DTB and released for indicated time points ± p97i ± nocodazole (NZ). Cells were extracted with CSK buffer and chromatin samples analyzed through western blotting with indicated antibodies. (F) Same as for (E) but in HeLa cells. (G) Ubiquitylation of MCM7 on chromatin in S-phase is increased following p97i. U2OS cells were transfected with HIS-Ubi plasmid, synchronized with STB and released for 6 h ± p97i. HIS-tagged proteins were isolated using the HIS pull-down assay and samples analyzed by western blotting with the indicated antibodies. Levels of MCM7 ubiquitylation were quantified using ImageJ; mean ± SEM (n = 3) (p = 0.0243, Two-tailed unpaired t test). (H) CDC45 accumulates on chromatin in G2 upon UBXN7 depletion; representative immunofluorescence images of chromatin-bound CENPF and CDC45 in G2-phase U2OS cells from asynchronous population, treated ± UBXN7 siRNA (see Oligonucleotides in key resources table) for 72 h. Also shown is quantification of chromatin-bound CDC45 intensity in CENPF-positive (G2) cells, relative to nuclei size (n = 2) (AVG > 75 cells/sample). Red lines indicate the median. (I) Same as for (H) but quantification of the total proportion of G2 cells positive for CDC45 (n = 2); mean value +/− SEM.
Figure 7
Figure 7
The mitotic replisome disassembly pathway is active in human somatic cells (A) MCM7 is present on condensed mitotic chromosomes following p97i treatment. Representative immunofluorescence images of chromatin-bound CENPF and MCM7 in G2 and mitotic U2OS cells from asynchronous population, treated ± p97i for 6 h. (B) MCM7 is present on condensed mitotic chromosomes following p97i treatment - representative immunofluorescence images of chromatin-bound pH3-S10 and MCM7 in mitotic U2OS cells from asynchronous population, treated ± p97i for 6 h with quantification of the percentage of pH3-S10-positive cells, which are positive for MCM7 (n = 3) (p = 0.0003, Two-tailed paired t test); mean value +/− SEM. (C) Effects of CULi in combination with WEE1i on cell cycle progression. Asynchronous HCT116 cells were treated for 6 h ± CULi and supplemented for the final hour ± WEE1i. Histogram displays quantification of the percentage of mitotic cells (pH3-S10-positive) (n = 3) (p = 0.0015, unpaired t test); mean value +/− SEM. (D) MCM7 accumulated on chromatin following CULi treatment is unloaded from chromatin in mitosis. Analysis of the percentage of cells retaining MCM7 in G2/M and mitosis following 6 h CULi treatment and 1 h WEE1i treatment, with FACS analysis. Shown are quantification of the cells, with G2/M DNA content, positive for MCM7 staining on chromatin (p = 0.0045, unpaired t test) and mitotic cells (pH3-S10 positive) positive for MCM7 staining on chromatin (ns) (n = 3 for all); mean value +/− SEM. (E) CDC45 accumulated on chromatin following CULi treatment is unloaded from chromatin in mitosis. Analysis of the percentage of cells retaining CDC45 in G2/M and mitosis. HCT116 cells were synchronized in G1 (24 h lovastatin) and released for 14 h with mevalonic acid. At this point, cells were treated with ±CULi for 2 h, followed by 1 h WEE1i treatment. Shown are quantification of the cells, with G2/M DNA content (AVG > 4175 cells/sample), positive for CDC45 staining on chromatin (p = 0.0083) and mitotic cells (AVG > 2100 cells/sample) positive for CDC45 staining on chromatin (ns, two-tailed Student’s t test) (n = 3 for all); mean value +/− SEM. (F) Same as for (E) but quantification of fold change in levels of average CDC45 intensity in G2 and mitotic cells (n = 3) (p = 0.002, two-tailed Student’s t test); mean value +/− SEM. (G) Effects of p97i in combination with WEE1i on cell cycle progression. Cells treated as in (C) but with p97i instead of CULi. Histogram displays quantification of the proportion of mitotic cells (pH3-S10-positive) (n = 3 for all) (-WEE1: p = 0.00709; +WEE1i: p = 0.00137, unpaired t test); mean value +/− SEM. (H) When p97i-treated cells are pushed into mitosis they still retain MCM7 on chromatin. Analysis of the percentage of cells retaining MCM7 in G2/M and mitosis following 6 h p97i treatment and 1 h of WEE1i treatment. Shown are quantification of the cells with G2/M DNA content positive for MCM7 (-WEE1i: p = 0.0043, unpaired t test) and mitotic cells (pH3-S10 positive) positive for MCM7 (+WEE1i: p = 0.0099) (n = 3 for all); mean value +/− SEM.

References

    1. Hanahan D., Weinberg R.A. Hallmarks of cancer: the next generation. Cell. 2011;144:646–674. doi: 10.1016/j.cell.2011.02.013. - DOI - PubMed
    1. Riera A., Barbon M., Noguchi Y., Reuter L.M., Schneider S., Speck C. From structure to mechanism-understanding initiation of DNA replication. Genes Dev. 2017;31:1073–1088. doi: 10.1101/gad.298232.117. - DOI - PMC - PubMed
    1. Maric M., Maculins T., De Piccoli G., Labib K. Cdc48 and a ubiquitin ligase drive disassembly of the CMG helicase at the end of DNA replication. Science. 2014;346 doi: 10.1126/science.1253596. - DOI - PMC - PubMed
    1. Moreno S.P., Bailey R., Campion N., Herron S., Gambus A. Polyubiquitylation drives replisome disassembly at the termination of DNA replication. Science. 2014;346:477–481. doi: 10.1126/science.1253585. - DOI - PubMed
    1. Deegan T.D., Mukherjee P.P., Fujisawa R., Polo Rivera C., Labib K. CMG helicase disassembly is controlled by replication fork DNA, replisome components and a ubiquitin threshold. Elife. 2020;9 doi: 10.7554/eLife.60371. - DOI - PMC - PubMed

LinkOut - more resources