. 2024 Jun 24;27(7):110372.
doi: 10.1016/j.isci.2024.110372. eCollection 2024 Jul 19.

Integrated physiological analyses, transcriptome, and DNA methylation reveal superiority of pear stigma-style complex development regulation

Affiliations

Integrated physiological analyses, transcriptome, and DNA methylation reveal superiority of pear stigma-style complex development regulation

Xu Huang et al. iScience. .

Abstract

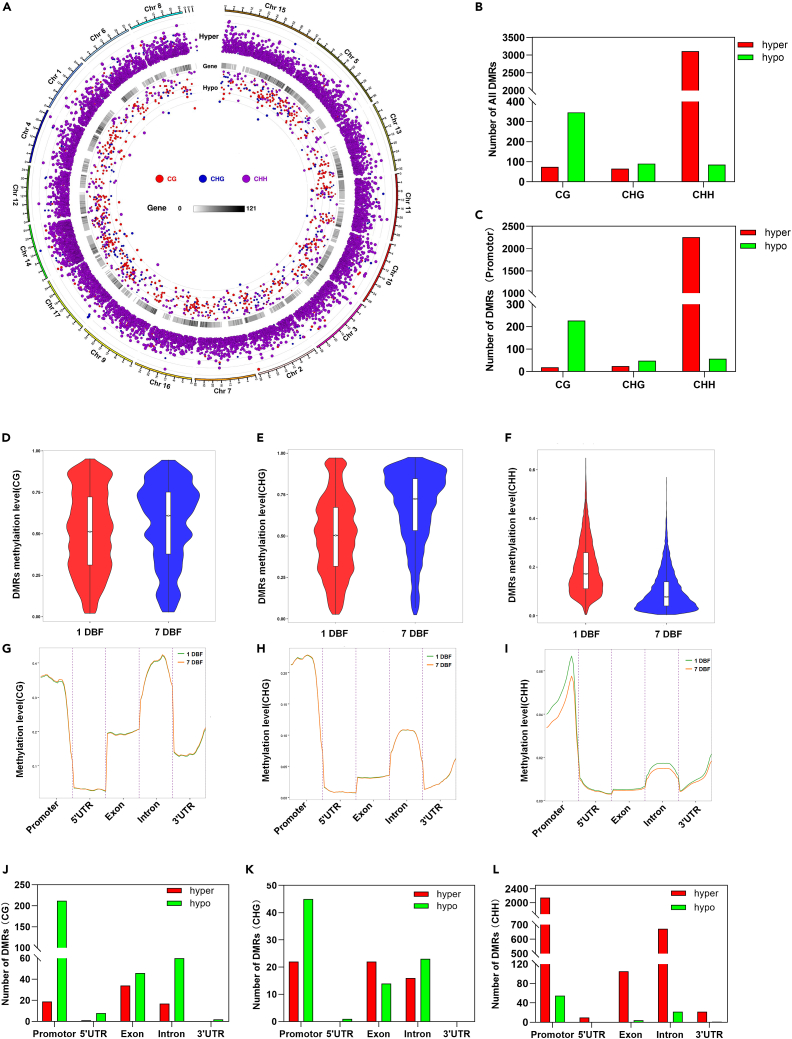
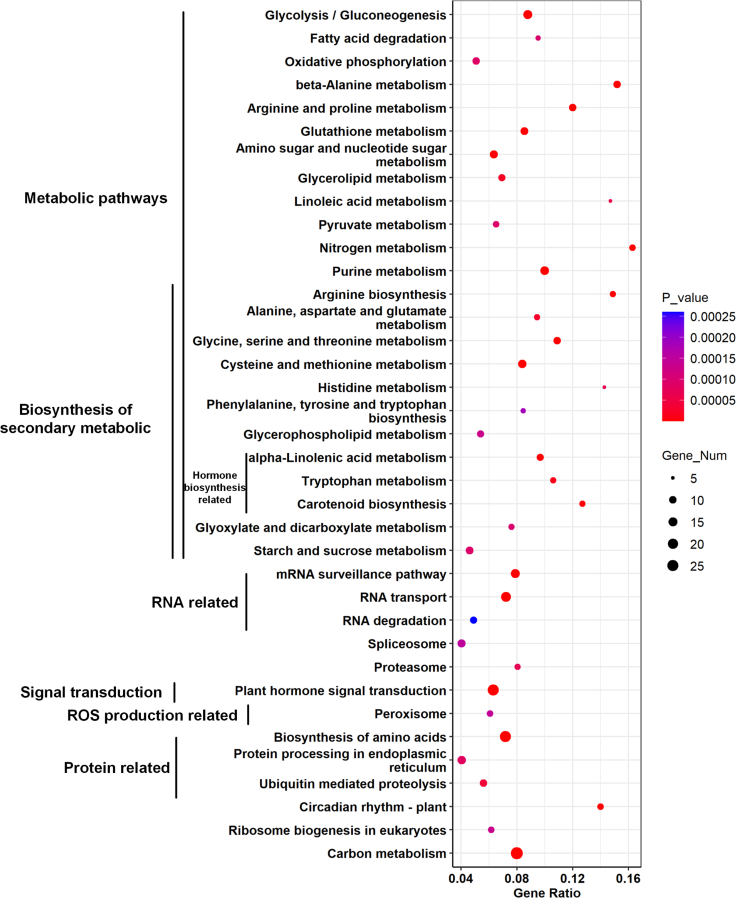
Styles and stigmas are crucial components of the fertilization process that allows a pear tree to bear fruit. The information regarding the development mechanism of pear style and stigma is still unclear. Our results demonstrated that IAA, ABA, and BR are significantly increased at 1 DBF, while JA is decreased at 5 DBF. The fructose and starch contents significantly increased at 1 DBF when the style with stigma was ready for pollination. Transcriptome and DNA methylation analysis showed 8087 DEGs and 3771 DMRs were enriched in plant hormones biosynthesis, carbohydrate biosynthesis and metabolism, and TFs in 1 DBF as compared with 7 DBF. The CHH methylation type of DMRs accounts for 84.75%. Most DMRs of CHH upregulated in 1 DBF vs. 7 DBF. This study found for the first time that transcription factor ERFs and DNA methylation are involved in regulating the growth and development of fruit plant style and stigma.

Keywords: Genomics; Plant development; Plant genetics; Plant physiology; Transcriptomics.


Conflict of interest statement

The authors declare that there is no conflict to interest.

Figures

None
Graphical abstract
Figure 1
Figure 1
Physiological analyses during styles growth (A–B) The image (A) and length of pear styles (B) in each growth period. Bar = 1 cm. (C–F) IAA (C), JA (D), ABA (E), BR (F) changes of pear styles in each growth period. (G–J) Sucrose (J), glucose (H), fructose (I) and starch (J) contents of pear styles in each growth period. DBF means day before flowing. Values are presented as means ± SE with three biological replicates. Different letters above bars indicate significant differences between values (p < 0.05). Same letters above bars indicate no significant differences between values.
Figure 2
Figure 2
Identification and expression analysis of the differentially expressed genes (DEGs) involved style growth regulation (A) Correlation analysis between the 1 DBF and 7 DBF styles samples with three biological replicates. (B) Volcano plot filtering identified genes differentially expressed in the 1 DBF and 7 DBF styles groups. (C) Scatterplot of the DEGs identified significantly enriched KEGG pathways.
Figure 3
Figure 3
Statistics of different methylation forms of differentially methylated region (DMRs) (A) Differences in genome-wide methylation levels in 1 DBF vs. 7 DBF styles. (B and C) Numbers of different types DMRs in 1 DBF vs. 7 DBF styles. (D–F) Average methylation levels of different types DMRs in 1 DBF and 7 DBF styles genome. (G–I) Distribution of DNA methylation level in different transcription elements of the genome. (J–L) Numbers of different types DMRs in gene element regions.
Figure 4
Figure 4
Scatterplot of the DMRs of promotor region identified significantly enriched KEGG pathways
Figure 5
Figure 5
Consistency and linear regression analysis of the transcriptome and the whole-genome bisulfite sequencing (WGBS) data by qRT-PCR (A–L) Verification of the consistency of RNA-seq data and WGBS data by qRT-PCR. (M) Linear regression analysis of the transcriptome data by qRT-PCR. (N) Linear regression analysis WGBS data by qRT-PCR. (O) Venn diagram of common genes between DEGs and DMRs in promotor region. Venn diagram were drawn by TBtools.
Figure 6
Figure 6
Regulatory model of DEGs and DMRs involved in pathways related to plant hormone biosynthesis, degradation, signaling and response IAA (A, H), ETH (B, I), BR (C, J), GA (D, K), and JA (E, L), CTK (F, M), ABA (G, N). Each small box represents a DEG or a DMR, the red ones indicate up-regulated DEGs/DMRs, and the green ones indicate downregulated DEGs/DMRs. The white ones indicate no DEGs/DMRs were identified.
Figure 7
Figure 7
Regulatory model of DEGs and DMRs involved in starch and sucrose metabolism pathways in pear styles growth regulation Each small box represents a DEG or a DMR, the red ones indicate upregulated DEGs/DMRs, and the green ones indicate downregulated DEGs/DMRs. The white ones indicate no DEGs/DMRs were identified.
Figure 8
Figure 8
Clustering analysis of the DEGs and DMRs related to transcription factors Each small box represents a DEG or a DMR, the red ones indicate up-regulated DEGs/DMRs, and the green ones indicate down-regulated DEGs/DMRs. The white ones indicate no DEGs/DMRs were identified.

References

    1. Renner S.S. The relative and absolute frequencies of angiosperm sexual systems: Dioecy, monoecy, gynodioecy, and an updated online database. Am. J. Bot. 2014;101:1588–1596. doi: 10.3732/ajb.1400196. - DOI - PubMed
    1. Li W.W., Huang X.R., Zou J., Wu J.J., Jiao H.W., Peng X.B., Sun M.X. Three stigma and style stylists pattern the fine architectures of apical gynoecium and are critical for male gametophyte-pistil interaction. Curr. Biol. 2020;30:4780–4788.e5. doi: 10.1016/j.cub.2020.09.006. - DOI - PubMed
    1. Gotelli M.M., Lattar E.C., Zini L.M., Galati B.G. Style morphology and pollen tube pathway. Plant Reprod. 2017;30:155–170. doi: 10.1007/s00497-017-0312-3. - DOI - PubMed
    1. Ding B.Q., Li J.J., Gurung V., Lin Q.S., Sun X.M., Yuan Y.W. The leaf polarity factors SGS3 and YABBYs regulate style elongation through auxin signaling in Mimulus lewisii. New Phytol. 2021;232:2191–2206. doi: 10.1111/nph.17702. - DOI - PubMed
    1. Stitz M., Hartl M., Baldwin I.T., Gaquerel E. Jasmonoyl-l-isoleucine coordinates metabolic networks required for anthesis and floral attractant emission in wild tobacco (Nicotiana attenuata) Plant Cell. 2014;26:3964–3983. doi: 10.1105/tpc.114.128165. - DOI - PMC - PubMed

LinkOut - more resources