. 2024 Jun 18;27(7):110299.
doi: 10.1016/j.isci.2024.110299. eCollection 2024 Jul 19.

Coexisting mechanisms of luminogenesis in pancreatic cancer-derived organoids

Affiliations

Coexisting mechanisms of luminogenesis in pancreatic cancer-derived organoids

Samuel J Randriamanantsoa et al. iScience. .

Abstract

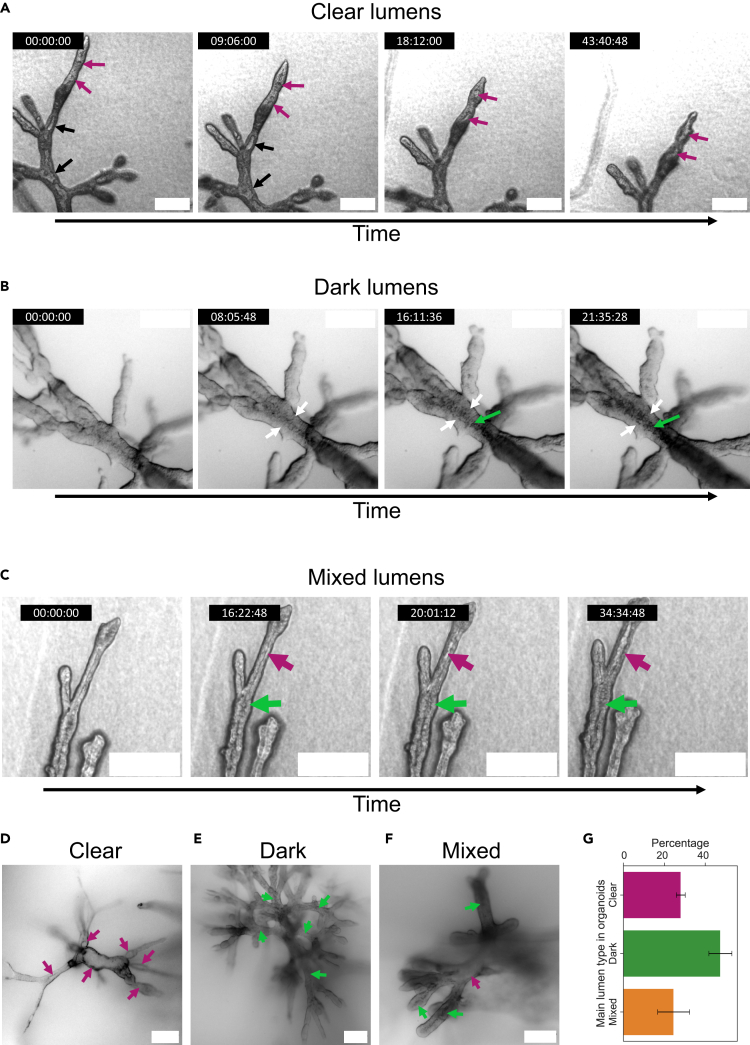
Lumens are crucial features of the tissue architecture in both the healthy exocrine pancreas, where ducts shuttle enzymes from the acini to the intestine, and in the precancerous lesions of the highly lethal pancreatic ductal adenocarcinoma (PDAC), similarly displaying lumens that can further develop into cyst-like structures. Branched pancreatic-cancer derived organoids capture key architectural features of both the healthy and diseased pancreas, including lumens. However, their transition from a solid mass of cells to a hollow tissue remains insufficiently explored. Here, we show that organoids display two orthogonal but complementary lumen formation mechanisms: one relying on fluid intake for multiple microlumen nucleation, swelling and fusion, and the other involving the death of a central cell population, thereby hollowing out cavities. These results shed further light on the processes of luminogenesis, deepening our understanding of the early formation of PDAC precancerous lesions, including cystic neoplasia.

Keywords: Biological sciences; Cancer; Cell biology; Morphogenesis; Organoids.


Conflict of interest statement

The authors declare no competing interests.

Figures

None
Graphical abstract
Figure 1
Figure 1
Organoids form “clear” and “dark” cavities (A) Close-up view of branches displaying the formation of so-called “clear” lumens, cavities highly translucent in bright field microscopy. Black arrows indicate cavities that had already nucleated and swollen before observation started, while magenta arrows indicate cavities newly nucleated. (B) Close-up view of branches displaying the formation of so-called “dark” lumens, cavities poorly translucent in bright field microscopy. White arrows indicate the epithelial-like wall surrounding the lumen, while green arrows indicate the core of the branch, progressively becoming darker and eventually giving rise to a cavity. (C) Clear (magenta arrow) and dark lumen (green arrow) coexisting next to each other within a branch. (D) Entire organoid with predominantly clear lumens. (E) Entire organoid with predominantly dark lumens. (F) Entire organoid with both clear and dark lumens (resp. magenta and green arrows). (G) Average percentage of organoids with predominantly clear (N = 16/57), dark (N = 27/57), and mixed lumens (N = 14/57 organoids). Error bars indicate the standard error of the weighted mean. Scale bars: 200 μm.
Figure 2
Figure 2
Fluid intake and fluid transfer contribute to clear lumen formation (A) Phalloidin staining of high-branched and low-branched organoids with “clear” microlumens. Summed slice projection shows F-actin lining the microlumens as indicated by the blue arrows. (B) Organoid displaying an extreme cavity swelling behavior during the lumen formation phase. Evolution of lumens’ cross-sectional area over time in (C) “Nuc” (n = 14 lumens, N = 5 organoids), (C’) “Swe” (n = 11 lumens, N = 4 organoids), (C”) blowing up (n = 8 lumens, N = 3 organoids) cases, and estimated rates of swelling shown in boxplots (C”’). Boxplots indicate the interquartile range (IQR, rectangle), the median (line), and 1.5 times the IQR (whiskers). Tracks with fusion events between neighboring cavities are excluded from the computation of the swelling rates. (D) Time-lapse showing that treatment with 0.4 mM ouabain at the Thickening stage, prior to lumen apparition, can prevent further lumen formation. The red arrow indicates the place where a lumen would normally have been expected to form in untreated conditions after more than 40 h. Drug is added at time point 00:00:00, on a Day 11 organoid. Lumen formation post-treatment is quantified in E and F. (E) considers organoids both with and without already formed cavities pre-treatment (0 mM, N = 18; 0.4 mM, N = 16; 0.5 mM, N = 16 organoids), whereas (F) considers only organoids that did not display any lumen before treatment (0 mM, N = 8; 0.4 mM, N = 9; 0.5 mM, N = 8 organoids). Error bars in E and F indicate the standard error of the weighted mean. (G) Confocal slices showing Dextran Alexa 488 incorporated at the cell-cell junctions in a monolayer, at the branch surface, and inside the lumen. Dextran in the lumen was detectable 315 min after the addition. (H) Time-lapse showing the propagation of fluid along a fault line in a branch, in a process reminiscent of hydraulic fracturing. As it propagates, the fluid creates transient microlumens that grow then deflate. The white arrow indicates the position of the fluid’s source, the yellow indicates the position of the currently growing microlumen, and the red indicates the position of a deflating microlumen. (I) Time-lapse showing the propagation of a fracture (yellow arrow), along the branch longitudinal axis due to fluid intake. Note that the minimum intensity z-projection causes the inside of the lumen to appear darker than it is in reality. Scale bars: A (whole organoid), B, H, and I 200 μm; D 500 μm; A (close-up), G 50 μm. Fluorescence images in A,B,E: confocal summed projections; in F: confocal slices. Bright field images in A, D, G, and H: plane; in B and I: minimum projection. See also Figures S1 and S3.
Figure 3
Figure 3
Apoptosis contributes to dark lumen formation via cavitation, and to cell elimination in the apical and basal directions (A) Summed slice projection time-lapse of an organoid labeled with NucView caspase-3 enzyme substrate showing apoptotic events (in green) leading to the formation of dark lumens in the core and in the branches. (B) Cumulated caspase events detected in whole organoids during dark lumen formation (N = 6 organoids), and corresponding apoptosis rate. (C) Boxplot indicates the interquartile range (IQR, rectangle), the median (line), and 1.5 times the IQR (whiskers). (D) Time-lapse of a cell elimination event, from the epithelium to the apical side, post-lumen formation, visible through caspase 3/7 activity (green) and strong increase in the actin signal (magenta, labeled with SiR-actin). Orange arrows indicate cells being eliminated displaying an increased actin signal but no caspase signal yet, while cyan arrows indicate the presence of both an increased actin signal and of caspase activity. (E) Time-lapse of a cell elimination event, from the epithelium to the basal side, post-lumen formation, visible through caspase 3/7 activity (green) and strong increase in the actin signal (magenta, labeled with SiR-actin). The white arrow tracks the same cell over time. Scale bars: A: 500 μm; D and E: 100 μm. Fluorescent images in A, D, and E are confocal summed projections. See also Figures S1–S3.
Figure 4
Figure 4
Organoids undergo progressive epithelialization and polarization along the central (fault) line (A) From left to right: F-actin organization in a Phalloidin Alexa 633-stained organoid, closeup, longitudinal actin intensity profile along the cyan line, transversal actin intensity profile along the orange line. Top: organoid pre-Thickening. Bottom: organoid post-Thickening. (B) From left to right: Distribution fluorescent signal in organoids, overexpressing GFP-tagged non-muscle myosin IIa, pre-, during, and post-lumen opening. White arrow indicates the central line of the branch along which the lumen nucleate. (C) Time-lapse of E-cadherin distribution in an endogeneously labelled organoid during the Thickening phase, showing a global increase. The corresponding kymograph taken along the orange line is shown in (D). (E) Top to bottom: Evolution of the E-cadherin and PKC-ζ distribution pre-, during, and post-lumen opening. The white arrow indicates a cell where the apical side still expresses both E-cadherin and PKC-ζ, while the red arrow indicates a cell where the apical side is polarized with PKC-ζ but has lost its E-cadherin signal. Microscopy images shown are all confocal slices except for C which shows summed projections. (F) Average percentage of lumen formation in organoids treated at the thickening-to-lumen formation phase with calyculin, blebbistatin, ML7, or untreated (resp. N = 8, 14, 19, 39 organoids) at various concentrations. Both organoids with and without large cavities prior to drug addition are quantified in F. A similar analysis restricted to organoids that did not display large lumens before drug addition is shown in G (with resp. N = 7, 10, 13, 26 organoids). Further concentrations are explored in Figure S4. Error bars indicate the standard error of the weighted mean in F,G. Drug is added at time point 00:00:00 in H–J. (H) Calyculin treatment—shown here at 1 nM—on a phenotype still in extension at drug addition time, stops the branch extension and trigger the formation of bud-like structures as the increased contractility leads to a rupture between tip cells that remain attached to collagen fibers in front of them and cells at the back (red arrow) that retract along the path previously digested in collagen (black arrow). The cyan arrowhead indicates a lumen forming post treatment. (I) Blebbistatin treatment—shown here at 150 μM—can trigger the fragmentation of branches in thin-branched phenotypes, with individual cells rounding up. Red arrows indicate intact branches, black arrows indicate broken branches. (J) ML7 treatment—shown here at 50 μM—can trigger a rapid filling of clear lumens, with dark cells, as indicated by the cyan arrowhead. Scale bars: A and B 50 μm; C, E, I, and J 100 μm; H 200 μm. See also Figures S3 and S4.
Figure 5
Figure 5
Mucin distribution (A) Staining of DAPI, Mucin (MUC1) and F-actin in an organoid pre-lumen formation, along a forming fault line. Top: summed slice z-projection. Bottom: z-slice. (B) Staining of DAPI, MUC1, and F-actin in an organoid with an established lumen. Top: summed slice z-projection. Bottom: z-slice. (C) Stainings of DAPI, MUC1, and PKC-ζ in organoids, from top to bottom: pre-fault line apparition, after fault line formation but pre-lumen formation, during lumen formation, and after lumen-formation, indicating the progressive apical polarization. (D) Staining of MUC1 and PKC-ζ indicating the restriction of strong MUC1 expression to the core region of an organoid where the lumen has formed. (E) Staining of DAPI, MUC1, and PKC-ζ in a cyst-like organoid, showing strong apical polarization and mucin expression. Scale bars: A and B 100 μm, C 50 μm, D and E 200 μm. Fluorescent images are all confocal-acquired and either slices, summed projections (SUM) or maximum intensity projections (MAX).

References

    1. Adamska A., Domenichini A., Falasca M. Pancreatic Ductal Adenocarcinoma: Current and Evolving Therapies. Int. J. Mol. Sci. 2017;18:1338. doi: 10.3390/ijms18071338. - DOI - PMC - PubMed
    1. Moreira L., Bakir B., Chatterji P., Dantes Z., Reichert M., Rustgi A.K. Pancreas 3D Organoids: Current and Future Aspects as a Research Platform for Personalized Medicine in Pancreatic Cancer. Cell. Mol. Gastroenterol. Hepatol. 2018;5:289–298. doi: 10.1016/j.jcmgh.2017.12.004. - DOI - PMC - PubMed
    1. Hruban R.H., Takaori K., Klimstra D.S., Adsay N.V., Albores-Saavedra J., Biankin A.V., Biankin S.A., Compton C., Fukushima N., Furukawa T., et al. An illustrated consensus on the classification of pancreatic intraepithelial neoplasia and intraductal papillary mucinous neoplasms. Am. J. Surg. Pathol. 2004;28:977–987. doi: 10.1097/01.pas.0000126675.59108.80. - DOI - PubMed
    1. Yonezawa S., Higashi M., Yamada N., Goto M. Precursor Lesions of Pancreatic Cancer. Gut Liver. 2008;2:137–154. doi: 10.5009/gnl.2008.2.3.137. - DOI - PMC - PubMed
    1. Distler M., Aust D., Weitz J., Pilarsky C., Grützmann R. Precursor lesions for sporadic pancreatic cancer: PanIN, IPMN, and MCN. BioMed Res. Int. 2014;2014 doi: 10.1155/2014/474905. - DOI - PMC - PubMed

LinkOut - more resources