. 2024 Jun 21;27(7):110342.
doi: 10.1016/j.isci.2024.110342. eCollection 2024 Jul 19.

Altered neuronal lactate dehydrogenase A expression affects cognition in a sex- and age-dependent manner

Affiliations

Altered neuronal lactate dehydrogenase A expression affects cognition in a sex- and age-dependent manner

Ariel K Frame et al. iScience. .

Abstract

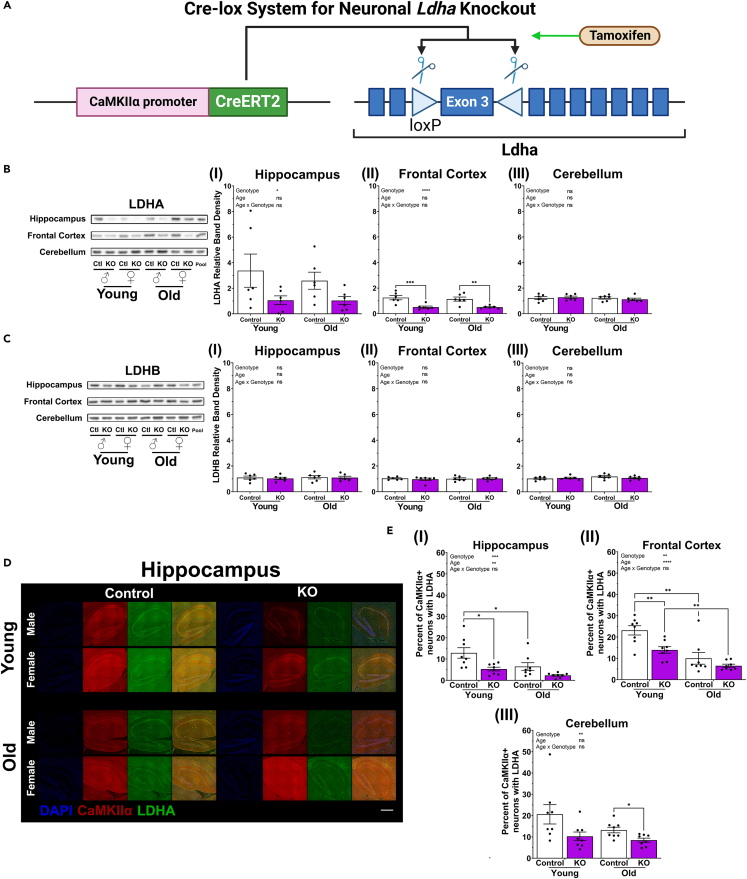
The astrocyte-neuron lactate shuttle (ANLS) model posits that astrocyte-generated lactate is transported to neurons to fuel memory processes. However, neurons express high levels of lactate dehydrogenase A (LDHA), the rate-limiting enzyme of lactate production, suggesting a cognitive role for neuronally generated lactate. It was hypothesized that lactate metabolism in neurons is critical for learning and memory. Here transgenic mice were generated to conditionally induce or knockout (KO) the Ldha gene in CNS neurons of adult mice. High pattern separation memory was enhanced by neuronal Ldha induction in young females, and by neuronal Ldha KO in aged females. In older mice, Ldha induction caused cognitive deficits whereas Ldha KO caused cognitive improvements. Genotype-associated cognitive changes were often only observed in one sex or oppositely in males and females. Thus, neuronal-generated lactate has sex-specific cognitive effects, is largely indispensable at young age, and may be detrimental to learning and memory with aging.

Keywords: Behavioral neuroscience; Cellular neuroscience; Molecular neuroscience; Neuroscience; Sensory neuroscience.


Conflict of interest statement

The authors declare no competing interests.

Figures

None
Graphical abstract
Figure 1
Figure 1
Neuronal Ldha induction transgenic mice express HA-tagged LDHA in the brain (A) Schematic outlining Tet-Off system used to induce expression of Ldha in neurons. Neuronal Ldha induction mice contain both the genetic constructs encoding the tetracycline-controlled transactivator (tTA) and the tetracycline-responsive promoter element (TRE). Control mice lack either one or both constructs. The tTA induces expression of Ldha downstream of TRE following removal of doxycycline from the diet. (B) Western blot analysis demonstrating HA-tagged LDHA expression in the hippocampus (I) and frontal cortex (II), but not cerebellum (II), of neuronal Ldha induction mice at young (7 months) and old (18 months) age. HA-tagged LDHA increased with age in neuronal Ldha induction mice (I; genotype × age effect: F(1, 20) = 13.54, p = 0.0015). n = 6. Comparisons made by two-way ANOVA, fixed effects presented in each graph, with Šídák multiple comparisons between genotype for each age or, if there was an effect including age, Holm-Šídák multiple comparisons between genotype for each age and between age for each genotype. See also Figure S1. (C) Representative immunofluorescence images revealed increased levels of HA-tagged LDHA in the hippocampus of neuronal Ldha induction mice at young (7 months) and old (18.5 months) age compared with age-matched control. Scale bar: 500 μm. See also Figures S2 and S5. (D) Magnified view of immunofluorescence image from hippocampal Cornu Ammonis 2 (CA2) region of 18.5 month old female neuronal Ldha induction mouse revealing neuronal localization of HA-tagged LDHA. Scale bar: 50 μm. (E and F) Quantification of immunofluorescence staining showing the region-dependent increased percentage of MAP2 and HA-tagged LDHA positive neurons in neuronal Ldha induction mice compared to control mice. Increases were detected in hippocampus (HPC), frontal cortex (CTX), and cerebellum (CBM) at young age (E; brain region effect: F(1.816, 21.80) = 17.26, p < 0.0001; genotype effect: F(1, 12) = 63.20, p < 0.0001; brain region × genotype effect: F(2, 24) = 23.75, p < 0.0001) and old age (F; brain region effect: F(1.167, 16.34) = 28.98, p < 0.0001; genotype effect: F(1, 14) = 40.28, p < 0.0001; brain region × genotype effect: F(2, 28) = 29.47, p < 0.0001). n = 8. See also Figures S2–S7. Comparisons made using a mixed-effects model with Geisser-Greenhouse correction, fixed effects presented in each graph, and Holm-Šídák multiple comparisons between genotypes for each brain region and between each brain region for transgenic. Data presented as mean ± SEM.
Figure 2
Figure 2
Neuronal Ldha knockout mice exhibit reduced LDHA in the brain (A) Schematic outlining Cre-lox system used for knocking out Ldha in neurons. Neuronal Ldha KO mice contain both a genetic construct encoding the tamoxifen-dependent cyclization recombination (Cre) recombinase and mutant human estrogen receptor ligand-binding domain chimera (CreERT2) and two locus of crossing-over of bacteriophage P1 (loxP) recognition sites flanking exon 3 of the Ldha gene. Control mice lack CreERT2. CreERT2 permits the excision of exon 3 of Ldha in the presence of tamoxifen. (B) Western blot analysis demonstrating LDHA protein levels are reduced in the hippocampus (I; genotype effect: F(1, 20) = 6.353, p = 0.0203) and frontal cortex (II; genotype effect: F(1, 20) = 30.24, p < 0.0001), but not cerebellum (II), of neuronal Ldha KO mice at young (6 months) and old (18 months) age. n = 6. See also Figure S8. (C) Western blot analysis demonstrating LDHB protein levels are not reduced in hippocampus (I), frontal cortex (I), or cerebellum (II) of neuronal Ldha KO mice at young (6 months) and old (18 months) age. n = 6. Comparisons made by two-way ANOVA, fixed effects presented in each graph, with Šídák multiple comparisons between genotype for each age or, if there was an effect including age, Holm-Šídák multiple comparisons between genotype for each age and between age for each genotype. See also Figure S8. (D) Representative immunofluorescence images showing reduced LDHA in the hippocampus of neuronal Ldha KO mice at young (8 months) and old (18.5 months) age compared with age-matched control. Scale bar: 500 μm. See also Figure S9. (E) Quantification of immunofluorescence staining showing a decrease in CaMKIIα positive neurons containing LDHA in neuronal Ldha KO mice compared to control mice in the hippocampus (I; genotype effect: F(1, 28) = 13.52, p = 0.0010), frontal cortex (II; genotype effect: F(1, 28) = 10.56, p = 0.0030), and cerebellum (III; genotype effect: F(1, 28) = 9.508, p = 0.0046) at young (8 months) and old (18.5 months) of age. The percent of CaMKIIα and LDHA positive neurons decreased with age in the hippocampus (age effect: F(1, 28) = 8.532, p = 0.0068) and frontal cortex (age effect: F(1, 28) = 27.76, p < 0.0001) in neuronal Ldha KO and control mice. n = 8. See also Figures S9–S11. Comparisons made using a three-way ANOVA, fixed effects presented in each graph, and Holm-Šídák multiple comparisons between genotype within each age and between ages for each genotype. Data presented as mean ± SEM.
Figure 3
Figure 3
Hippocampal lactate levels are elevated in neuronal Ldha induction mice (A) In vivo1H-MRS analysis revealed elevated hippocampal lactate levels in young (8 months) neuronal Ldha induction female mice compared to age-matched control mice (I; n = 8; t(14) = 2.611, p = 0.0205) whereas no genotype effects on lactate levels were detected in old (15 months) mice (II; n = 8). (B) In vivo1H-MRS analysis of lactate levels revealed similar hippocampal lactate levels when comparing neuronal Ldha KO to age-matched control mice at both young age (I; n = 7; 9.5 months) and old age (15 months). Comparisons for 1H-MRS analysis were made using unpaired t test if only one sex measured and using two-way ANOVA, fixed effects presented in each graph, with unpaired t test between genotypes. (C) GC-MS analysis revealed elevated hippocampal lactate levels in neuronal Ldha induction mice across both young and old (genotype effect: F(1, 37) = 5.628, p = 0.0230) compared to young and old control. (D) GC-MS analysis revealed in neuronal Ldha KO mice only elevation of hippocampal lactate with age across both genotypes (age effect: F(1, 37) = 18.61, p = 0.0001; control: t(18) = 3.139, p = 0.022521; KO: t(19) = 2.963, p = 0.023766) with no difference between genotypes. Comparisons for GC-MS analysis were made using two-way ANOVA, fixed effects presented in each graph, with Holm-Šídák multiple comparisons. p values for partial correlation analysis were Bonferonni corrected. (E and F) Heatmaps depicting relative abundance of the 25 metabolites with the top variable importance in projection (VIP) scores identified by partial least squares-discriminant analysis (PLSDA) of metabolomes generated by GC-MS analysis of the hippocampus in neuronal Ldha induction and age-matched control mice (E) or neuronal Ldha KO and age-matched control mice (F). Metabolites that could not be identified in the NIST database are listed as a number based on their mean retention time. See also Figures S12 and S13. Data presented as mean ± SEM.
Figure 4
Figure 4
Locomotor ability is not impacted by neuronal Ldha induction or knockout (A) In the rotarod paradigm mouse locomotor ability was determined by assessing familiarization to a spinning rod on day 1, followed by learning to remain on a spinning rod as it progressively accelerates across each of five consecutive trials on day 2 and with maximum performance assessed on day 2 trial 6. (B) Locomotor ability on the rotarod for 14.5 month old neuronal Ldha induction and age-matched control mice for either sex did not differ on day 1 (I) or day 2 (II). Transgenic mice did not differ from age-matched control mice for day 1 number of falls (I), day 2 latency to fall (II) or day 2 at maximum ability (II). n = 5–9. (C) Locomotor ability on rotarod for 14.5 month old Ldha KO and age-matched controls on day 1 familiarization to the rod differed by sex and genotype (I; n = 8–12; sex effect: F(1, 39) = 11.56, p = 0.0016; genotype effect: F(1, 39) = 4.432, p = 0.0418) and on day 2 differed by sex (II; n = 9–12; sex effect trial 1–5: F(1, 40) = 10.61, p = 0.0023; sex effect trial 6: F(1, 40) = 4.988, p = 0.0312). KO and control mice did not differ on day 2 (II). Comparisons of rotarod performance on day 1 and day 2 trial 6 were made using a two-way ANOVA across sex and genotype, fixed effects presented in each graph, and unpaired t test between genotypes. Comparisons for rotarod day 2 trial 1–5 were made using a mixed-effects model with Geisser-Greenhouse correction, fixed effects presented in each graph, and Šídák’s multiple comparisons test between genotype for each trial, within each sex if there was an effect of sex. (D) Locomotor activity assessed by measuring average swimming speed during training day trials and probe trials in the Morris water maze as depicted in Figure 7A. (E) Locomotor ability on training days was retained equally in 6 month old neuronal Ldha induction and age-matched control mice for both sexes. n = 9–12. (F) Locomotor ability in young aged (6 months) was retained equally in neuronal Ldha induction compared to age-matched control mice of both sexes for mean swimming speed in the 24 h probe trial. n = 9–12. (G) Locomotor ability on training days was retained equally in old aged (12.5 months) neuronal Ldha induction and control mice for both sexes. n = 8–13. (H) Locomotor ability in old aged (12.5 months) neuronal Ldha induction and age-matched control mice of both sexes was retained equally in the 24 h probe trial. n = 8–13. (I) Locomotor ability on training days in young aged (7 months) neuronal Ldha KO compared to age-matched control mice was retained equally. n = 12–13. (J) Locomotor ability in young aged (7 months) neuronal Ldha KO compared to age-matched control mice was retained equally in the 24 h probe trial. n = 12–13. (K) Locomotor ability on training days in young aged (13 months) neuronal Ldha KO and age-matched control mice of both sexes were retained equally. n = 9–12. (L) Locomotor ability in old aged (13 months) neuronal Ldha KO and age-matched control mice of both sexes were retained equally in the 24 h probe trial. n = 9–12. For training days mean speed swimming, comparisons were made using a mixed-effects model with Geisser-Greenhouse correction, fixed effects presented in each graph, and further comparisons between genotype for each day were made using unpaired t tests for conditions with an effect including genotype. For probe trials, comparisons were made using a two-way ANOVA, fixed effects presented in each graph, and further comparisons between genotype made using unpaired t tests, within each sex for conditions with an effect including sex for training days or probe trials. Data presented as mean ± SEM.
Figure 5
Figure 5
Thigmotaxis and light-dark box anxiety-like behavior are differentially impacted by neuronal Ldha induction or knockout depending on age and sex (A) Thigmotaxis is a type of anxiety-like behavior that was measured as time spent in outer zone during the first day of habituation to the circular arena during the spontaneous location recognition paradigm (Figure 6F). (B) Thigmotaxis anxiety-like behavior in neuronal Ldha induction mice compared to age-matched control mice was unchanged at young age (5 months) and higher at old age (12 months) for males (t(43) = 2.819, p = 0.0144; sex × genotype effect: F(1, 43) = 5.943, p = 0.0190) but not females. n = 8–15. (C) Thigmotaxis anxiety-like behavior in neuronal Ldha KO mice compared to age-matched control mice was lower at young age (6 months; t(43) = 2.641, p = 0.0115; genotype effect: F(1, 41) = 6.746, p = 0.013) and unchanged at old age (12.5 months). N = 20–24. For thigmotaxis, comparisons made by two-way ANOVA within each age group, fixed effects presented in each graph, with Šídák’s multiple comparisons between genotypes. (D) Anxiety-like behavior was assessed in the light-dark box as time spent on dark side and latency to enter dark side. (E) Light-dark box anxiety-like behavior of young age (6.5 months) neuronal Ldha induction mice and age-matched control differed by sex for latency to enter dark side (I; F(1, 33) = 5.601, p = 0.024), and time on dark side (II; F(1, 34) = 13.31, p = 0.0009). Transgenic males had decreased anxiety-like behavior for time on dark side (II; sex × genotype effect: F(1, 34) = 11.10, p = 0.0021; t(34) = 4.186, p = 0.0004). n = 5–13. (F) Light-dark box anxiety-like behavior of young aged (7 months) neuronal Ldha KO mice and age-matched control differed by sex for time on dark side (II; F(1, 41) = 5.180, p = 0.0281). KO males had increased anxiety-like behavior for time on dark side (II; sex × genotype effect: F(1, 41) = 6.612, p = 0.0139; t(41) = 2.47, p = 0.0352). n = 8–12. Comparisons for light-dark box made using two-way ANOVA, fixed effects presented in each graph, and Šídák’s multiple comparisons between genotype for each sex. Data presented as mean ± SEM.
Figure 6
Figure 6
Short-term spatial memory with high pattern separation is increased by neuronal Ldha induction in young and by neuronal Ldha knockout in old female mice whereas long-term recognition memory is unaffected by neuronal Ldha modification at both ages (A) Spontaneous Object Recognition (SOR) paradigm for testing recognition memory with a 24 h delay between sample and choice phase. See also Figure S14A. (B and C) 24 h recognition memory in SOR was retained in both neuronal Ldha induction and age-matched control mice at young (B; 4.5 months; n = 18–44; phase effect: F(1, 120) = 86.24, p < 0.0001) and old (C; 11 months; n = 20–27; phase effect: F(1, 45) = 27.96, p < 0.0001) age. (D and E) 24 h recognition memory in SOR was retained in both neuronal Ldha KO and age-matched control mice at young (D; 5.5 months; n = 18–23; phase effect: F(1, 78) = 13.32, p = 0.0005) and old (E; 11 months; n = 21–24; phase effect: F(1, 43) = 18.90, p < 0.0001) age. (F) Spontaneous Location Recognition (SLR) paradigm for testing spatial memory with low (dSLR) or high (sSLR) pattern separation with a 4 or 6 h delay between sample and choice phase. See also Figure S14B. (G) 6 h spatial memory in dSLR was retained at young age (5 months) in both neuronal Ldha induction and age-matched control mice (n = 20–28; phase effect: F(1, 46) = 2.62, p = 0.0009). (H) 6 h spatial memory in sSLR at differed with sex (F(1, 44) = 4.902, p = 0.0321) in young aged (5 months) neuronal Ldha induction and age-matched control mice. Memory was retained in male Ldha induction and control mice (n = 8–15; phase effect: F(1, 21) = 15.37, p = 0.0008) but was enhanced in Ldha induction female (t(11) = 3.181, p = 0.0087) mice compared to controls (t(12) = 1.361, p = 0.1985) (n = 12–13; genotype effect: F(1, 23) = 5.829, p = 0.0241). (I) 4 h spatial memory in dSLR was retained at old age (12 months) in both neuronal Ldha induction and age-matched control mice (n = 20–27; phase effect: F(1, 43) = 24.38, p < 0.0001). (J) 4 h spatial memory in sSLR was lost at old age (12 months) in both neuronal Ldha induction and age-matched control mice (n = 20–27; phase effect: F(1, 45) = 1.477, p = 0.2305). (K) 4 h spatial memory in dSLR was retained at young age (6 months) in both neuronal Ldha KO and age-matched control mice (n = 21–24; phase effect: F(1, 43) = 5.679, p = 0.0217). (L) 4 h spatial memory in sSLR was retained at young age (6 months) in both neuronal Ldha KO and age-matched control mice (n = 21–24; phase effect: F(1, 43) = 10.58, p = 0.0022). (M) 4 h spatial memory in dSLR was retained at old age (12.5 months) in both neuronal Ldha KO and age-matched control mice (n = 21–24; phase effect: F(1, 84) = 6.953, p = 0.01). (N) 4 h spatial memory in sSLR at old age (12.5 months) differed with sex (F(1, 80) = 7.209, p = 0.0088) in neuronal Ldha KO and age-matched control mice. Memory in KO and control was lost in males (n = 11–12; phase effect: F(1, 42) = 0.04346, p = 0.8359) but differed in females (n = 9–12; phase × genotype effect: F(1, 38) = 4.718, p = 0.0362), with memory enhanced in KO (t(8) = 3.394, p = 0.0094) and lost in control mice (t(11) = 0.5775, p = 0.5752). Comparisons across all conditions in SOR and SLR were made using a mixed-effects model with matching by phase and fixed effects presented in each graph. For comparisons with a fixed effect of genotype or phase × genotype, further comparisons between phase for each genotype were made using paired t tests with the p value reported above each comparison. Bars in each graph represent the mean.
Figure 7
Figure 7
Spatial learning and long-term memory are both differentially impacted by neuronal Ldha induction and knockout depending on age and sex (A) Morris water maze paradigm for testing spatial learning during training days and long-term spatial memory at 24 h and 7 days probe trials. (B) Spatial learning in young (6 months) neuronal Ldha induction was retained equally in transgenic and age-matched control mice for both sexes. n = 9–12. (C) Spatial learning in old (12.5 months) neuronal Ldha induction compared with age-matched control mice was worse in males only (genotype effect: F(1, 19) = 5.939, p = 0.0248). n = 8–13. (D) Spatial learning in young (7 months) neuronal Ldha KO compared with age-matched control mice was retained equally for both sexes. N = 5–7. (E) Spatial learning in old (13 months) neuronal Ldha KO compared with age-matched control mice was improved in females only (genotype effect: F(1, 19) = 5.850, p = 0.0258). n = 9–12. (F) 24 h long-term spatial memory in young (6 months) neuronal Ldha induction compared to age-matched control mice was decreased in females for percent time in target quadrant (I; sex × genotype effect: F(1, 38) = 7.430, p = 0.0096; t(21) = 2.125, p = 0.0457) and increased in males for mean distance from platform (II; sex × genotype effect: F(1, 38) = 7.424, p = 0.0097; t(17) = 2.594, p = 0.0189). n = 9–12. (G) 24 h long-term spatial memory in old (12.5 months) neuronal Ldha induction compared to age-matched control was retained equally for percent time in target quadrant and mean distance from platform (I + II) for both sexes. n = 8–13. (H) 7 days long-term spatial memory in young (6 months) neuronal Ldha induction compared with age-matched control mice was retained equally for percent time in target quadrant (I) and decreased in females only for mean distance from platform (II; sex × genotype effect: F(1, 38) = 4.459; t(21) = 2.084, p = 0.0496). n = 9–12. (I) 7 days long-term spatial memory in old (12.5 months) neuronal Ldha induction compared with age-matched control mice was retained equally for percent time in target quadrant and mean distance from platform (I + II) for both sexes. n = 8–13. (J) 24 h long-term spatial memory in young (7 months) neuronal Ldha KO compared to age-matched control mice is retained equally for percent time in target quadrant and mean distance from platform (I + II) for both sexes. n = 6–7. (K) 24 h long-term spatial memory in old (13 months) was retained equally for percent time in target quadrant and mean distance from platform (I + II) for both sexes. n = 9–12. (L) 7 days long-term spatial memory in young (7 months) neuronal Ldha KO compared to age-matched control was decreased in males only for percent time in target quadrant (I; t(11) = 3.069, p = 0.0107) and mean distance from platform (II; t(11) = 3.076, p = 0.0106). n = 6–7. (M) 7 days long-term spatial memory in old (13 months) was retained equally for percent time in target quadrant and mean distance from platform (I + II) for both sexes. n = 9–12. For training days, comparisons were made using a mixed-effects model with Geisser-Greenhouse correction, fixed effects presented in each graph, and further comparisons between genotype for each day were made using unpaired t tests for conditions with an effect including genotype. For probe trials, comparisons were made using a two-way ANOVA, fixed effects presented in each graph, and further comparisons between genotype for each sex were made using unpaired t tests for conditions with an effect including sex for memory, learning, or locomotor ability (Figure 4). Data presented as mean ± SEM.
Figure 8
Figure 8
Cognitive behavior in puzzle box is differentially impacted by neuronal Ldha induction and knockout depending on age and sex (A) In the puzzle box mice must pass from the light to dark side of a light-dark box with various barriers of increasing difficulty put in place during nine trials that were spread across three successive days with three trials per day. For each trial, higher latency to enter the dark side is indicative of worse performance. Habituation is exhibited during the first trial that has no barrier. Problem solving ability is exhibited during trials 2, 5, and 8 when the task difficulty is increased from the previous one on the same day. 3 min memory is exhibited during trials 3, 6, and 9 when the task is of equal difficulty to the previous one on the same day. 24 h memory is exhibited during trials 4 and 7 when the task is of equal difficulty to the previous one on the day prior. See also Figure S15. (B) Problem solving ability was retained equally in young (7 months) neuronal Ldha induction compared to age-matched control mice. n = 13–25. (C) 3 min memory was retained equally in young (7 months) neuronal Ldha induction compared to age-matched control mice. n = 14–24. (D) 24 h memory in young (7 months) neuronal Ldha induction and age-matched control mice differed by sex (sex × genotype effect: F(1, 33) = 4.003, p = 0.0537; trial × sex × genotype effect: F(1, 32) = 5.143, p = 0.0302). 24 h memory in induction compared with control mice was retained equally in males, worse in females across both trial 4 and 7 (genotype effect: F(1, 18) = 10.18, p = 0.0051; trial × genotype effect: F(1, 17) = 4.713, p = 0.0444), and worse in females particularly for higher difficulty trial 7 (t(35) = 3.776, p = 0.0012). n = 5–12. (E) Problem solving ability was worse in old (14 months) neuronal Ldha induction compared to age-matched control across trials 2, 5, and 8 (genotype effect: F(1, 27) = 4.276, p = 0.0483). n = 13–15. (F) 3 min memory in old (14 months) neuronal Ldha induction mice was worse particularly for the intermediate difficulty trial 6 (t(79) = 2.899, p = 0.0145). n = 14–15. (G) 24 h memory in old (14 months) neuronal Ldha induction and age-matched control differed by sex (sex effect: F(1, 25) = 5.497, p = 0.0273). 24 h memory was retained equally in induction and control mice. n = 5–9. (H) Problem solving ability in young (7.5 months) neuronal Ldha KO and age-matched control mice differed by sex (sex effect: F(1, 41) = 11.30, p = 0.0017). Problem solving ability in KO compared with control mice was better across trials 2, 5, and 8 for males (genotype effect: F(1, 65) = 7.654, p = 0.0074) and for females (genotype effect: F(1, 19) = 4.036, p = 0.059; trial × genotype effect: F(2, 38) = 4.252, p = 0.0215). n = 9–12. (I) 3 min memory in young (7.5 months) neuronal Ldha KO compared with age-matched control mice was better (trial × genotype effect: F(2, 86) = 4.771, p = 0.0108) particularly for the intermediate difficulty trial 6 (t(38.93) = 2.783, p = 0.0246). n = 21–24. (J) 24 h memory in young (7.5 months) neuronal Ldha KO and age-matched control mice differed by sex (sex effect: F(1, 41) = 8.327, p = 0.0062; trial × sex: F(1, 40) = 4.371, p = 0.0429). 24 h memory in KO compared with control mice was retained equally in males and better in females (trial × genotype effect: F(1, 18) = 4.314, p = 0.0524) particularly in the higher difficulty trial 7 (t(37) = 2.455, p = 0.0375). n = 8–12. (K) Problem solving ability in old (14 months) neuronal Ldha KO and age-matched control mice differed by sex (sex effect: F(1, 40) = 5.490, p = 0.0242). Problem solving ability was retained equally in KO and control mice. n = 9–12. (L) 3 min memory was retained equally in old (14 months) neuronal Ldha KO compared with age-matched control mice. n = 19–24. (M) 24 h memory in old (14 months) neuronal Ldha KO and age-matched control mice differed by sex (sex effect: F(1, 40) = 4.154, p = 0.0482). 24 h memory was retained equally in KO compared with control mice. n = 9–12. For habituation trials, comparisons made by two-way ANOVA, fixed effects presented in each graph, and unpaired t test between genotypes. For problem solving, 3 min memory and 24 h memory trials, comparisons made using a mixed-effects model, fixed effects presented in each graph, with Geisser-Greenhouse correction for problem solving and 3 min memory and Šídák’s multiple comparisons tests between genotype for each trial. Data presented as mean ± SEM.
Figure 9
Figure 9
Neuronal Ldha induction and KO mouse experimental timelines Experimental timeline for neuronal Ldha induction mice (A) and KO mice (B). Branches in each timeline indicate utilization of separate cohorts with different trajectories.

References

    1. Mink J.W., Blumenschine R.J., Adams D.B. Ratio of central nervous system to body metabolism in vertebrates: Its constancy and functional basis. Am. J. Physiol. Regul. Integr. Comp. Physiol. 1981;241:203–212. doi: 10.1152/ajpregu.1981.241.3.r203. - DOI - PubMed
    1. Attwell D., Laughlin S.B. An Energy Budget for Signaling in the Grey Matter of the Brain. J. Cereb. Blood Flow Metab. 2001;21:1133–1145. doi: 10.1097/00004647-200110000-00001. - DOI - PubMed
    1. Aiello L.C., Wheeler P. The Expensive-Tissue Hypothesis: The Brain and the Digestive System in Human and Primate Evolution. Curr. Anthropol. 1995;36:199–221. doi: 10.1086/204350. - DOI
    1. Rolfe D.F., Brown G.C. Cellular energy utilization and molecular origin of standard metabolic rate in mammals. Physiol. Rev. 1997;77:731–758. doi: 10.1152/physrev.1997.77.3.731. - DOI - PubMed
    1. Clarke D.D., Sokoloff L. Basic Neurochemistry: Molecular, Cellular and Medical Aspects. 1999. Circulation and energy metabolism in the brain; pp. 637–669.

LinkOut - more resources