Excitation/Inhibition balance relates to cognitive function and gene expression in temporal lobe epilepsy: a high density EEG assessment with aperiodic exponent
- PMID: 39056027
- PMCID: PMC11272395
- DOI: 10.1093/braincomms/fcae231
Excitation/Inhibition balance relates to cognitive function and gene expression in temporal lobe epilepsy: a high density EEG assessment with aperiodic exponent
Abstract
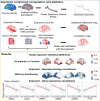
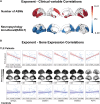
Patients with epilepsy are characterized by a dysregulation of excitation/inhibition balance (E/I). The assessment of E/I may inform clinicians during the diagnosis and therapy management, even though it is rarely performed. An accessible measure of the E/I of the brain represents a clinically relevant feature. Here, we exploited the exponent of the aperiodic component of the power spectrum of the electroencephalography (EEG) signal, as a non-invasive and cost-effective proxy of the E/I balance. We recorded resting-state activity with high-density EEG from 67 patients with temporal lobe epilepsy and 35 controls. We extracted the exponent of the aperiodic fit of the power spectrum from source-reconstructed EEG and tested differences between patients with epilepsy and controls. Spearman's correlation was performed between the exponent and clinical variables (age of onset, epilepsy duration and neuropsychology) and cortical expression of epilepsy-related genes derived from the Allen Human Brain Atlas. Patients with temporal lobe epilepsy showed a significantly larger exponent, corresponding to inhibition-directed E/I balance, in bilateral frontal and temporal regions. Lower E/I in the left entorhinal and bilateral dorsolateral prefrontal cortices corresponded to a lower performance of short-term verbal memory. Limited to patients with temporal lobe epilepsy, we detected a significant correlation between the exponent and the cortical expression of GABRA1, GRIN2A, GABRD, GABRG2, KCNA2 and PDYN genes. EEG aperiodic exponent maps the E/I balance non-invasively in patients with epilepsy and reveals a close relationship between altered E/I patterns, cognition and genetics.
Keywords: aperiodic exponent; excitation/inhibition balance; genetic expression; memory functioning; temporal lobe epilepsy.
© The Author(s) 2024. Published by Oxford University Press on behalf of the Guarantors of Brain.
Conflict of interest statement
The authors declare no competing interests.
Figures


References
-
- Kakigi R, Shibasaki H. Generator mechanisms of giant somatosensory evoked potentials in cortical reflex myoclonus. Brain. 1987;110(5):1359–1373. - PubMed
-
- Shibasaki H, Yamashita Y, Neshige R, Tobimatsu S, Fukui R. Pathogenesis of giant somatosensory evoked potentials in progressive myoclonic epilepsy. Brain. 1985;108(1):225–240. - PubMed
-
- Stafstrom CE. Recognizing seizures and epilepsy. In: Epilepsy. John Wiley & Sons, Ltd; 2014:1–9. doi: 10.1002/9781118456989.ch1 - DOI
LinkOut - more resources
Full Text Sources
Miscellaneous
