. 2024 Aug 15;137(16):jcs261952.
doi: 10.1242/jcs.261952. Epub 2024 Aug 28.

When less is more - a fast TurboID knock-in approach for high-sensitivity endogenous interactome mapping

Affiliations

When less is more - a fast TurboID knock-in approach for high-sensitivity endogenous interactome mapping

Alexander Stockhammer et al. J Cell Sci. .

Abstract

In recent years, proximity labeling has established itself as an unbiased and powerful approach to map the interactome of specific proteins. Although physiological expression of labeling enzymes is beneficial for the mapping of interactors, generation of the desired cell lines remains time-consuming and challenging. Using our established pipeline for rapid generation of C- and N-terminal CRISPR-Cas9 knock-ins (KIs) based on antibiotic selection, we were able to compare the performance of commonly used labeling enzymes when endogenously expressed. Endogenous tagging of the µ subunit of the adaptor protein (AP)-1 complex with TurboID allowed identification of known interactors and cargo proteins that simple overexpression of a labeling enzyme fusion protein could not reveal. We used the KI strategy to compare the interactome of the different AP complexes and clathrin and were able to assemble lists of potential interactors and cargo proteins that are specific for each sorting pathway. Our approach greatly simplifies the execution of proximity labeling experiments for proteins in their native cellular environment and allows going from CRISPR transfection to mass spectrometry analysis and interactome data in just over a month.

Keywords: Gene editing; Membrane trafficking; TurboID.


Conflict of interest statement

Competing interests The authors declare no competing or financial interests.

Figures

Fig. 1.
Fig. 1.
Rapid KI-strategy allows for endogenous tagging of AP1µA with different labeling enzyme for proximity biotinylation. (A) Scheme of the KI strategy. AP1µA was C-terminally tagged with the labeling enzyme, a V5 tag and a resistance cassette (including promoter, resistance and termination sequence) that allows for rapid selection of positive cells. (B) Blots of whole-cell lysates from generated cell lines to verify the KI of the labeling enzymes by anti-AP1µA and anti-V5 blotting. (C) Cell lines expressing the labeling enzymes endogenously were fixed and stained with an anti-V5 antibody to detect the labeling enzyme expression and localization. (D) Cells endogenously expressing the different labeling enzymes were fixed and stained with anti-V5 antibody to detect the labeling enzymes, an anti-p230 antibody to mark the TGN area and streptavidin–AF488 to detect biotinylated proteins. Cells were treated with 50 μM biotin for 24 h and AP1μAEN–APEX2-V5-expressing cells were incubated for 30 min with 500 μM biotin-phenol and labeling was induced for 1 min with H2O2. EN, endogenous. All images representative of three repeats. Scale bars: 10 µm.
Fig. 2.
Fig. 2.
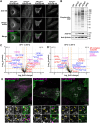
Endogenous tagging allows for more specific proximity labeling and interactome mapping than overexpression of the labeling enzyme. (A) STED micrographs of a fixed AP1µAEN–TurboID–V5 cell stained with anti-V5 antibody and streptavidin–STARORANGE to detect biotinylated proteins. Cells were treated with 50 µM biotin for 2 h before fixation. Magnified views show distinct overlap of biotinylated proteins and AP1µAEN-TurboID-V5 (marked by white arrows). (B) STED micrographs of a fixed cell transiently overexpressing AP1µA–TurboID–V5 that was treated as described in A. Magnified views show that biotinylated proteins and AP1µA–TurboID–V5 accumulate in distinct zones (white arrows indicate areas of biotinylation without AP1µA–TurboID–V5, yellow arrows indicate areas of accumulated biotin ligase without biotinylated proteins). Scale bars: 5 µm (main images); 500 nm (magnifications). Images in A and B representative of three repeats. (C) Volcano plot showing the changes in relative protein intensity between the overexpression (OE) experiment and control (cytosolic overexpressed TurboID). Significant hits are shown in the top right corner (P<0.05 and log2 fold change >1) separated by the orange lines. The volcano plot only includes proteins that were significantly enriched compared to WT cells. Subunits of the AP-1 complex (red), known interactors (blue) and known cargoes (magenta) are marked. The entire protein list is shown in Table S1. (D) Volcano plot showing the changes in relative protein intensity between the KI experiment (AP1µAEN–TurboID–V5) and control. Parameters are as in C. Data shown in the volcano plot is derived from three replicates. (E) GO term enrichment analysis showing enrichment of selected GO terms in the overexpression (OE) and KI condition. (F) Table of the analyzed subunits, interactors and cargo proteins. Differences (Diff.) in log2 fold enrichment are indicated. (G) Volcano plot showing the changes in relative protein intensity between KI experiment and OE experiment. Parameters are as in C. Data shown in the volcano plot is derived from three replicates. (H) Venn diagram showing the number of potential interactors [defined by protein localization and function (see Materials and Methods) and significant enrichment]. Lists of potential interactors are shown in Tables S2 and S3.
Fig. 3.
Fig. 3.
Interactome analysis of AP complexes with endogenous TurboID tagging. (A) HeLa KI cells expressing the endogenous AP µ subunits 1–4 fused to TurboID–V5 were fixed and stained with anti-V5 antibody to detect the labeling enzyme and streptavidin–AF488 to detect biotinylated proteins. Cells were incubated with biotin (50 µM) for 24 h before fixation. (B) Visualization of TurboID activity in all four KI cell lines on a western blot. Cells were treated with 50 µM biotin for 24 h. Whole-cell lysates were blotted with streptavidin–HRP to detect biotinylated proteins, and anti-V5 antibody to detect ligase expression. (C) Volcano plot showing the changes in relative protein intensity between AP1µAEN–TurboID–V5 and AP2µEN–TurboID–V5. Proteins that show significant changes in their relative intensity are shown in the top left (AP-1) and top right (AP-2) corner (P<0.05 and log2 fold change >1 or <−1) separated by the orange lines. Subunits of the AP complexes (red), potential interactors (blue) and potential cargoes (magenta) are marked. (D) Volcano plot showing the changes in relative protein intensity between AP3µAEN–TurboID–V5 and AP4µEN–TurboID–V5. Parameters are as in C. (E) HeLa AP1µAEN–SNAP–V5 KI cells labeled with JFX650-BG (BG, benzylguanine) that were transiently transfected with plasmids encoding for ITGB1–eGFP, eGFP–VAMP7 and eGFP–SCYL2 (left to right). Magnifications show where AP1µA domains are observed in close proximity to structures defined by the various proteins tested (marked by yellow arrows). All images representative of three repeats. Data shown in volcano plots in C and D is derived from four replicates. Scale bars: 10 µm (A; E, main images); 1 µm (E, magnifications).
Fig. 4.
Fig. 4.
Endogenous N-terminal tagging of CLCa with labeling enzymes. (A) Scheme of the KI strategy. CLCa was N-terminally tagged with the labeling enzyme and a V5 tag. The integrated resistance cassette can be excised after transfection with the Cre recombinase. (B) Blots of whole-cell lysates from generated cell lines to verify the KI of the labeling enzymes by anti-V5 blotting. (C) Cell lines expressing the labeling enzymes endogenously were fixed and stained for the V5 tag to detect the labeling enzyme expression. (D) Cells endogenously expressing the different labeling enzymes were fixed and stained with an anti-V5 antibody to detect the labeling enzymes, anti-CHC antibody to detect the endogenous clathrin heavy chain and streptavidin–AF488 to detect biotinylated proteins. Cells were treated with 50 μM biotin for 24 h and V5-APEX2-CLCaEN expressing cells were incubated for 30 min with 500 μM biotin-phenol and labeling was induced for 1 min with H2O2. All images representative of three repeats. Scale bars: 10 µm.
Fig. 5.
Fig. 5.
Comparison of interactome datasets allows mapping of pathway specific clathrin interactors. (A) Volcano plot showing the changes in relative protein intensity between AP1µAEN–TurboID–V5 and V5–TurboID–CLCaEN. Significant hits (P<0.05 and log2 fold change >1) are separated by the orange lines in the top right. Clathrin chains (red) and example proteins involved in clathrin-mediated endocytosis (blue) are marked. (B) GO term enrichment analysis showing the most enriched GO terms comparing enrichment for CLCa against AP1µA. (C) Volcano plot showing the changes in relative protein intensity between AP2µEN–TurboID–V5 and V5–TurboID–CLCaEN. Parameters are as in A. Clathrin chains (red) and example proteins involved in post-Golgi transport (blue) are marked. (D) GO term enrichment analysis showing the most enriched GO terms comparing enrichment for CLCa against AP2µ. Data for volcano plots and GO term enrichment diagrams is derived from four replicates.

References

    1. Abramoff, M., Magalhães, P. and Ram, S. J. (2004). Image processing with ImageJ. Biophotonics Intern. 11, 36-42.
    1. Antonicka, H., Lin, Z.-Y., Janer, A., Aaltonen, M. J., Weraarpachai, W., Gingras, A.-C. and Shoubridge, E. A. (2020). A high-density human mitochondrial proximity interaction network. Cell Metab. 32, 479-497.e9. 10.1016/j.cmet.2020.07.017 - DOI - PubMed
    1. Bai, H., Doray, B. and Kornfeld, S. (2004). GGA1 interacts with the adaptor protein AP-1 through a WNSF sequence in its hinge region. J. Biol. Chem. 279, 17411-17417. 10.1074/jbc.M401158200 - DOI - PubMed
    1. Banerjee, S. L., Lessard, F., Chartier, F. J. M., Jacquet, K., Osornio-Hernandez, A. I., Teyssier, V., Ghani, K., Lavoie, N., Lavoie, J. N., Caruso, M.et al. (2022). EPH receptor tyrosine kinases phosphorylate the PAR-3 scaffold protein to modulate downstream signaling networks. Cell Rep. 40, 111031. 10.1016/j.celrep.2022.111031 - DOI - PubMed
    1. Bogdanovic, A., Bennett, N., Kieffer, S., Louwagie, M., Morio, T., Garin, J., Satre, M. and Bruckert, F. (2002). Syntaxin 7, syntaxin 8, Vti1 and VAMP7 (vesicle-associated membrane protein 7) form an active SNARE complex for early macropinocytic compartment fusion in Dictyostelium discoideum. Biochem. J. 368, 29-39. 10.1042/bj20020845 - DOI - PMC - PubMed

Publication types

LinkOut - more resources