. 2024 Nov 25;120(14):1811-1824.
doi: 10.1093/cvr/cvae156.

Crucial role for sensory nerves and Na/H exchanger inhibition in dapagliflozin- and empagliflozin-induced arterial relaxation

Affiliations

Crucial role for sensory nerves and Na/H exchanger inhibition in dapagliflozin- and empagliflozin-induced arterial relaxation

Elizabeth A Forrester et al. Cardiovasc Res. .

Abstract

Aims: Sodium/glucose transporter 2 (SGLT2 or SLC5A2) inhibitors lower blood glucose and are also approved treatments for heart failure independent of raised glucose. Various studies have showed that SGLT2 inhibitors relax arteries, but the underlying mechanisms are poorly understood and responses variable across arterial beds. We speculated that SGLT2 inhibitor-mediated arterial relaxation is dependent upon calcitonin gene-related peptide (CGRP) released from sensory nerves independent of glucose transport.

Methods and results: The functional effects of SGLT1 and 2 inhibitors (mizagliflozin, dapagliflozin, and empagliflozin) and the sodium/hydrogen exchanger 1 (NHE1) blocker cariporide were determined on pre-contracted resistance arteries (mesenteric and cardiac septal arteries) as well as main renal conduit arteries from male Wistar rats using wire myography. SGLT2, CGRP, TRPV1, and NHE1 expression was determined by western blot and immunohistochemistry. Kv7.4/5/KCNE4 and TRPV1 currents were measured in the presence and absence of dapagliflozin and empagliflozin. All SGLT inhibitors (1-100 µM) and cariporide (30 µM) relaxed mesenteric arteries but had negligible effect on renal or septal arteries. Immunohistochemistry with TRPV1 and CGRP antibodies revealed a dense innervation of sensory nerves in mesenteric arteries that were absent in renal and septal arteries. Consistent with a greater sensory nerve component, the TRPV1 agonist capsaicin relaxed mesenteric arteries more effectively than renal or septal arteries. In mesenteric arteries, relaxations to dapagliflozin, empagliflozin, and cariporide were attenuated by the CGRP receptor antagonist BIBN-4096, depletion of sensory nerves with capsaicin, and blockade of TRPV1 or Kv7 channels. Neither dapagliflozin nor empagliflozin activated heterologously expressed TRPV1 channels or Kv7 channels directly. Sensory nerves also expressed NHE1 but not SGLT2 and cariporide pre-application as well as knockdown of NHE1 by translation stop morpholinos prevented the relaxant response to SGLT2 inhibitors.

Conclusion: SGLT2 inhibitors relax mesenteric arteries by promoting the release of CGRP from sensory nerves in a NHE1-dependent manner.

Keywords: Calcitonin-gene related peptide; Sensory nerves; Sodium/glucose transporter 2; Sodium/hydrogen exchanger; Vasodilatation.


Conflict of interest statement

Conflict of interest: none declared.

Figures

Graphical Abstract
Graphical Abstract
Pathway of SGLT2 inhibitor-induced relaxation in mesenteric arteries. SGLT2 inhibitors act on the sodium/hydrogen exchanger (NHE) to induce vasorelaxation. H, hydrogen; Na, sodium; Ca2+, calcium; CGRP, calcitonin gene-related peptide; TRPV1, transient receptor potential vanilloid 1; CLR, calcitonin receptor-like receptor; RAMP1, receptor activity-modifying protein 1; cGMP, cyclic guanosine monophosphate; PKA, protein kinase A; Kv7, voltage-gated potassium channel.
Figure 1
Figure 1
SGLT2 expression in mesenteric, renal, and coronary arteries. (A) Western blot quantification of SGLT2 protein in mesenteric, renal, and coronary arteries with whole kidney as a positive control (N = 3). Quantification of the western blot in mesenteric (left), renal (centre), and coronary (right) arteries shown in (B). (C) Representative staining of SGLT2 (middle row) and membrane stain WGA (top row) in isolated mesenteric, renal, and septal coronary VSMCs (N = 5, n = 25) with total cell fluorescence in (D) and membrane-to-cytosol ratio of SGLT2 expression in each artery in (E). All values were shown as mean ± SEM denoted by error bars, and a one-way ANOVA was used to calculate significance where *P < 0.05 and **P < 0.01. (FH) show representative labelling for TRPV1 (green, left column) and CGRP (magenta, middle column) indicative of sensory nerve presence in the adventitia of whole mesenteric (F), renal arteries (G), and septal arteries (H). Nuclei were labelled in blue. Similar images seen in arteries from 4 animals). Non-significance is shown by ns.
Figure 2
Figure 2
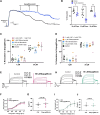
The effect of SGLT2 and SGLT1 inhibitors on mesenteric, renal, and septal arterial tones. (A) A representative trace of the effect of dapagliflozin in mesenteric arteries pre-contracted with 10 µM methoxamine. (B) Mean effect of dapagliflozin (blue), empagliflozin (green), and mizagliflozin (purple), with mean vehicle control in grey, N= 5–6. All values are shown as mean ± SEM denoted by the error bars (N = 6–8). (C and D) show the relaxation of dapagliflozin and empagliflozin in renal mesenteric (left hand data set), renal (middle data set), and septal (right hand data set) arteries. All data are individual experiments and a two-way ANOVA with a post hoc Sidak test was used to calculate significance values where **, ***, and **** denote P < 0.01, 0.001 and 0.0001 respectively. Non-significance is shown by ns.
Figure 3
Figure 3
SGLT2 inhibitors and Kv7 channels. (A) Representative trace of the effect of dapagliflozin on pre-contracted mesenteric arteries in the presence (upper trace/blue) and absence (lower trace) of 10 µM linopirdine. (B) Mean data for relaxations to dapagliflozin, empagliflozin, and mizagliflozin (30 µM) in solvent control (left data set) and when pre-incubated with 10 µM linopirdine (right data set/blue) (N = 5–6). All values are individual experiments with mean ± SEM denoted by the error bars. A two-way statistical ANOVA with a post hoc Sidak test was used to generate significant values (*P < 0.05, **P < 0.01, and ****P < 0.0001). The effect of dapagliflozin (C) and empagliflozin (D) in the absence and presence of HMR1556, iberiotoxin, 4-AP, TEA, and glibenclamide (data sets left to right respectively). All data values are shown as mean ± SEM (N = 5–6). (EG) show currents produced by the co-expression of Kv7.4, Kv7.5, and KCNE4 in the absence and presence of 100 µM dapagliflozin. Representative traces in (E), mean current–voltage relationship in (F), and mean membrane potential in (G). The effect of 100 µM empagliflozin on currents produced by co-expression of Kv7.4, 7.5, and KCNE4 is shown in (HJ). Representative traces in (H), mean current–voltage relationship in (I), and mean membrane potential in (J). Data are the mean of N oocytes with error bars denoting the SD.
Figure 4
Figure 4
Dapagliflozin-, empagliflozin-, and mizagliflozin-induced relaxations are blocked by CGRP receptor antagonist and TRPV1 blockade. (A) shows the percentage relaxation to 10 µM capsaicin in mesenteric (left hand data set), renal (middle data set), and septal arteries (right hand data set) (N = 6–8). (B) shows the mean relaxation to CGRP in the absence and presence of 10 µM linopirdine (blue, N = 5–8). All data points are represented as mean ± SEM denoted by the error bars. A two-way statistical ANOVA with a post hoc Bonferroni test was used to generate significant values (*P < 0.05, **P < 0.01, ***P < 0.001, and ****P < 0.0001). The mean effect of dapagliflozin (C, N = 6), empagliflozin (D, N = 7), and mizagliflozin (E, N = 5) on pre-contracted mesenteric arteries in the presence of DMSO (left data set) and 1 µM BIBN (right data set). The mean relaxations produced by 1 and 30 µM dapagliflozin (F, N = 7–10) and empagliflozin (G, N = 6–10) in mesenteric arteries pre-incubated in DMSO (solvent control, black), 1 µM AMG-517 (right hand data set), or after sensory nerve depletion with 10 µM capsaicin (centre data set). The relaxation to mizagliflozin in theabsence and presence of TRPV1 blocker AMG-517 (right hand data set) is shown in (H) (N = 5). All values are expressed as mean ± SEM. A two-way statistical ANOVA with a post hoc Sidak test was used to generate significant values (*P < 0.05, **P < 0.01, ***P < 0.001, and ****P < 0.0001).
Figure 5
Figure 5
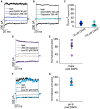
SGLT2 inhibitors do not activate TRPV1 directly. (A and B) Representative traces of currents at +120 and −120 mV from outside-out membrane patches of HEK293 cells expressing TRPV1. Leak currents were obtained in the absence of any agonist and after 5-min application of dapagliflozin (DAPA) 30 μM (blue traces, A) and 100 μM (green traces, B). The top and bottom traces shows the subsequent effect of 250 nM capsaicin. (C) Average data for experiments in (A and B). Currents were leak subtracted, and data were normalized to activation by capsaicin 250 nM in the steady state at +120 mV (N = 6 and N = 5 for DAPA 30 and 100 μM, respectively). (D) Representative traces of currents at +120 and −120 mV from outside-out membrane patches of HEK293 cells expressing TRPV1 in control conditions (grey), after application with 250 nM capsaicin (black traces) and after application of 250 nM capsaicin + 30 μM DAPA for 5 min (lilac traces). (E) The data in (D) were normalized by dividing the currents obtained at +120 mV in response to 250 nM capsaicin + 30 μM DAPA by the currents in response to 250 nM capsaicin alone; (N = 5). (F) Representative traces of currents at +120 and −120 mV from outside-out membrane patches of HEK293 cells expressing TRPV1 under control conditions (grey), after activation of TRPV1 by pH 6 (black) and after 5-min application of 30 μM DAPA to pH 6 conditions (blue). (G) The data in (F) were normalized by dividing the currents obtained at +120 mV in response to pH 6 + 30 μM DAPA by the currents in response to pH 6 alone (N = 6). Group data are reported as the mean ± SEM.
Figure 6
Figure 6
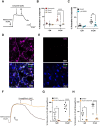
Effect of cariporide and NHE1 localization in mesenteric arteries. (A) A representative trace of the relaxation to 1 and 30 µM cariporide in mesenteric arteries pre-contracted with 10 µM methoxamine. (B) Mean percentage relaxation to 1 and 30 µM cariporide in mesenteric (left hand data), renal (middle data set), and septal arteries (right hand data set) (N = 6–10). (C) shows the mean percentage relaxation to cariporide (1–30 µM) in pre-contracted mesenteric arteries when incubated with DMSO (left) and 1 µM BIBN (right) (N = 5–6). (D and E) show representative labelling for TRPV1 alone (green, top) and with NHE1 (magenta, bottom) in the adventitia of whole mesenteric (D, N = 3) and renal (E, N = 4) arteries. Nuclei were labelled in blue. (F) Representative trace of the relaxation to empagliflozin (1–30 µM) in mesenteric arteries pre-contracted with 10 µM methoxamine in the presence (orange) and absence (black) of cariporide. The mean data for the response to 1 and 30 µM dapagliflozin (N = 5) and empagliflozin (N = 5) in the presence (top trace) and absence (bottom trace) of 10 µM cariporide are shown in (G and H). All data are individual experiments with the mean ± SEM denoted by the error bars. A two-way statistical ANOVA with a post hoc Sidak test was used to generate significant values (*P < 0.05, **P < 0.01, and ****P < 0.0001).
Figure 7
Figure 7
Knockdown of NHE1 impairs the relaxation of dapagliflozin and empagliflozin in mesenteric arteries. (A) A representative trace of the contraction to 10 µM methoxamine in the presence of 30 µM empagliflozin in scrambled control morpholino (black) and knockdown NHE1 morpholino (green/lighter line) arteries. (B) shows the mean data of the contraction to 10 µM methoxamine in scrambled control morpholino and knockdown NHE1 morpholino arteries when pre-incubated with 30 µM dapagliflozin or 30 µM empagliflozin. All data are represented as mean ± SEM denoted by the error bars. A two-way statistical ANOVA with a post hoc Sidak test was used to generate significant values (***P < 0.001 and ****P < 0.0001). (C) shows representative labelling for NHE1 alone (top image) and with TRPV1 (lower image) in the adventitia of whole mesenteric arteries transfected with scrambled morpholino (Ctrl) and NHE1-targeted morpholino (right hand column). Representative of 4 such experiments.

References

    1. Grempler R, Thomas L, Eckhardt M, Himmelsbach F, Sauer A, Sharp DE, Bakker RA, Mark M, Klein T, Eickelmann P. Empagliflozin, a novel selective sodium glucose cotransporter-2 (SGLT-2) inhibitor: characterisation and comparison with other SGLT-2 inhibitors. Diabetes Obes Metab 2012;14:83–90. - PubMed
    1. Wright EM. SGLT2 inhibitors: physiology and pharmacology. Kidney360 2021;2:2027–2037. - PMC - PubMed
    1. Preda A, Montecucco F, Carbone F, Camici GG, Lüscher TF, Kraler S, Liberale L. SGLT2 inhibitors: from glucose-lowering to cardiovascular benefits. Cardiovasc Res 2024;120:443–460. - PMC - PubMed
    1. McMurray JJV, Solomon SD, Inzucchi SE, Køber L, Kosiborod MN, Martinez FA, Ponikowski P, Sabatine MS, Anand IS, Bělohlávek J, Böhm M, Chiang CE, Chopra VK, Boer RA, de Desai AS, Diez M, Drozdz J, Dukát A, Ge J, Howlett JG, Katova T, Kitakaze M, Ljungman CEA, Merkely B, Nicolau JC, O’Meara E, Petrie MC, Vinh PN, Schou M, Tereshchenko S, Verma S, Held C, DeMets DL, Docherty KF, Jhund PS, Bengtsson O, Sjöstrand M, Langkilde AM. Dapagliflozin in patients with heart failure and reduced ejection fraction. NEJM 2019;381:1995–2008. - PubMed
    1. Nassif ME, Windsor S, Tang F, Khariton Y, Husain M, Inzucchi S, McGuire D, Pitt B, Scirica B, Austin B, Drazner M, Fong M, Givertz M, Gordon R, Jermyn R, Katz S, Lamba S, Lanfear D, LaRue S, Lindenfeld JA, Malone M, Margulies K, Mentz R, Kannan Mutharasan R, Pursley M, Umpierrez G, Kosiborod M, Malik A, Wenger N, Ogunniyi M, Vellanki P, Murphy B, Newman J, Hartupee J, Gupta C, Goldsmith M, Baweja P, Montero M, Gottlieb S, Costanzo MR, Hoang T, Warnock A, Allen L, Tang W, Chen H, Cox J. Dapagliflozin effects on biomarkers, symptoms, and functional status in patients with heart failure with reduced ejection fraction. Circulation 2019;140:1463–1476. - PubMed

Publication types

MeSH terms