. 2024 Jul 26:12:RP91114.
doi: 10.7554/eLife.91114.

SPAG7 deletion causes intrauterine growth restriction, resulting in adulthood obesity and metabolic dysfunction

Affiliations

SPAG7 deletion causes intrauterine growth restriction, resulting in adulthood obesity and metabolic dysfunction

Stephen E Flaherty 3rd et al. Elife. .

Abstract

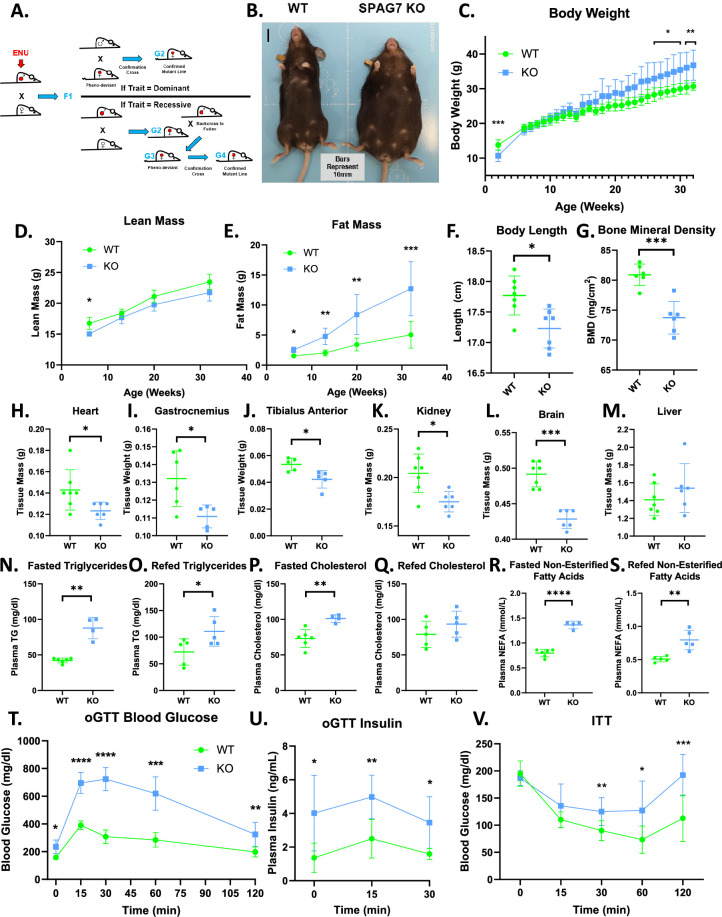
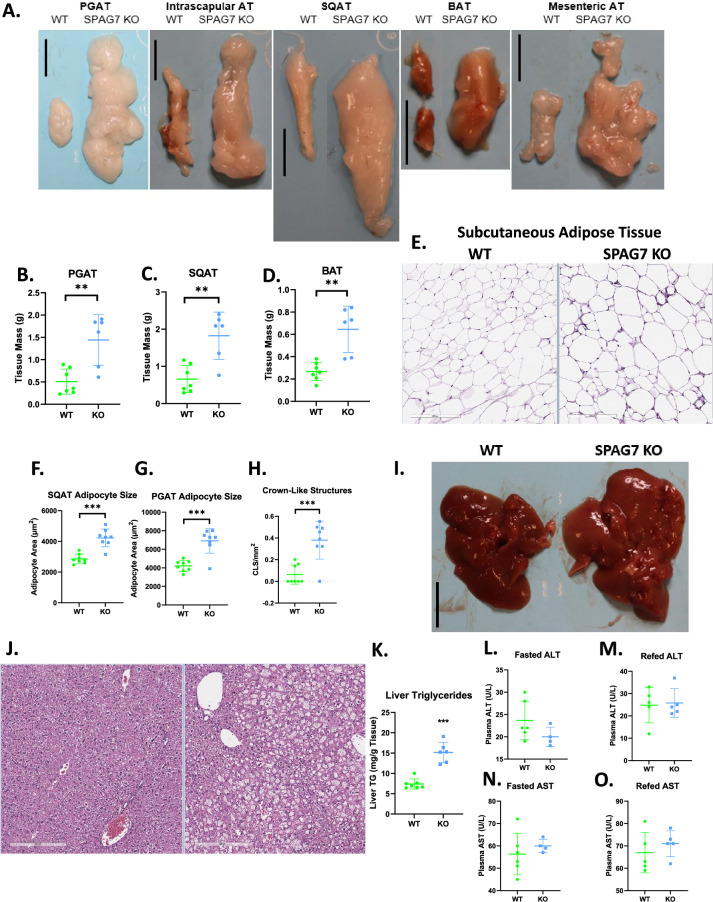
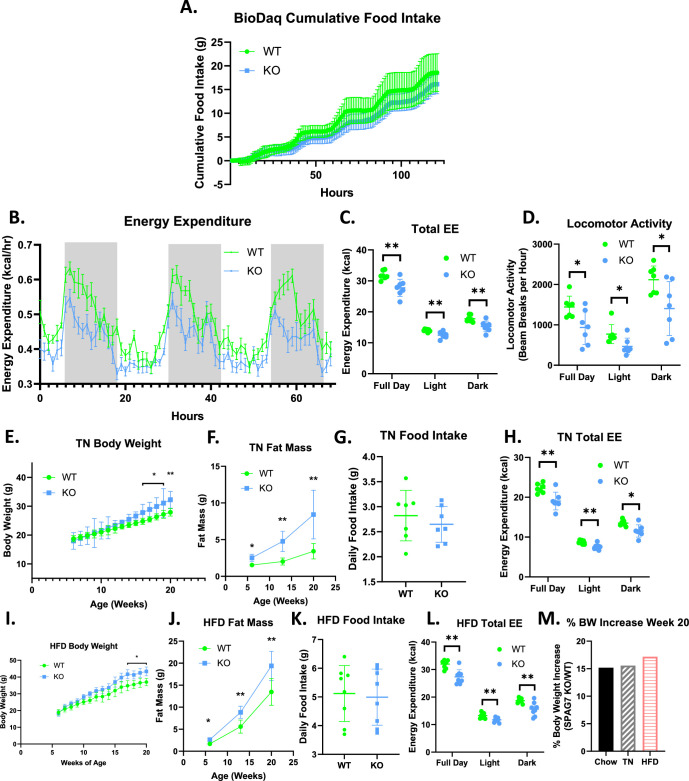
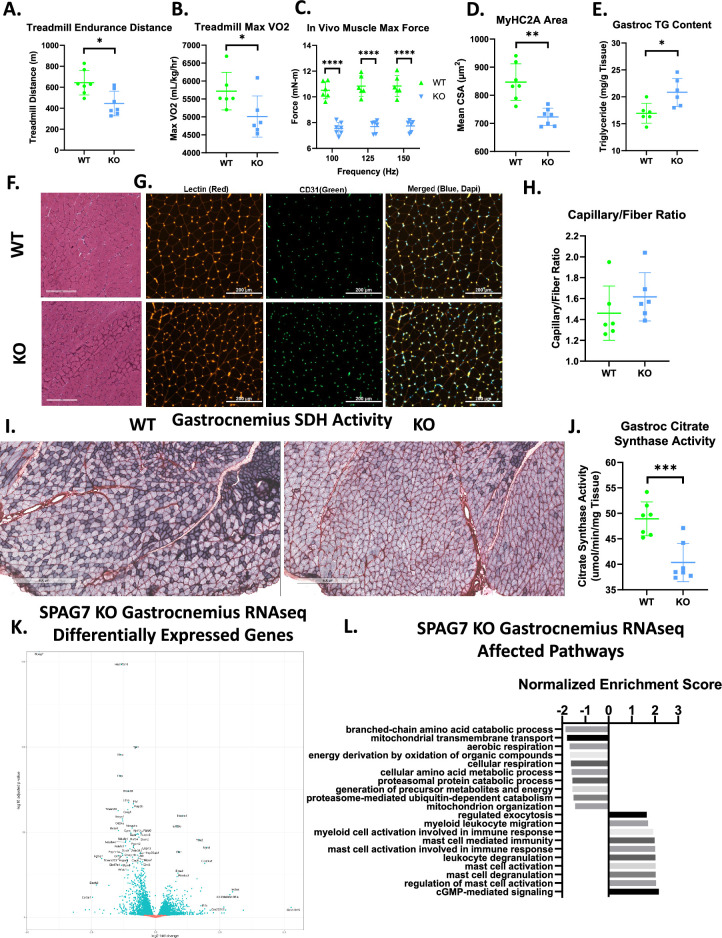
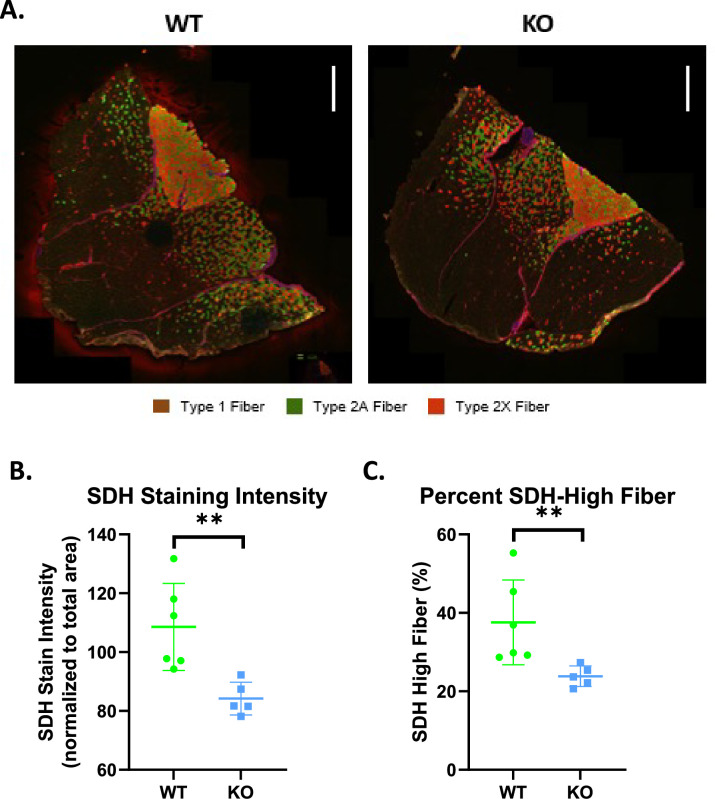
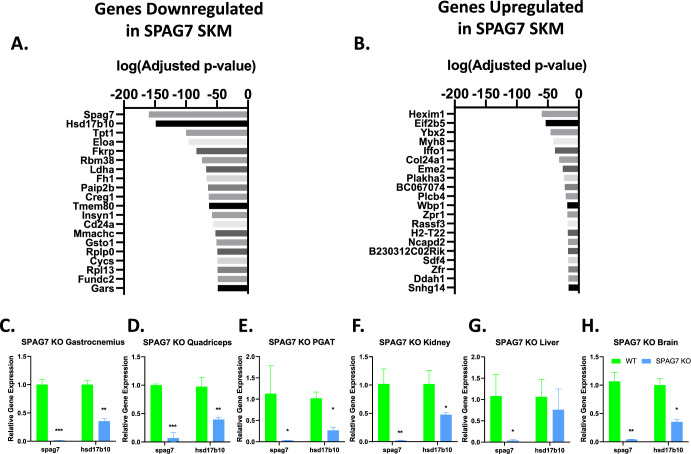
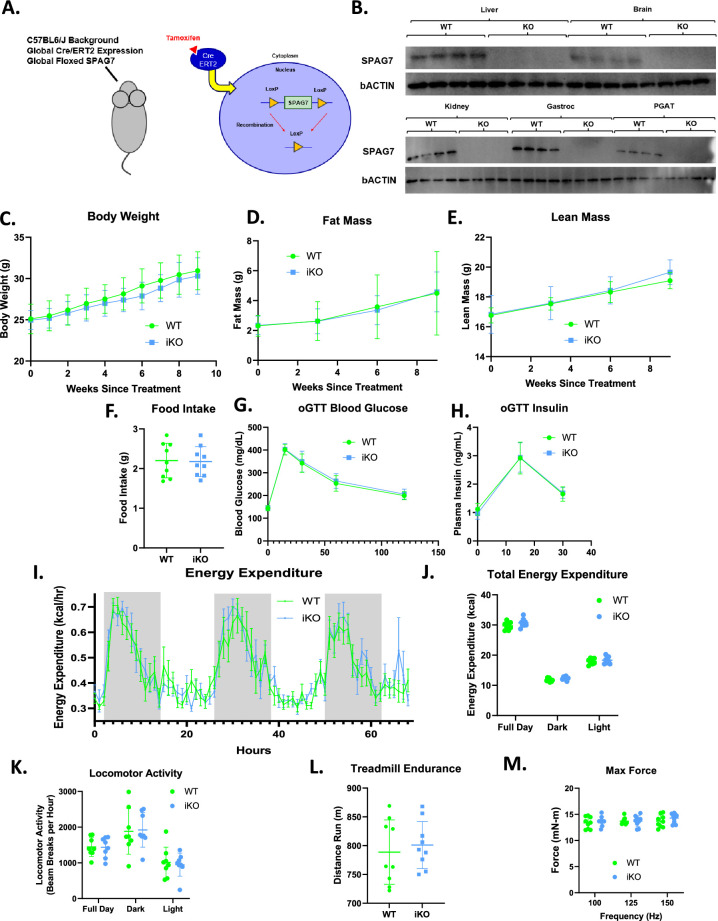
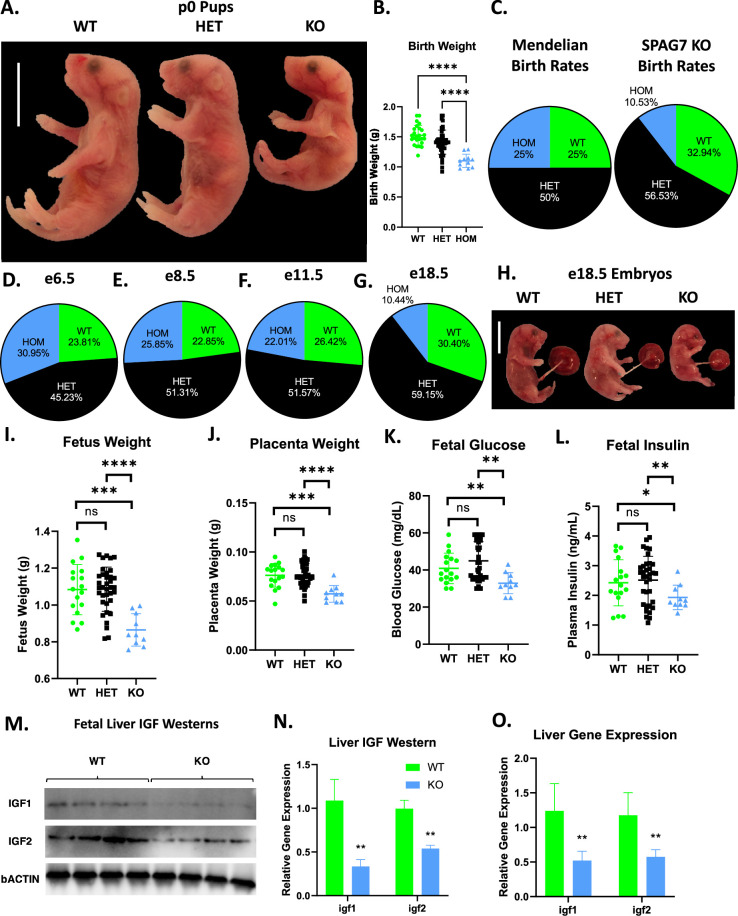
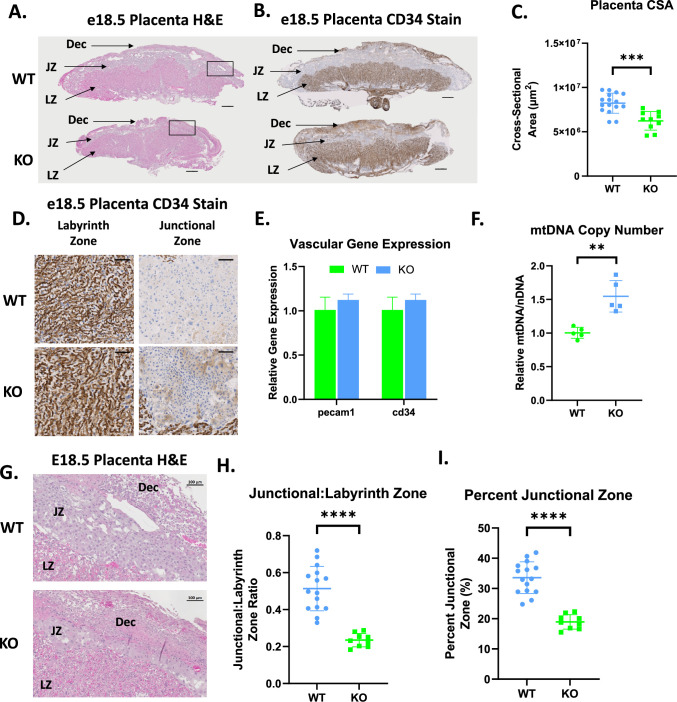
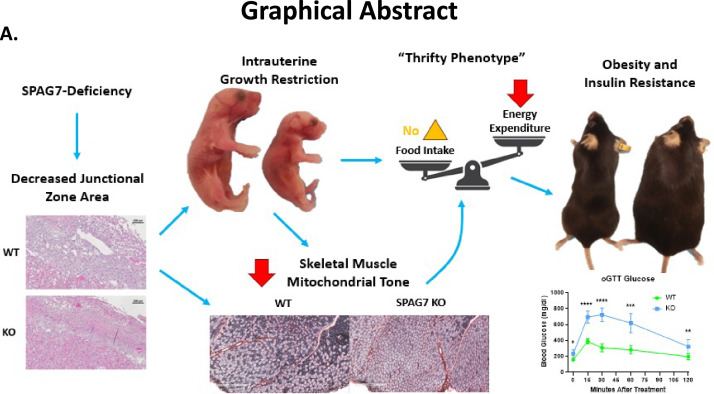
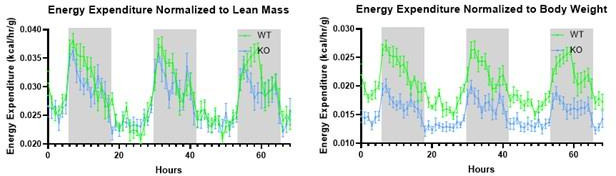
From a forward mutagenetic screen to discover mutations associated with obesity, we identified mutations in the Spag7 gene linked to metabolic dysfunction in mice. Here, we show that SPAG7 KO mice are born smaller and develop obesity and glucose intolerance in adulthood. This obesity does not stem from hyperphagia, but a decrease in energy expenditure. The KO animals also display reduced exercise tolerance and muscle function due to impaired mitochondrial function. Furthermore, SPAG7-deficiency in developing embryos leads to intrauterine growth restriction, brought on by placental insufficiency, likely due to abnormal development of the placental junctional zone. This insufficiency leads to loss of SPAG7-deficient fetuses in utero and reduced birth weights of those that survive. We hypothesize that a 'thrifty phenotype' is ingrained in SPAG7 KO animals during development that leads to adult obesity. Collectively, these results indicate that SPAG7 is essential for embryonic development and energy homeostasis later in life.

Keywords: SPAG7; developmental biology; embryonic development; insulin resistance; intrauterine growth restriction; medicine; mouse; obesity.

Plain language summary

Obesity rates are climbing worldwide, leading to an increase in associated conditions such as type 2 diabetes. While new pharmaceutical approaches are available to help individuals manage their weight, many patients do not respond to them or experience prohibitive side effects. Identifying alternative treatments will likely require pinpointing the genes and molecular actors involved in the biological processes that control weight regulation. Previous research suggests that a protein known as SPAG7 could help shape how mice use and store the energy they extract from food. Flaherty et al. therefore set out to investigate the role this protein plays in the body. To do so, they created a line of mice born without SPAG7, which they monitored closely throughout life. These animals were underweight at birth and did not eat more than other mice, yet they were obese as adults. Their ability to exercise was reduced, their muscles were weaker and contained fibers with functional defects. The mice also exhibited biological changes associated with the onset of diabetes. Yet deleting SPAG7 during adulthood led to no such changes; these mice maintained normal muscle function and body weight. Closely examining how SPAG7-deficient mice developed in the womb revealed placental defects which likely caused these animals to receive fewer nutrients from their mother. Such early-life deprivation is known to be associated with the body shifting towards maximizing its use of resources and privileging fat storage, even into and throughout adulthood. By shedding light on the biological role of SPAG7, the work by Flaherty et al. helps to better understand how developmental events can increase the likelihood of obesity later in life. Further investigations are now needed to explore whether this knowledge could help design interventions relevant to human health.


Conflict of interest statement

SF, LS, MP, SA, JG, AR, DS, YA, EP employee of Pfizer Inc, OB, BP, JP, YP, AO, MB, ZW was an employee of Pfizer Inc when the study was conducted, YL, RS No competing interests declared

Figures

Figure 1.
Figure 1.. SPAG7-deficiency causes obesity and insulin resistance.
(A) Graphical representation of an ENU-driven forward genetic screen. (B) Images of WT and SPAG7 KO littermates at 32 weeks of age. (C) WT vs SPAG7 KO body weight over time. n=7. Significance was assessed by Welch’s two sample t-test. (D) WT vs SPAG7 KO lean mass over time. n=7. Significance was assessed by Welch’s two sample t-test. (E) WT vs SPAG7 KO fat mass over time. n=7. Significance was assessed by Welch’s two sample t-test. (F) Body length measured from nose to base-of-tail. n=7. Significance was assessed by Welch’s two sample t-test. (G) Bone mineral density, as determined by DEXA scan. n=7. Significance was assessed by Welch’s two sample t-test. (H) Heart weight. n=7. Significance was assessed by Welch’s two sample t-test. (I) Gastrocnemius muscle weight. n=7. Significance was assessed by Welch’s two sample t-test. (J) Tibialis anterior muscle weight. n=7. Significance was assessed by Welch’s two sample t-test. (K) Kidney weight. n=7. Significance was assessed by Welch’s two sample t-test. (L) Brain weight. n=7. Significance was assessed by Welch’s two sample t-test. (M) Liver weight. N=7. (N) Plasma triglyceride levels following 8 hr fast. n=5. Significance was assessed by Welch’s two sample t-test. (O) Plasma triglyceride levels following 8 hr fast with a 2 hr ad-lib refeed. n=5. Significance was assessed by Welch’s two sample t-test. (P) Plasma total cholesterol levels following 8 hr fast. n=5. Significance was assessed by Welch’s two sample t-test. (Q) Plasma total cholesterol levels following 8 hr fast with a 2 hr refeed. n=5. (R) Plasma NEFA levels following 8 hr fast. n=5. Significance was assessed by Welch’s two sample t-test. (S) Plasma NEFA levels following 8 hr fast with a 2 hr refeed. n=5. Significance was assessed by Welch’s two sample t-test. (T) Blood glucose levels following an oral glucose challenge. n=7. Significance was assessed by Welch’s two sample t-test. (U) Plasma insulin levels following an oral glucose challenge. n=7. Significance was assessed by Welch’s two sample t-test. (V) Blood glucose levels following an IP insulin challenge. n=7. Significance was assessed by Welch’s two sample t-test. * p<0.05, ** p<0.01, *** p<0.001, **** p<0.0001.
Figure 1—figure supplement 1.
Figure 1—figure supplement 1.. SPAG7 KO adipose tissue and liver.
(A) Gross morphology of WT vs. SPAG7 KO perigonadal (PGAT), intrascapular, subcutaneous inguinal (SQAT), brown (BAT), and mesenteric adipose tissue depots. Scale bars = 10 mm (B) PGAT tissue weights. n=6. Significance was assessed by Welch’s two sample t-test. (C) SQAT tissue weights. n=6. Significance was assessed by Welch’s two sample t-test. (D) BAT tissue weights. n=6. Significance was assessed by Welch’s two sample t-test. (E) Histological sections of WT and SPAG7 KO SQAT stained with hematoxylin and eosin. Scale bars = 200 µm. (F) SQAT average adipocyte area. n=8. Significance was assessed by Welch’s two sample t-test. (G) PGAT average adipocyte area. n=8. Significance was assessed by Welch’s two sample t-test. (H) Number of crown-like structures per mm2 in SQAT. n=8. Significance was assessed by Welch’s two sample t-test. (I) Gross morphology of WT vs SPAG7 KO liver. Scale bars = 10 mm (J) Histological sections of WT vs SPAG7 KO liver tissue. Scale bar = 300 um. (K) Triglyceride content of WT vs SPAG7 KO liver tissue. n=6. Significance was assessed by Welch’s two sample t-test. (L) Circulating ALT levels after a 16 hr fast. N=4. (M) Circulating ALT levels after a 16 hr fast, followed by a 2 hr refeed. N=4. (N) Circulating AST levels following a 16 hr fast. N=4. (O) Circulating AST levels following a 16 hr fast, followed by a 2 hr refeed. n=4. ** p<0.01, *** p<0.001.
Figure 2.
Figure 2.. SPAG7-deficiency causes decreased locomotor activity and total energy expenditure.
(A) Cumulative food intake as determined by BioDaq Food and Water intake monitoring system. N=7. (B) Hourly energy expenditure as determined by CLAMS metabolic cage system. N=7. (C) Total energy expenditure as determined by CLAMS metabolic cage system. n=7. Significance was assessed by Welch’s two sample t-test. (D) Home cage locomotor activity as determined by CLAMS metabolic cage system. n=7. Significance was assessed by Welch’s two sample t-test. (E) Body weight over time of WT vs SPAG7 KO animals raised at thermoneutrality. n=7. Significance was assessed by Welch’s two sample t-test. (F) Fat mass over time of animals at thermoneutrality. n=7. Significance was assessed by Welch’s two sample t-test. (G) Daily food intake of animals at thermoneutrality. N=7. (H) Total energy expenditure of animals at thermoneutrality as determined by CLAMS. n=7. Significance was assessed by Welch’s two sample t-test. (I) Body weight over time of WT vs SPAG7 KO animals raised on high-fat diet. n=8. Significance was assessed by Welch’s two sample t-test.(J) Fat mass over time of animals fed high-fat diet. n=8. Significance was assessed by Welch’s two sample t-test. (K) Daily food intake of animals fed high-fat diet. N=8. (L) Total energy expenditure of animals fed high-fat diet. n=8. Significance was assessed by Welch’s two sample t-test. (M) Percent body weight difference in SPAG7 KO animals vs WT fed chow diet at room temperature (Chow), fed chow diet at thermoneutrality (TN), or HFD at room temperature (HFD) at 20 weeks of age. n=7. * p<0.05, ** p<0.01.
Figure 3.
Figure 3.. SPAG7-deficiency dampens skeletal muscle function and mitochondrial oxidative capacity.
(A) Distance run until exhaustion for WT vs SPAG7 KO animals in treadmill endurance test. n=7. Significance was assessed by Welch’s two sample t-test. (B) Max VO2 reached during treadmill endurance. n=6. Significance was assessed by Welch’s two sample t-test. (C) In vivo gastrocnemius/soleus complex muscle max force generation. n=6. Significance was assessed by Welch’s two sample t-test. (D) Cross sectional area of myosin heavy chain 2a-expressing fiber in gastrocnemius muscle. n=7. Significance was assessed by Welch’s two sample t-test. (E) Triglyceride content of gastrocnemius muscle. n=6. Significance was assessed by Welch’s two sample t-test. (F) Histological sections of gastrocnemius muscle stained with hematoxylin and eosin. Scale bars = 300 µm. (G) Histological sections of gastrocnemius muscle labeled with antibodies against lectin (red), CD31 (green), and DAPI (blue). Scale bars = 200 µm. (H) Quantification of CD31 +and lectin +capillaries per muscle fiber in gastrocnemius muscle. N=6. (I) Histological sections of gastrocnemius muscle stained for succinate dehydrogenase B activity. Scale bars = 600 µm. (J) Citrate synthase activity of gastrocnemius muscle. n=7. Significance was assessed by Welch’s two sample t-test. (K) Volcano plot of differentially expressed genes in female WT vs SPAG7 KO gastrocnemius muscle following RNAseq. N=7. (L) Gene ontology enrichment pathway analysis of differentially expressed genes in female WT vs SPAG7 KO gastrocnemius muscle following RNAseq. n=7. * p<0.05, ** p<0.01, *** p<0.001, **** p<0.0001.
Figure 3—figure supplement 1.
Figure 3—figure supplement 1.. SPAG7-deficient muscle fiber staining.
(A) Fluorescent microscopy images of WT and SPAG7-deficient gastrocnemius/soleus muscle complex stained for Type 1 Fiber (Orange), Type 2 A Fiber (Green), and Type 2 X Fiber (Red). Scale bars represent 1 mm. (B) SDH staining intensity in WT vs. SPAG7-deficient gastrocnemius muscle. Significance was assessed by Welch’s two sample t-test. (C) Percent SDH-High staining fiber in WT vs. SPAG7-deficient gastrocnemius muscle. Significance was assessed by Welch’s two sample t-test. ** p<0.01.
Figure 3—figure supplement 2.
Figure 3—figure supplement 2.. SPAG7-deficient skeletal muscle transcriptomics.
(A) Top 20 genes downregulated in SPAG7 KO gastrocnemius muscle vs WT by log(adjusted p-value). N=7. (B) Top 20 genes upregulated in SPAG7 KO gastrocnemius muscle vs WT by log(adjusted p-value). N=7. (C) Gene expression by qPCR of Spag7 and Hsd17b10 in SPAG7 KO gastrocnemius muscle. n=7. Significance was assessed by Welch’s two sample t-test. (D) Gene expression by qPCR of Spag7 and Hsd17b10 in SPAG7 KO quadriceps muscle. n=7. Significance was assessed by Welch’s two sample t-test. (E) Gene expression by qPCR of Spag7 and Hsd17b10 in SPAG7 KO in perigonadal adipose tissue. n=7. Significance was assessed by Welch’s two sample t-test. (F) Gene expression by qPCR of Spag7 and Hsd17b10 in SPAG7 KO kidney. n=7. Significance was assessed by Welch’s two sample t-test. (G) Gene expression by qPCR of Spag7 and Hsd17b10 in SPAG7 KO liver. n=7. Significance was assessed by Welch’s two sample t-test. (H) Gene expression by qPCR of pag7 and Hsd17b10 in SPAG7 KO brain. n=7. Significance was assessed by Welch’s two sample t-test. * p<0.05, ** p<0.01, *** p<0.001.
Figure 4.
Figure 4.. Whole-body SPAG7-deficiency induced during adulthood has no effect on systemic metabolism.
(A) Graphic representation of the whole-body inducible SPAG7-deficient mouse model (iSPAG7 KO). (B) Western blot for SPAG7 and bACTIN in liver, brain, kidney, gastrocnemius muscle, and PGAT tissues from iSPAG7 KO animals, 8 weeks following final tamoxifen dose. N=4. (C) iSPAG7 KO body weight over time. N=9. (D) iSPAG7 KO fat mass over time. N=9. (E) iSPAG7 KO lean mass over time. N=9. (F) iSPAG7 KO daily food intake, as measured by hopper weight. Taken 9 weeks after treatment. N=9. (G) Blood glucose levels following an oral glucose bolus. Taken 7 weeks after treatment. N=9. (H) Plasma insulin levels following an oral glucose bolus. Taken 7 weeks after treatment. N=9. (I) Hourly energy expenditure as determined by CLAMS metabolic cage system. Taken 6 weeks after treatment. N=9. (J) Total energy expenditure as determined by CLAMS metabolic cage system. Taken 6 weeks after treatment. N=9. (K) Home cage locomotor activity as determined by CLAMS metabolic cage system. Taken 6 weeks after treatment. N=9. (L) Distance run until exhaustion during treadmill endurance test. Taken 8 weeks after treatment. N=9. (M) In vivo gastrocnemius/soleus complex muscle max force generation. Taken 8 weeks after treatment. n=9.
Figure 5.
Figure 5.. SPAG7-deficiency induces intrauterine growth restriction.
(A) Gross morphology of WT, SPAG7 KO Heterozygous, and SPAG7 KO Homozygous pups at p0. Scale bars represent 10 mm. (B) Birth weights of WT, SPAG7 KO Heterozygous, and SPAG7 KO Homozygous pups. Number of WT pups = 25. Number of HET pups = 45. Number of HOM pups = 11. Significance was assessed by one-way ANOVA and Tukey HSD. (C) Mendelian birth genotyping rates expected from Heterozygous x Heterozygous breeding (left), and birth genotyping rates observed from SPAG7 KO Heterozygous x Heterozygous breeding (right). Number of dams = 29. (D) Embryo genotyping rates at e6.5 from SPAG7 KO Heterozygous x Heterozygous breeding. Number of dams = 6. (E) Embryo genotyping rates at e8.5 from SPAG7 KO Heterozygous x Heterozygous breeding. Number of dams = 6. (F) Embryo genotyping rates at e11.5 from SPAG7 KO Heterozygous x Heterozygous breeding. Number of dams = 6. (G) Embryo genotyping rates at e18.5 from SPAG7 KO Heterozygous x Heterozygous breeding. Number of dams = 6. (H) Gross morphology of WT, HET, and SPAG7 KO embryos at e18.5. Scale bars represent 10 mm. (I) Fetus weights at e18.5, comparing WT and SPAG7 KO embryos. n=10. Significance was assessed by one-way ANOVA and Tukey HSD. (J) Placenta weights at e18.5, comparing WT and SPAG7 KO embryos. n=10. Significance was assessed by one-way ANOVA and Tukey HSD. (K) Fetal blood glucose levels at e18.5, comparing WT and SPAG7 KO embryos. n=10. Significance was assessed by one-way ANOVA and Tukey HSD. (L) Fetal plasma insulin levels at e18.5, comparing WT and SPAG7 KO embryos. n=10. Significance was assessed by one-way ANOVA and Tukey HSD. (M) Western blots for bACTIN, IGF1, and IGF2 in WT and SPAG7 fetal liver at e18.5. n=4. (N) Quantification of western blots in Figure 6M. n=4. Significance was assessed by Welch’s two sample t-test. (O) Gene expression levels of igf1 and igf2 in fetal liver at e18.5. n=6. Significance was assessed by Welch’s two sample t-test. * p<0.05, ** p<0.01, *** p<0.001, **** p<0.0001.
Figure 6.
Figure 6.. SPAG7-deficiency induces placental insufficiency.
(A) Histological sections of WT and SPAG7 KO placenta stained with hematoxylin and eosin. Scale bars = 500 um. (B) Histological sections of WT and SPAG7 KO placenta labeled with CD34 antibody. Scale bars = 500 um. (C) Total placenta cross-sectional area of WT and SPAG7 KO placenta at e18.5. n=9. Significance was assessed by Welch’s two sample t-test. (D) Histological sections of WT and SPAG7 KO placenta labyrinth and junctional zones labeled with CD34 antibody. Scale bars = 100 um. (E) Whole placenta gene expression of vascular markers. N=5. (F) Whole placenta mtDNA copy number. n=5. Significance was assessed by Welch’s two sample t-test. (G) Histological sections of WT and SPAG7 KO placenta stained with hematoxylin and eosin. Scale bars = 100 um. (H) Junctional:Labyrinth Zone ratios in WT and SPAG7 KO placenta. n=9. Significance was assessed by Welch’s two sample t-test. (I) Percent Junctional Zone in WT and SPAG7 KO placenta. n=9. Significance was assessed by Welch’s two sample t-test. * p<0.05, ** p<0.01, *** p<0.001, **** p<0.0001.
Figure 7.
Figure 7.. Graphical abstract.
(A) SPAG7-deficiency causes intrauterine growth restriction which leads to obesity and insulin resistance in adulthood.
Author response image 1.

Update of

  • doi: 10.1101/2023.09.05.555087
  • doi: 10.7554/eLife.91114.1
  • doi: 10.7554/eLife.91114.2

References

    1. Abu-Halima M, Becker LS, Al Smadi MA, Kunz LS, Gröger L, Meese E. Expression of SPAG7 and its regulatory microRNAs in seminal plasma and seminal plasma-derived extracellular vesicles of patients with subfertility. Scientific Reports. 2023;13:3645. doi: 10.1038/s41598-023-30744-3. - DOI - PMC - PubMed
    1. Agrogiannis GD, Sifakis S, Patsouris ES, Konstantinidou AE. Insulin-like growth factors in embryonic and fetal growth and skeletal development (Review) Molecular Medicine Reports. 2014;10:579–584. doi: 10.3892/mmr.2014.2258. - DOI - PMC - PubMed
    1. Ashburner M, Ball CA, Blake JA, Botstein D, Butler H, Cherry JM, Davis AP, Dolinski K, Dwight SS, Eppig JT, Harris MA, Hill DP, Issel-Tarver L, Kasarskis A, Lewis S, Matese JC, Richardson JE, Ringwald M, Rubin GM, Sherlock G. Gene Ontology: tool for the unification of biology. Nature Genetics. 2000;25:25–29. doi: 10.1038/75556. - DOI - PMC - PubMed
    1. Ayhan Ö, Balkan M, Guven A, Hazan R, Atar M, Tok A, Tolun A. Truncating mutations in TAF4B and ZMYND15 causing recessive azoospermia. Journal of Medical Genetics. 2014;51:239–244. doi: 10.1136/jmedgenet-2013-102102. - DOI - PubMed
    1. Baldarelli RM, Smith CM, Finger JH, Hayamizu TF, McCright IJ, Xu J, Shaw DR, Beal JS, Blodgett O, Campbell J, Corbani LE, Frost PJ, Giannatto SC, Miers DB, Kadin JA, Richardson JE, Ringwald M. The mouse gene expression database (GXD): 2021 update. Nucleic Acids Research. 2021;49:D924–D931. doi: 10.1093/nar/gkaa914. - DOI - PMC - PubMed

Associated data