. 2024 Sep;65(9):2686-2699.
doi: 10.1111/epi.18074. Epub 2024 Jul 26.

Network signatures define consciousness state during focal seizures

Affiliations

Network signatures define consciousness state during focal seizures

Derek J Doss et al. Epilepsia. 2024 Sep.

Abstract

Objective: Epilepsy is a common neurological disorder affecting 1% of the global population. Loss of consciousness in focal impaired awareness seizures (FIASs) and focal-to-bilateral tonic-clonic seizures (FBTCSs) can be devastating, but the mechanisms are not well understood. Although ictal activity and interictal connectivity changes have been noted, the network states of focal aware seizures (FASs), FIASs, and FBTCSs have not been thoroughly evaluated with network measures ictally.

Methods: We obtained electrographic data from 74 patients with stereoelectroencephalography (SEEG). Sliding window band power, functional connectivity, and segregation were computed on preictal, ictal, and postictal data. Five-minute epochs of wake, rapid eye movement sleep, and deep sleep were also extracted. Connectivity of subcortical arousal structures was analyzed in a cohort of patients with both SEEG and functional magnetic resonance imaging (fMRI). Given that custom neuromodulation of seizures is predicated on detection of seizure type, a convolutional neural network was used to classify seizure types.

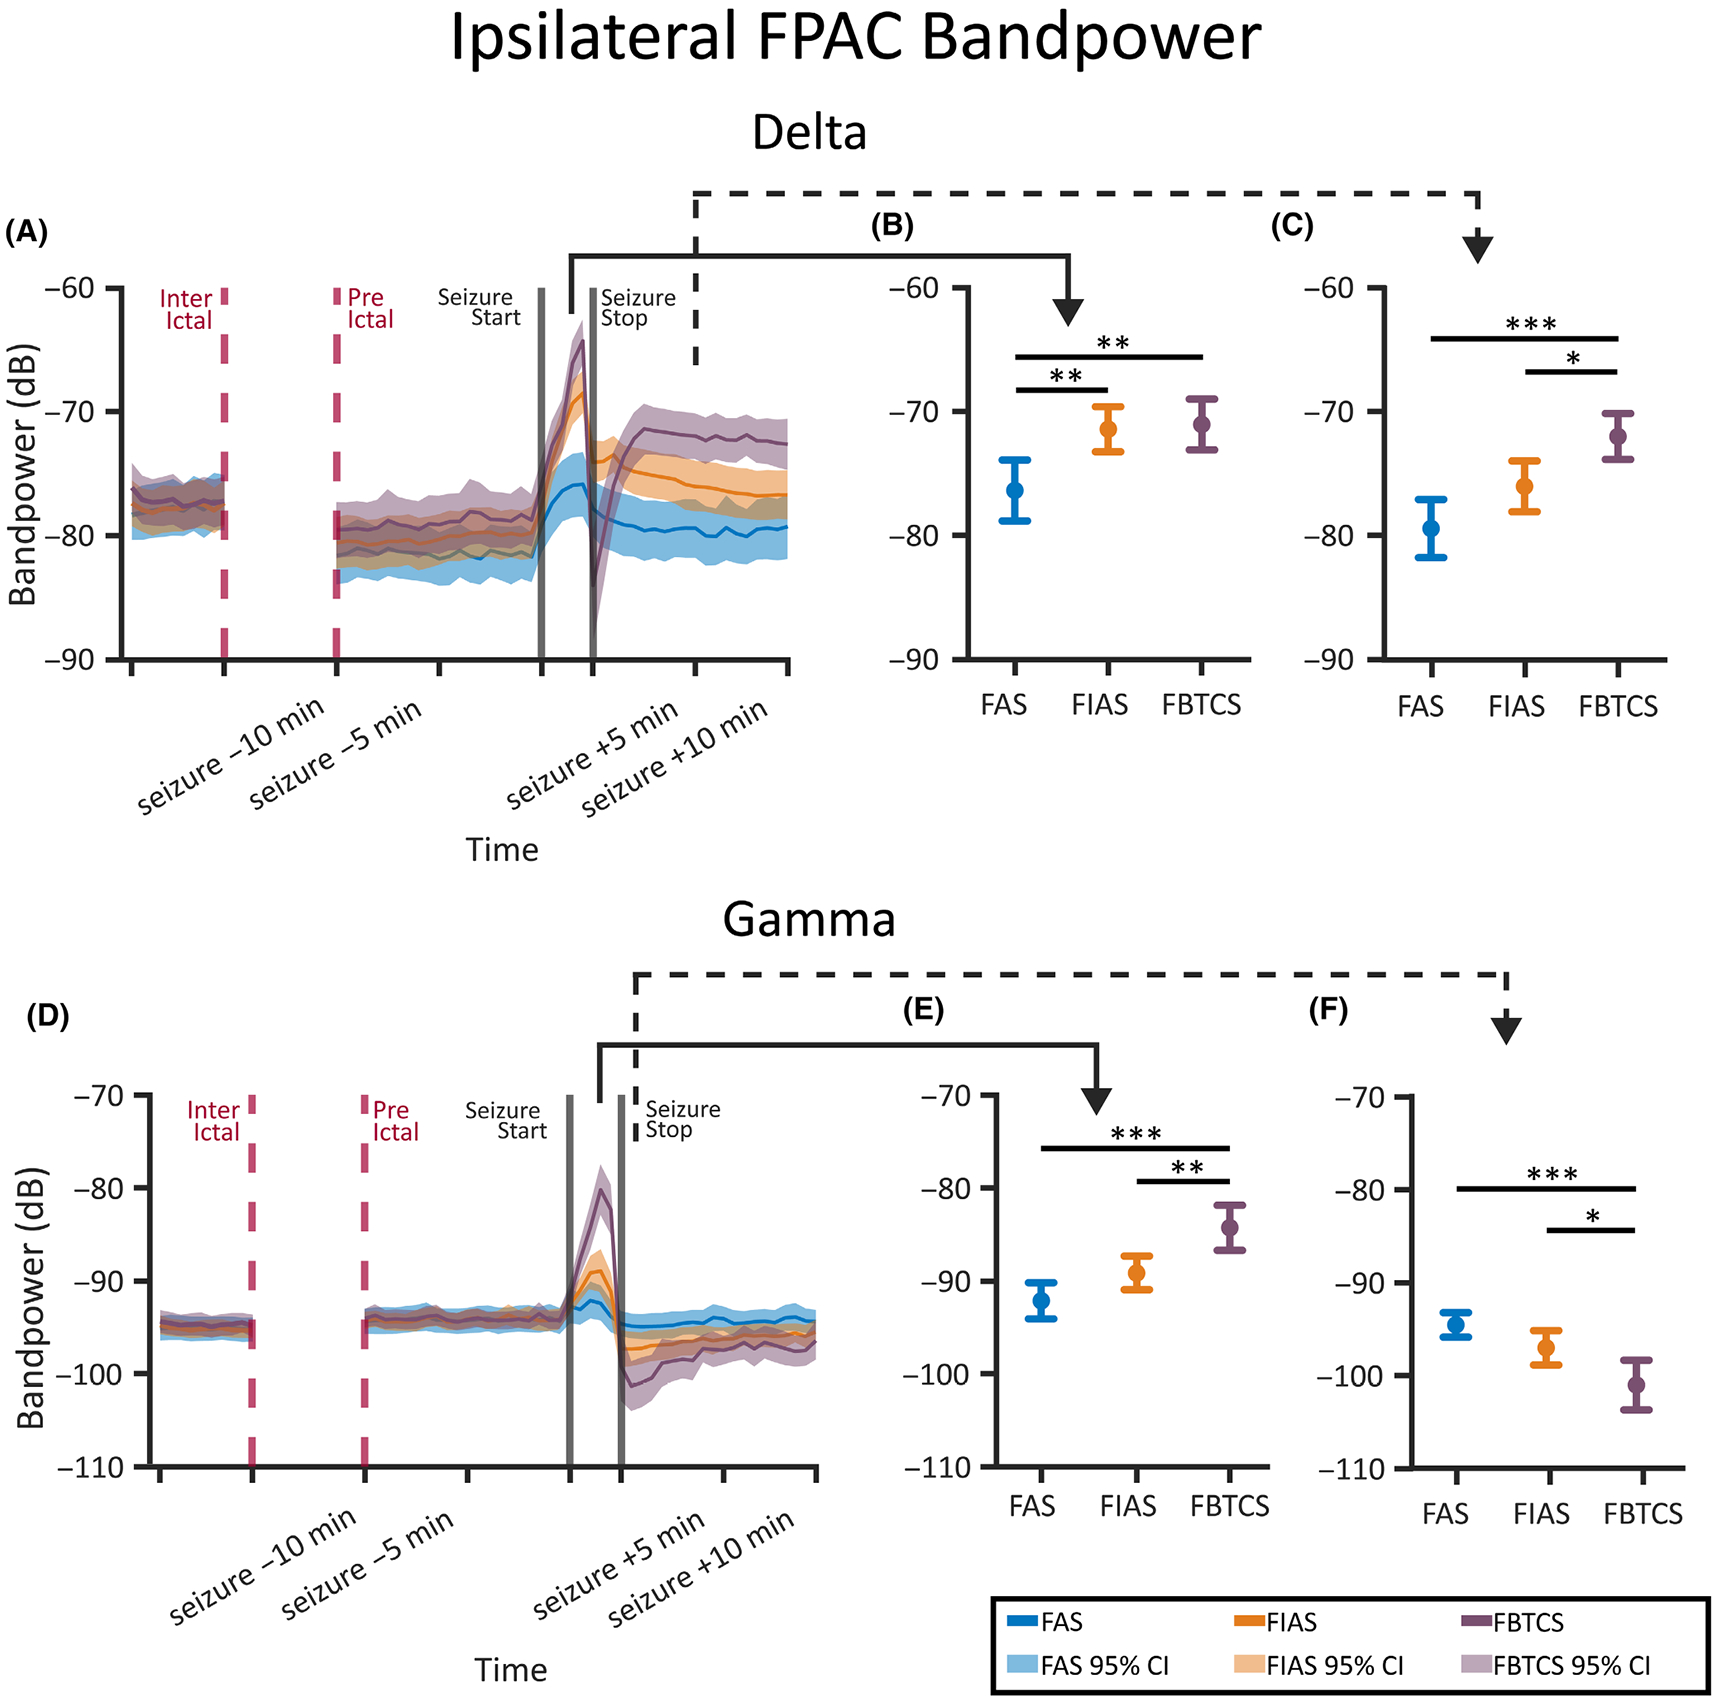
Results: We found that in the frontoparietal association cortex, an area associated with consciousness, both consciousness-impairing seizures (FIASs and FBTCSs) and deep sleep had increases in slow wave delta (1-4 Hz) band power. However, when network measures were employed, we found that only FIASs and deep sleep exhibited an increase in delta segregation and a decrease in gamma segregation. Furthermore, we found that only patients with FIASs had reduced subcortical-to-neocortical functional connectivity with fMRI versus controls. Finally, our deep learning network demonstrated an area under the curve of .75 for detecting consciousness-impairing seizures.

Significance: This study provides novel insights into ictal network measures in FASs, FIASs, and FBTCSs. Importantly, although both FIASs and FBTCSs result in loss of consciousness, our results suggest that ictal network changes in FIASs uniquely resemble those that occur during deep sleep. Our results may inform novel neuromodulation strategies for preservation of consciousness in epilepsy.

Keywords: consciousness‐impairing seizures; focal epilepsy; functional connectivity; network analysis of epilepsy; stereoelectroencephalography.


Conflict of interest statement

CONFLICT OF INTEREST STATEMENT

None of the authors has any conflict of interest to disclose. We confirm that we have read the Journal's position on issues involved in ethical publication and affirm that this report is consistent with those guidelines.

Figures

FIGURE 1
FIGURE 1
All consciousness-impairing seizure types have elevations in delta band power, but only focal to bilateral tonic–clonic seizures (FBTCSs) have elevations in gamma band power. Delta (1–4 Hz) band power is shown in the top panels (A–C), and gamma (31–80 Hz) band power is shown in the bottom panels (D–F). (A, D) Band power of the entire interictal, preictal, ictal, and postictal period is shown on the left. (B, E) Band power during the middle of the ictal period is shown in the center. (C, F) Band power during selected portions of the postictal period is shown on the right. Means are displayed in solid colors, and 95% confidence intervals (CIs) of the mean are displayed in transparent colors. Ictal delta band power was different across seizure types and can be seen in panel B (p < .001, one-way analysis of variance [ANOVA]). Ictal gamma band power was different across seizure types and can be seen in panel E (p < .0001, one-way ANOVA). Postictal delta band power differed across seizure types, with focal aware seizures (FASs) remaining stable, focal impaired awareness seizures (FIASs) returning to baseline, and FBTCSs remaining elevated. This comparison at 5 min after seizure onset can be seen in panel C (p < .0001). Postictal gamma band power exhibited the opposite trend from what was seen ictally but began to return to baseline for all seizure types. It was different across seizure types 30 s after seizure offset, as seen in panel F (p < .0001). Correction for multiple comparisons for the ANOVAs was completed with the Bonferroni–Holm method. If significance was found in the ANOVA, we completed a post hoc between-group comparison with two-sample t-tests. These were corrected with multiple comparisons using the Tukey–Kramer method implemented in MATLAB. *p < .05, **p < .01, ***p < .001. FPAC, frontoparietal association cortex.
FIGURE 2
FIGURE 2
The anatomical pattern of band power and connectivity changes differed between consciousness-impairing seizure types. Band power values (A, B) and nondirected functional connectivity values (C, D) are shown in varying colors. Delta (1–4 Hz) band power is shown in panel A, and delta connectivity is shown in panel C. Gamma (31–80 Hz) band power is shown in panel B, and gamma connectivity is shown in panel D. Each network is represented with a node whose labeling can be seen at the top left. The within-network functional connectivity values and band power values are shown with varying colors on each node. The between-network functional connectivity values are shown with varying colors on each edge. Within-network functional connectivity is defined as average functional connectivity between bipole pairs in the same network; between-network functional connectivity is defined as average functional connectivity between bipole pairs in both networks. Connectivity values were computed during the center of the ictal phase. Connectivity values are z-scored to each patient's interictal state. (A) Both focal impaired awareness seizures (FIASs) and focal to bilateral tonic–clonic seizures (FBTCSs) had bilateral and widespread increases in delta band power; however, this was not observed in focal aware seizures (FASs). (B) Additionally, the ipsilateral mesial temporal cortex showed increases in gamma band power across all seizure types, but widespread and bilateral increases in gamma band power were only observed in FBTCSs. (C, D) The greatest contrast between delta and gamma frontotemporal connectivity was seen during FIASs. FPAC, frontoparietal association cortex.
FIGURE 3
FIGURE 3
Focal impaired awareness seizures (FIASs) were associated with a unique pattern of increased segregation in the delta band and decreased segregation in the gamma band. Delta (1–4 Hz) segregation is shown in the top panels (A–C), and gamma (31–80 Hz) segregation is shown in the bottom panels (D–F). Segregation of the entire interictal, preictal, ictal, and postictal period is shown on the left (A, D). Segregation during the middle of the ictal period is shown in the middle (B, E). Segregation during selected portions of the postictal period is shown on the right (C, F). Means are displayed in solid colors, and 95% confidence intervals (CIs) of the mean are displayed in transparent colors. Ictal delta segregation was different across seizure types (p = .008, one-way analysis of variance [ANOVA]). Ictal gamma segregation was different across seizure types (p = .002, one-way ANOVA). Postictal delta band segregation was different across seizure types at 2 min after seizure offset, with focal to bilateral tonic–clonic seizures (FBTCSs) exhibiting the highest segregation (p < .0001). Postictal gamma band segregation was different across seizure types 5 min after seizure offset, with FBTCSs exhibiting the lowest segregation (p < .0001). Correction for multiple comparisons for the ANOVAs was completed with the Bonferroni–Holm method. If significance was found in the ANOVA, we completed a post hoc between-group comparison with two-sample t-tests. These were corrected with multiple comparisons using the Tukey–Kramer method implemented in MATLAB. *p < .05, **p < .01, ***p < .001. FAS, focal aware seizure; FPAC, frontoparietal association cortex.
FIGURE 4
FIGURE 4
Consciousness-impairing seizures had similar delta band power but not gamma band power changes to deep sleep. (A) Delta (1–4 Hz) band power was different across seizure types (p < .001, one-way analysis of variance [ANOVA]), with focal impaired awareness seizures (FIASs) and focal to bilateral tonic–clonic seizures (FBTCSs) increased compared to focal aware seizures (FASs) in a post hoc multiple comparison. (B) Delta band power was also different across sleep stages (p < .001), with deep sleep increased compared to both rapid eye movement (REM) and awake states. (C) Gamma (31–80 Hz) band power was different between seizure types (p < .001), with FBTCSs decreased compared to FASs and FIASs. (D) Gamma band power was not different between sleep stages (p = .295). Panels A and C are sections from Figure 1 and are included in this figure for ease of comparison. Means are displayed in solid circles, and 95% confidence intervals of the mean are displayed with the error bars. Correction for multiple comparisons for the ANOVAs was completed with the Bonferroni–Holm method. If significance was found in the ANOVA, we completed a post hoc between-group comparison with two-sample t-tests. These were corrected with multiple comparisons using the Tukey–Kramer method implemented in MATLAB. **p < .01, ***p < .001. FPAC, frontoparietal association cortex.
FIGURE 5
FIGURE 5
Focal impaired awareness seizures (FIASs) had similar delta and gamma segregation changes to those observed in deep sleep. (A) Delta band (1–4 Hz) segregation was different across seizure types (p = .008, one-way analysis of variance [ANOVA]), with FIASs increased compared to focal aware seizures (FASs) in a post hoc multiple comparison. (B) Delta band segregation was also different across sleep stages (p = .002), with deep sleep increased compared to both rapid eye movement (REM) and awake states. (C) Gamma band (31–80 Hz) segregation was different between seizure types (p = .002), with FIASs decreased compared to FASs and focal to bilateral tonic–clonic seizures (FBTCSs). (D) Gamma band segregation was different between sleep stages (p < .001), with deep sleep decreased compared to REM and awake states. Panels A and C are sections from Figure 3 and are included in this figure for ease of comparison. Means are displayed in solid circles, and 95% confidence intervals of the mean are displayed with the error bars. Correction for multiple comparisons for the ANOVAs was completed with the Bonferroni–Holm method. If significance was found in the ANOVA, we completed a post hoc between-group comparison with two-sample t-tests. These were corrected with multiple comparisons using the Tukey–Kramer method implemented in MATLAB. *p < .05, **p < .01, ***p < .001. FPAC, frontoparietal association cortex.

References

    1. Beghi E. The epidemiology of epilepsy. Neuroepidemiology. 2020;54(2):185–91. 10.1159/000503831 - DOI - PubMed
    1. Fisher RS. The new classification of seizures by the international league against epilepsy 2017. Curr Neurol Neurosci Rep. 2017;17:1–6. - PubMed
    1. Blumenfeld H. Impaired consciousness in epilepsy. Lancet Neurol. 2012;11(9):814–26. - PMC - PubMed
    1. Laureys S, Gosseries O, Tononi G. The neurology of consciousness: cognitive neuroscience and neuropathology. Cambridge, Massachusettes: Academic Press; 2015.
    1. Norden AD, Blumenfeld H. The role of subcortical structures in human epilepsy. Epilepsy Behav. 2002;3(3):219–31. 10.1016/S1525-5050(02)00029-X - DOI - PubMed