Review
. 2024 Jun 28;14(7):324.
doi: 10.3390/bios14070324.

Correlative Raman Imaging: Development and Cancer Applications

Affiliations
Review

Correlative Raman Imaging: Development and Cancer Applications

Hossein Khadem et al. Biosensors (Basel). .

Abstract

Despite extensive research efforts, cancer continues to stand as one of the leading causes of death on a global scale. To gain profound insights into the intricate mechanisms underlying cancer onset and progression, it is imperative to possess methodologies that allow the study of cancer cells at the single-cell level, focusing on critical parameters such as cell morphology, metabolism, and molecular characteristics. These insights are essential for effectively discerning between healthy and cancerous cells and comprehending tumoral progression. Recent advancements in microscopy techniques have significantly advanced the study of cancer cells, with Raman microspectroscopy (RM) emerging as a particularly powerful tool. Indeed, RM can provide both biochemical and spatial details at the single-cell level without the need for labels or causing disruptions to cell integrity. Moreover, RM can be correlated with other microscopy techniques, creating a synergy that offers a spectrum of complementary insights into cancer cell morphology and biology. This review aims to explore the correlation between RM and other microscopy techniques such as confocal fluoresce microscopy (CFM), atomic force microscopy (AFM), digital holography microscopy (DHM), and mass spectrometry imaging (MSI). Each of these techniques has their own strengths, providing different perspectives and parameters about cancer cell features. The correlation between information from these various analysis methods is a valuable tool for physicians and researchers, aiding in the comprehension of cancer cell morphology and biology, unraveling mechanisms underlying cancer progression, and facilitating the development of early diagnosis and/or monitoring cancer progression.

Keywords: Raman imaging; Raman spectroscopy; atomic force microscopy; cancer; correlative imaging; digital holography microscopy; fluorescence microscopy; mass spectroscopy imaging; quantitative phase imaging.


Conflict of interest statement

The authors declare no conflicts of interest.

Figures

Figure 5
Figure 5
Experimental workflow for correlative Raman–MALDI imaging. A fresh-frozen tissue section is cryo-sectioned and thaw-mounted onto a conductive indium tin oxide (ITO) microscopy slide. This is followed by MALDI matrix application by spraying 1,5-diaminonaphthalene (DAN) onto the tissue section. The prepared tissue section is first utilized for Raman imaging, and then the same sample is subjected to MALDI MSI measurement. Reprinted (adapted) with permission from Ref. [82], Copyright 2023 Elsevier.
Figure 1
Figure 1
(a) Chemical structures of the NpCN1 and DC473 molecules. (b) CFM image and (c) Raman false-color image of 3T3-L1 cells treated with NpCN1, (d) CFM image, and (e) Raman false-color image of SW480 cells incubated with DC473. Reprinted (adapted) with permission from Ref. [37], Copyright 2021 MDPI, and from Ref. [38], Copyright 2018 Royal Society of Chemistry.
Figure 2
Figure 2
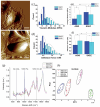
AFM images of living (a) human lung adenocarcinoma epithelial cell line A549 (b) non-cancerous human primary small airway epithelial cells (SAECs). Cells were imaged in culture media under physiological conditions. Scale bar: 10 mm. Histograms of (c) Young’s modulus and (d) adhesion force distributions of A549 cells and SAECs. Data are expressed as mean ± SD. Comparison of (e) Young’s modulus and (f) adhesion force of A549 cells and SAEC control groups and doxorubicin (70 nM, 4 h) treated groups. Values represent the mean ± SD (bar) of multiple cells. * p < 0.05, ** p < 0.01. (g) Average Raman spectra and (h) principal component analysis (PCA) of A549 cells and SAECs for the nucleus area of control and doxorubicin treatment (70 nM, 4 h) groups (n = 32). Reprinted (adapted) with permission from Ref. [51], Copyright 2013 Royal Society of Chemistry.
Figure 3
Figure 3
(a) Bright field optical microscopy image, (b) Raman image (red: proteins; blue: lipids), fluorescence images of (c) Hoechst 33342 and (d) Oil Red O of a living U-87 MG cell, (e) adhesion image, (f) stiffness image, and (g) topography image of an air-dried cell. Reprinted (adapted) with permission from Ref. [35], Copyright 2019 Future Medicine Ltd, London, UK.
Figure 4
Figure 4
(a) Combined Raman and polarization-sensitive digital holographic imaging (PSDHI) experimental setup, (b) bright field image of the HepG2 cell, (c) Raman map of the C-D band signal, and (d) reconstructed false color Raman image using the DNA Raman bands at 2956 cm−1 and 785 cm−1 for the nucleus (blue signal), the protein bands at 2930 cm−1 and 1100 cm−1 for the cytosol (red signal) and C-D bands at 2120 cm−1 for the lipid droplets (green signal), (e) Phase difference; and (f) the corresponding phase difference gradient maps retrieved by PSDHI, (g) Merged image of the Raman map of the C-D band signals and the phase difference map by PSDHI maps, assessing the co-localization of the C-D signal of the lipid droplets and the state of polarization variation. Scale bar:10 μm. Reprinted (adapted) with permission from Ref. [26], Copyright 2023 Frontiers in Bioengineering and Biotechnology.

References

    1. Bray F., Laversanne M., Sung H., Ferlay J., Siegel R.L., Soerjomataram I., Jemal A. Global Cancer Statistics 2022: GLOBOCAN Estimates of Incidence and Mortality Worldwide for 36 Cancers in 185 Countries. CA Cancer J. Clin. 2024;74:229–263. doi: 10.3322/caac.21834. - DOI - PubMed
    1. Chen S., Jiang W., Du Y., Yang M., Pan Y., Li H., Cui M. Single-Cell Analysis Technologies for Cancer Research: From Tumor-Specific Single Cell Discovery to Cancer Therapy. Front. Genet. 2023;14:1276959. doi: 10.3389/fgene.2023.1276959. - DOI - PMC - PubMed
    1. Stender A.S., Marchuk K., Liu C., Sander S., Meyer M.W., Smith E.A., Neupane B., Wang G., Li J., Cheng J.-X., et al. Single Cell Optical Imaging and Spectroscopy. Chem. Rev. 2013;113:2469–2527. doi: 10.1021/cr300336e. - DOI - PMC - PubMed
    1. Sutton E.J., Henning T.D., Pichler B.J., Bremer C., Daldrup-Link H.E. Cell Tracking with Optical Imaging. Eur. Radiol. 2008;18:2021–2032. doi: 10.1007/s00330-008-0984-z. - DOI - PubMed
    1. Georgakoudi I., Quinn K.P. Optical Imaging Using Endogenous Contrast to Assess Metabolic State. Annu. Rev. Biomed. Eng. 2012;14:351–367. doi: 10.1146/annurev-bioeng-071811-150108. - DOI - PubMed

LinkOut - more resources