. 2024 Jul 16;13(14):1204.
doi: 10.3390/cells13141204.

Single-Nucleotide Polymorphisms of TAS2R46 Affect the Receptor Downstream Calcium Regulation in Histamine-Challenged Cells

Affiliations

Single-Nucleotide Polymorphisms of TAS2R46 Affect the Receptor Downstream Calcium Regulation in Histamine-Challenged Cells

Giulia Lecchi et al. Cells. .

Abstract

Bitter taste receptors (TAS2Rs) expressed in extraoral tissues represent a whole-body sensory system, whose role and mechanisms could be of interest for the identification of new therapeutic targets. It is known that TAS2R46s in pre-contracted airway smooth muscle cells increase mitochondrial calcium uptake, leading to bronchodilation, and that several SNPs have been identified in its gene sequence. There are very few reports on the structure-function analysis of TAS2Rs. Thus, we delved into the subject by using mutagenesis and in silico studies. We generated a cellular model that expresses native TAS2R46 to evaluate the influence of the four most common SNPs on calcium fluxes following the activation of the receptor by its specific ligand absinthin. Then, docking studies were conducted to correlate the calcium flux results to the structural mutation. The analysed SNPs differently modulate the TAS2R46 signal cascade according to the altered protein domain. In particular, the SNP in the sixth transmembrane domain of the receptors did not modulate calcium homeostasis, while the SNPs in the sequence coding for the fourth transmembrane domain completely abolished the mitochondrial calcium uptake. In conclusion, these results indicate the fourth transmembrane domain of TAS2R46 is critical for the intrinsic receptor activity.

Keywords: SNPs; TAS2R; bitter taste receptor; calcium signalling; polymorphism.


Conflict of interest statement

The authors declare no conflicts of interest.

Figures

Figure 1
Figure 1
Schematic representation of the amino acid sequence of TAS2R46 with the SNPs considered in this study being highlighted. Snake plot representation of amino acid residues. TAS2R46 consists of a short N terminus (NH2), seven transmembrane domains (TM1-7), three extracellular loops, three intracellular loops, and a short C terminus (COOH). SNPs considered in the present study are marked by coloured circles: rs200939852 (V141A) in green; rs72477411 (I147L) in orange; rs72477410 (I153V) in red; rs2708381 (W250L) in purple.
Figure 2
Figure 2
Cytosolic and mitochondrial Ca2+ analysis in HeLa cells expressing naive TAS2R46. Fura-2AM- and Rhod-2AM-loaded cells were stimulated with 10 μM of histamine (Hist) and 10 μM of absinthin (Abs) alone or combined. All data are illustrated as representative traces as well as histograms of the maximum peak (inset). (A) Cytosolic calcium transient in TAS2R46-expressing HeLa cells. Abs n = 33, Hist n = 31, and Abs+Hist n = 55 cells of 3 independent experiments. (B) Mitochondrial calcium analysis in TAS2R46-expressing HeLa cells. Abs n = 30 and Hist n = 59 cells of 3 independent experiments; Abs+Hist n = 134 cells of 4 independent experiments. Statistical analysis: Mann–Whitney U test; ** p < 0.01 and **** p < 0.0001 vs. Hist.
Figure 3
Figure 3
Cytosolic and mitochondrial Ca2+ analysis in HeLa cells expressing W250L-TAS2R46. Fura-2AM- and Rhod-2AM-loaded cells were stimulated with 10 μM of histamine (Hist) and 10 μM of absinthin (Abs) alone or combined. All data are illustrated as representative traces as well as histograms of the maximum peak (inset). (A) Cytosolic calcium transient in rs2708381 TAS2R46-expressing HeLa cells. Abs n = 28, Hist n = 51, and Abs+Hist n = 73 cells of 3 independent experiments. (B) Mitochondrial calcium analysis in rs2708381 TAS2R46-expressing HeLa cells. Abs n = 24, Hist n = 26, and Abs+Hist n = 26 cells of 3 independent experiments. Statistical analysis: Mann–Whitney U test; * p < 0.05 and ** p < 0.01 vs. Hist.
Figure 4
Figure 4
Cytosolic and mitochondrial Ca2+ analysis HeLa cells expressing I153V-, I147V-, and V141A-TAS2R46. Fura-2AM- and Rhod-2AM-loaded cells were stimulated with 10 μM of histamine (Hist) and 10 μM of absinthin (Abs) alone or combined. All data are illustrated as representative traces as well as histograms of the maximum peak (inset). (A) Cytosolic calcium transient in I153V-HeLa cells. Abs n = 47 cells of 3 independent experiments; Hist n = 81 and Abs+Hist n = 114 cells of 4 independent experiments. (B) Mitochondrial calcium analysis in I153V-HeLa cells. Abs n = 18, Hist n = 41, and Abs+Hist n = 29 cells of 3 independent experiments. (C) Cytosolic calcium transient in I147V-HeLa cells. Abs n = 46, Hist n = 38, and Abs+Hist n = 57 cells of 3 independent experiments. (D) Mitochondrial calcium analysis in I147V-HeLa cells. Abs n = 27, Hist n = 31, and Abs+Hist n = 48 cells of 3 independent experiments. (E) Cytosolic calcium transient in V141A-HeLa cells. Abs n = 38, Hist n = 36, and Abs+Hist n = 55 cells of 3 independent experiments. (F) Mitochondrial calcium analysis in V141A-HeLa cells. Abs n = 40, Hist n = 46, Abs+Hist n = 39 cells of 3 independent experiments. Statistical analysis: Mann–Whitney U test; ** p < 0.01 and **** p < 0.0001 vs. Hist.
Figure 4
Figure 4
Cytosolic and mitochondrial Ca2+ analysis HeLa cells expressing I153V-, I147V-, and V141A-TAS2R46. Fura-2AM- and Rhod-2AM-loaded cells were stimulated with 10 μM of histamine (Hist) and 10 μM of absinthin (Abs) alone or combined. All data are illustrated as representative traces as well as histograms of the maximum peak (inset). (A) Cytosolic calcium transient in I153V-HeLa cells. Abs n = 47 cells of 3 independent experiments; Hist n = 81 and Abs+Hist n = 114 cells of 4 independent experiments. (B) Mitochondrial calcium analysis in I153V-HeLa cells. Abs n = 18, Hist n = 41, and Abs+Hist n = 29 cells of 3 independent experiments. (C) Cytosolic calcium transient in I147V-HeLa cells. Abs n = 46, Hist n = 38, and Abs+Hist n = 57 cells of 3 independent experiments. (D) Mitochondrial calcium analysis in I147V-HeLa cells. Abs n = 27, Hist n = 31, and Abs+Hist n = 48 cells of 3 independent experiments. (E) Cytosolic calcium transient in V141A-HeLa cells. Abs n = 38, Hist n = 36, and Abs+Hist n = 55 cells of 3 independent experiments. (F) Mitochondrial calcium analysis in V141A-HeLa cells. Abs n = 40, Hist n = 46, Abs+Hist n = 39 cells of 3 independent experiments. Statistical analysis: Mann–Whitney U test; ** p < 0.01 and **** p < 0.0001 vs. Hist.
Figure 5
Figure 5
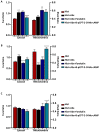
EPAC activation in HeLa cells expressing I153V-, I147V-, and V141A-TAS2R46. Fura-2AM- and Rhod-2AM-loaded cells were stimulated with 10 μM of histamine (Hist), 10 μM of absinthin (Abs), 10 μM of forskolin, and 10 μM of 8-pCPT-2-O-Me-cAMP. All data are illustrated as histograms showing the mean ± SEM of the maximum peak. (A) Cytosolic (Hist n = 219 cells; Hist+Abs n = 250; Hist+Abs+Forsk n = 175; Hist+Abs+8-pCPT-2-O-Me-cAMP n = 145) and mitochondrial (Hist n = 110 cells; Hist+Abs n = 109; Hist+Abs+Forsk n = 102; Hist+Abs+8-pCPT-2-O-Me-cAMP n = 133) calcium transient in I153V-HeLa cells. (B) Cytosolic (Hist n = 271 cells; Hist+Abs n = 219; Hist+Abs+Forsk n = 154; Hist+Abs+8-pCPT-2-O-Me-cAMP n = 254) and mitochondrial (Hist n = 71 cells; Hist+Abs n = 123; Hist+Abs+Forsk n = 59; Hist+Abs+8-pCPT-2-O-Me-cAMP n = 45) calcium transient in I147V-HeLa cells. (C) Cytosolic (Hist n = 336 cells; Hist+Abs n = 328; Hist+Abs+Forsk n = 281; Hist+Abs+8-pCPT-2-O-Me-cAMP n = 323) and mitochondrial (Hist n = 246 cells; Hist+Abs n = 204; Hist+Abs+Forsk n = 90; Hist+Abs+8-pCPT-2-O-Me-cAMP n = 205) calcium transient in V141A-HeLa cells. Statistical analysis: Mann–Whitney U test; °°°° p < 0.0001 vs. Hist; * p < 0.05, ** p < 0.01, and **** p < 0.0001 vs. Hist+Abs.
Figure 6
Figure 6
Structural comparison of the TAS2R46 model structure with 7XP6. The rust-red colour denotes the 7XP6 structure (Cryo_EM) and the sap-green colour denotes the modelled structure of TAS2R46.
Figure 7
Figure 7
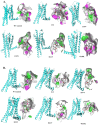
Structural analysis—Orthosteric site. (A) Modelled TAS2R46; (B) 7XP6: TAS2R46. WT control: structural analysis between the WT receptor and strychnine; WT, I147V, I153V, I141V, and W250L: structural analysis between TAS2R46 and absinthin. The binding interactions between the wild type and the mutant TAS2R46 proteins are presented as follows: the receptor is presented by secondary type while the ligand is shown in ball & stick. The interacting residues are presented in cloud form and depicted side-by-side.
Figure 8
Figure 8
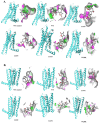
Structural analysis—Vestibular site. (A) Modelled TAS2R46; (B) 7XP6: TAS2R46. WT control: structural analysis between the WT receptor and strychnine; WT, I147V, I153V, I141V, and W250L: structural analysis between TAS2R46 and absinthin. The binding interactions between the wild type and the mutant TAS2R46 proteins are presented as follows: the receptor is presented by secondary type while the ligand is shown in ball & stick. The interacting residues are presented in cloud form and depicted side-by-side.

References

    1. Lush I.E., Hornigold N., King P., Stoye J.P. The Genetics of Tasting in Mice VII. Glycine Revisited, and the Chromosomal Location of Sac and Soa. Genet. Res. 1995;66:167–174. doi: 10.1017/S0016672300034510. - DOI - PubMed
    1. Adler E., Hoon M.A., Mueller K.L., Chandrashekar J., Ryba N.J.P., Zuker C.S. A Novel Family of Mammalian Taste Receptors. Cell. 2000;100:693–702. doi: 10.1016/S0092-8674(00)80705-9. - DOI - PubMed
    1. Bachmanov A.A., Beauchamp G.K. Taste Receptor Genes. Annu. Rev. Nutr. 2007;27:389–414. doi: 10.1146/annurev.nutr.26.061505.111329. - DOI - PMC - PubMed
    1. Wooding S.P., Ramirez V.A., Behrens M. Bitter Taste Receptors. Evol. Med. Public Health. 2021;9:431–447. doi: 10.1093/emph/eoab031. - DOI - PMC - PubMed
    1. Talmon M., Pollastro F., Fresu L.G. The Complex Journey of the Calcium Regulation Downstream of TAS2R Activation. Cells. 2022;11:3638. doi: 10.3390/cells11223638. - DOI - PMC - PubMed

Publication types

MeSH terms

LinkOut - more resources