. 2024 Jul 19;13(14):1220.
doi: 10.3390/cells13141220.

1H and 31P Magnetic Resonance Spectroscopic Metabolomic Imaging: Assessing Mitogen-Activated Protein Kinase Inhibition in Melanoma

Affiliations

1H and 31P Magnetic Resonance Spectroscopic Metabolomic Imaging: Assessing Mitogen-Activated Protein Kinase Inhibition in Melanoma

Pradeep Kumar Gupta et al. Cells. .

Abstract

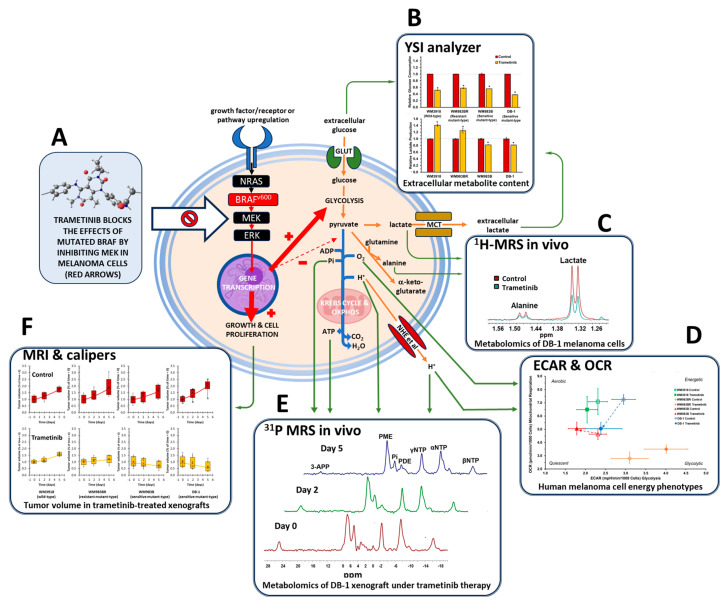
The MAPK signaling pathway with BRAF mutations has been shown to drive the pathogenesis of 40-60% of melanomas. Inhibitors of this pathway's BRAF and MEK components are currently used to treat these malignancies. However, responses to these treatments are not always successful. Therefore, identifying noninvasive biomarkers to predict treatment responses is essential for personalized medicine in melanoma. Using noninvasive 1H magnetic resonance spectroscopy (1H MRS), we previously showed that BRAF inhibition reduces lactate and alanine tumor levels in the early stages of effective therapy and could be considered as metabolic imaging biomarkers for drug response. The present work demonstrates that these metabolic changes observed by 1H MRS and those assessed by 31P MRS are also found in preclinical human melanoma models treated with MEK inhibitors. Apart from 1H and 31P MRS, additional supporting in vitro biochemical analyses are described. Our results indicate significant early metabolic correlations with response levels to MEK inhibition in the melanoma models and are consistent with our previous study of BRAF inhibition. Given these results, our study supports the potential clinical utility of noninvasive MRS to objectively image metabolic biomarkers for the early prediction of melanoma's response to MEK inhibition.

Keywords: 1H/31P magnetic resonance spectroscopy; extracellular acidification rate; glucose uptake; lactate production; melanoma; oxygen consumption rate; trametinib.


Conflict of interest statement

The author Fernando Arias-Mendoza is employed by Advanced Imaging Research, Inc. The remaining authors declare that this research was conducted without commercial or financial relationships that could be construed as potential conflicts of interest.

Figures

Figure 1
Figure 1
Schematic representation of the metabolomics research in human melanoma models treated with trametinib. The red arrows highlight the effects of the mutated BRAF protein (i.e., increased growth and cell proliferation, increased glycolysis, and reduced pyruvate oxidation). Trametinib (structure in (A); from istrockphoto.com, accessed on 18 June 2024) exerts its effect, inhibiting MEK and, thus, blocking the mutated BRAF effects (white block arrow). Mutated BRAF enhances the metabolic pathways highlighted with orange arrows, while those inhibited are shown with blue arrows. The green arrows indicate the procedures for determining the highlighted metabolites or cellular processes (Figure 2, Figure 3, Figure 4, Figure 5, Figure 6 and Figure 7). In summary, we measured extracellular glucose and lactate levels (B), intracellular lactate and alanine levels via noninvasive 1H MRS (C), the effect of trametinib on the extracellular acidification rate (ECAR), and oxygen consumption rate (OCR; (D)), bioenergetic parameters and intra- and extracellular pH via noninvasive 31P MRS (E), and tumor growth (F). An asterisk (*) indicates a statistically significant difference (p < 0.05) between control (n = 3) and trametinib-treated (n = 3) groups.
Figure 2
Figure 2
Extracellular glucose consumption (A) and lactate production (B) were measured in the four cultured melanoma cell lines in the absence (control) or presence of trametinib (7 nmol/L) for 48 h. Relative values (y-axes) were obtained by dividing the extracellular metabolite content by the number of cells. Error bars denote standard deviation (SD). An asterisk (*) indicates a statistically significant difference (p < 0.05) between control (n = 3) and trametinib-treated (n = 3) groups. The dashed line indicates the relative values of the controls.
Figure 3
Figure 3
Effect of trametinib treatment on OCR and ECAR of cultured melanoma cells. The graph shows the four melanoma cell lines’ OCR vs. ECAR under basal conditions. Open symbols represent untreated cells, while solid symbols represent trametinib-treated cells. The dashed arrows designate cell lines with statistically significant shifts in their OCR/ECAR ratio (Table 1), which indicates different cell energy phenotypes and shows shifts in the preference of energy pathways for each cell line under trametinib.
Figure 4
Figure 4
In vitro 1H MRS of human melanoma cell lines. (A) Representative high-resolution 1H MRS spectra depicting alanine and lactate in the four cell lines are illustrated. Control spectra are displayed in red, while trametinib-treated spectra are shown in green. (B) Mean values ± SD (n = 3) of the intracellular lactate and alanine concentrations were determined by integrating their 1H MRS signals in (A) and normalized by the trimethylsilyl propanoic acid (TSP) content protons to obtain mM/cell concentrations. Asterisks (*) denote a statistically significant difference (p < 0.05) between the control values of lactate or alanine in the WM3918 cell line (in red) and the control values in the other three cell lines. The p-values on top of the trametinib-treated data (in yellow) demonstrate the statistical significance in the trametinib-related reduction vs. its control value.
Figure 5
Figure 5
In vivo localized 1H MRS results. (A) Localizer tumor images for noninvasive 1H MR spectra were acquired using the Hadamard-selective MQC transfer pulse sequence to measure lactate and alanine. The spectra at Day 0 (red), Day 2 (green), and Day 5 (blue) of trametinib therapy in each xenograft model are shown from bottom to top. Box-and-whiskers plots of time-related in vivo changes are shown in (B) for tumor lactate and (C) for alanine in mouse xenografts of each cell line. At the top of (B,C), in red, the box plots show the lactate and alanine changes in the untreated (control) groups, while at the bottom, in yellow, the lactate and alanine changes in the trametinib-treated mice are shown. The p-values in (B,C) denote the statistical significance of the mean difference in lactate (B) and alanine (C) for the control vs. trametinib groups at each time point. The tables below (B,C) summarize the time-related analysis of each metabolite using linear regressions. The equations that describe the time course, the adjusted R2, and the significance of the regression are shown for the control (red) and trametinib time curves (yellow). The last row in both tables shows the statistical significance when the slopes of the control vs. trametinib are determined. Notation in red denotes the adjusted R2 < 0.2 (low) or p-values that are non-significant (N.S.).
Figure 6
Figure 6
In vivo localized 31P MRS results. (A) Localizer tumor images for noninvasive MR spectra were acquired using the ISIS pulse sequence of DB-1 human melanoma xenografts at Day 0 (red), Day 2 (green), and Day 5 (blue) of trametinib treatment. Peak assignments: 3-APP, 3-amino propylphosphonic acid; PME, phosphomonoesters; Pi, inorganic phosphate; PDE, phosphodiesters; NTP, the α, β, and γ 31P signals of nucleoside triphosphates. We determined the chemical shift differences between Pi and α-NTP and those of 3-APP and α-NTP to obtain the pH values of the intracellular (pHi) and extracellular compartments (pHe), respectively. The intensity variability of 3-APP shown is due to factors like animal weight and administration method, but does not interfere with the pHe measurements. (B) Box-and-whiskers plots of the time-related changes in the β-NTP/Pi ratio measured in the 31P MR spectra. In red, the top row of box plots depicts the data of untreated mice set apart by the xenografted cell line, while on the bottom row of box plots, in yellow, the trametinib-treated results are shown. The p-value of the mean comparison of the control vs. treated pair at each time point is shown in the graphs. Like in Figure 5, the bottom table in (B) summarizes the fitting analysis of the data to time-related linear regressions and the slope comparisons between control vs. trametinib-treated cells in each cell line. The pH values in the intracellular (C) and extracellular compartments (D) determined by 31P MRS in the four melanoma xenografts are also shown. Only valuable time-dependent data were obtained for pHi and pHe in the DB-1 xenografts: pHi during trametinib treatment (i.e., y = −0.021x + 6.9, adjusted R2 = 0.240, and regression’s p-value = 0.01), and pHe in the DB-1 controls (i.e., y = -0.020x + 7.0, adjusted R2 = 0.235, and regression’s p-value = 0.02). In addition, the comparison of the slopes for pHe of DB-1 between untreated (m = -0.020) and trametinib-treated cells (m = 0.010) was statistically significant (p = 0.02). Notation in red denotes the adjusted R2 < 0.2 (low) or p-values that are non-significant (N.S.).
Figure 7
Figure 7
Comparison of tumor growth on Day 0, Day 2, and Day 5 between untreated controls (red) and trametinib-treated xenografts (yellow). The p-values in the graphs denote the significance of comparing the controls vs. trametinib-treated pairs at specific times. The table shows the parameters related to the statistical analysis of the data as time-dependent changes. Non-significant (N.S.).

References

    1. Roesch A., Berking C. Melanoma. In: Plewig G., French L., Ruzicka T., Kaufmann R., Hertl M., editors. Braun-Falco’s Dermatology. Springer; Berlin/Heidelberg, Germany: 2022. pp. 1855–1871.
    1. Saginala K., Barsouk A., Aluru J.S., Rawla P., Barsouk A. Epidemiology of Melanoma. Med. Sci. 2021;9:63. doi: 10.3390/medsci9040063. - DOI - PMC - PubMed
    1. Davis L.E., Shalin S.C., Tackett A.J. Current state of melanoma diagnosis and treatment. Cancer Biol. Ther. 2019;20:1366–1379. doi: 10.1080/15384047.2019.1640032. - DOI - PMC - PubMed
    1. Sandru A., Voinea S., Panaitescu E., Blidaru A. Survival rates of patients with metastatic malignant melanoma. J. Med. Life. 2014;7:572–576. - PMC - PubMed
    1. Quaglino P., Fava P., Tonella L., Rubatto M., Ribero S., Fierro M.T. Treatment of Advanced Metastatic Melanoma. Dermatol. Pract. Concept. 2021;11:e2021164S. doi: 10.5826/dpc.11S1a164S. - DOI - PMC - PubMed

Publication types

MeSH terms

Substances

LinkOut - more resources