. 2024 Jul 4;46(7):7032-7047.
doi: 10.3390/cimb46070419.

Comparison of the Proteome of Huh7 Cells Transfected with Hepatitis B Virus Subgenotype A1, with or without G1862T

Affiliations

Comparison of the Proteome of Huh7 Cells Transfected with Hepatitis B Virus Subgenotype A1, with or without G1862T

Kiyasha Padarath et al. Curr Issues Mol Biol. .

Abstract

HBeAg is a non-structural, secreted protein of hepatitis B virus (HBV). Its p25 precursor is post-translationally modified in the endoplasmic reticulum. The G1862T precore mutation leads to the accumulation of P25 in the endoplasmic reticulum and activation of unfolded protein response. Using mass spectrometry, comparative proteome profiling of Huh-7 cells transfected with wildtype (WT) or G1862T revealed significantly differentially expressed proteins resulting in 12 dysregulated pathways unique to WT-transfected cells and 7 shared between cells transfected with either WT or G1862T. Except for the p38 MAPK signalling pathway, WT showed a higher number of DEPs than G1862T-transfected cells in all remaining six shared pathways. Two signalling pathways: oxidative stress and cell cycle signalling were differentially expressed only in cells transfected with G1862T. Fifteen pathways were dysregulated in G1862T-transfected cells compared to WT. The 15 dysregulated pathways were involved in the following processes: MAPK signalling, DNA synthesis and methylation, and extracellular matrix organization. Moreover, proteins involved in DNA synthesis signalling (replication protein A (RPA) and DNA primase (PRIM2)) were significantly upregulated in G1862T compared to WT. This upregulation was confirmed by mRNA quantification of both genes and immunofluorescent confocal microscopy for RPA only. The dysregulation of the pathways involved in these processes may lead to immune evasion, persistence, and uncontrolled proliferation, which are hallmarks of cancer.

Keywords: DNA primase (PRIM2); G1862T; HBV; p38 MAPK; replication protein A (RPA); subgenotype A1.


Conflict of interest statement

S.S. has a commercial interest in ReSyn Biosciences which supplied the magnetic microspheres used during mass spectrometry sample preparation. S.S. is also employed by Evosep Biosystems. The remaining authors declare that the research was conducted in the absence of any commercial or financial relationships that could be construed as a potential conflict of interest.

Figures
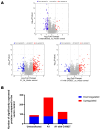
Figure 1
Figure 1
DEPs detection. (A) Volcano plots of the differentially expressed proteins, in Huh7 cells, transfected with replication-competent A1 with or without G1862T mutation and untransfected control against the vector-only control. Downregulated versus upregulated proteins are highlighted in blue and red, respectively. (B) A bar graph showing the number of significantly upregulated (red) and downregulated (blue) proteins in subgenotype A1, with and without the G1862T mutation and the untransfected compared to the vector control.
Figure 2
Figure 2
Proteomic analysis. (A) Venn diagram indicating the pathways associated with differentially expressed pathways between A1 with (yellow) and without (blue) the G1862T. Proteins were normalized against both the untransfected and vector control. (B) Proteomic analysis revealed significantly differently expressed proteins (p < 0.05) between the A1 with and without the G1862T. These differentially expressed proteins were further classified into pathways displayed in the table. Blue pathways are exclusively found in A1, grey pathways are shared between A1 with and without G1862T, and yellow pathways are exclusively found in A1 with G1862T. (C) Comparison table of the number of significantly differentially expressed proteins, amongst the common pathways between A1 with and without G1862T.
Figure 3
Figure 3
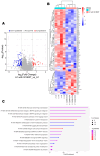
A1 with G1862T vs. A1 analysis. (A) Volcano plots of the differentially expressed proteins in Huh7 cells, transfected with replication-competent A1 with or without G1862T mutation. The negative x-axis represents downregulated (blue) in the A1 mutant, and the positive axis represents upregulated (red) proteins in the A1 mutant. (B) The heatmap showing the average log2 expression of the 92 significantly expressed proteins in G1862T compared to the WT. (C) A dot plot generated using the DEPs from image B in ShinyGO analysis, with Reactome pathway enrichment and fold enrichment, based on the number of genes present in each pathway. The FDR cut-off was set at 0.05, and the number of pathways was set to 10.
Figure 4
Figure 4
mRNA expression levels of DNA primase subunit 2 (PRIM2) and Replication Protein A (RPA) genes five days post-transfection. Results are expressed as a ratio between the mRNA expression of the DNA synthesis-associated proteins and GAPDH. Statistical analysis was performed using a one-way ANOVA statistical test (* = p-value < 0.05, ** = p-value < 0.01, *** = p-value < 0.001).
Figure 5
Figure 5
RPA expression using confocal microscopy. (A) Microscopy of transfected Huh7 cells with or without G1862T and untransfected cells after five days, viewed with a confocal microscope. Cells were immunostained with a polyclonal rabbit anti-HBc antibody (DAKO) and monoclonal mouse anti-RPA antibody. The nuclei were visualised by DAPI staining. Scale bars = 15 µm. (B) A volcano plot indicating the mean of fluorescence intensity for the RPA expression in cells transfected with and without G1862T compared to the untransfected (UT) control. Significant differences were analysed using a one-way ANOVA statistical test and compared to the expression in subgenotype A1 (**** = p-value < 0.0001).

References

    1. WHO . Global Hepatitis Report 2024: Action for Access in Low- and Middle-Income Countries. WHO; Geneva, Switzerland: 2024.
    1. Chauhan R., Kazim S.N., Bhattacharjee J., Sakhuja P., Sarin S.K. Basal core promoter, precore region mutations of HBV and their association with e antigen, genotype, and severity of liver disease in patients with chronic hepatitis B in India. J. Med. Virol. 2006;78:1047–1054. doi: 10.1002/jmv.20661. - DOI - PubMed
    1. Yuen M.F., Sablon E., Yuan H.J., Hui C.K., Wong D.K.H., Doutreloigne J., Wong B.C.Y., Chan A.O.O., Lai C.L. Relationship between the development of precore and core promoter mutations and hepatitis B e antigen seroconversion in patients with chronic hepatitis B virus. J. Infect. Dis. 2002;186:1335–1338. doi: 10.1086/344327. - DOI - PubMed
    1. Milich D.R. Is the function of the HBeAg really unknown? Hum. Vaccines Immunother. 2019;15:2187–2191. doi: 10.1080/21645515.2019.1607132. - DOI - PMC - PubMed
    1. Kamijo N., Matsumoto A., Umemura T., Shibata S., Ichikawa Y., Kimura T., Komatsu M., Tanaka E. Mutations of pre-core and basal core promoter before and after hepatitis B e antigen seroconversion. World J. Gastroenterol. 2015;21:541–548. doi: 10.3748/wjg.v21.i2.541. - DOI - PMC - PubMed

LinkOut - more resources