. 2024 Jul 22;22(7):328.
doi: 10.3390/md22070328.

Combining In Vitro, In Vivo, and Network Pharmacology Assays to Identify Targets and Molecular Mechanisms of Spirulina-Derived Biomolecules against Breast Cancer

Affiliations

Combining In Vitro, In Vivo, and Network Pharmacology Assays to Identify Targets and Molecular Mechanisms of Spirulina-Derived Biomolecules against Breast Cancer

Soha Osama Hassanin et al. Mar Drugs. .

Abstract

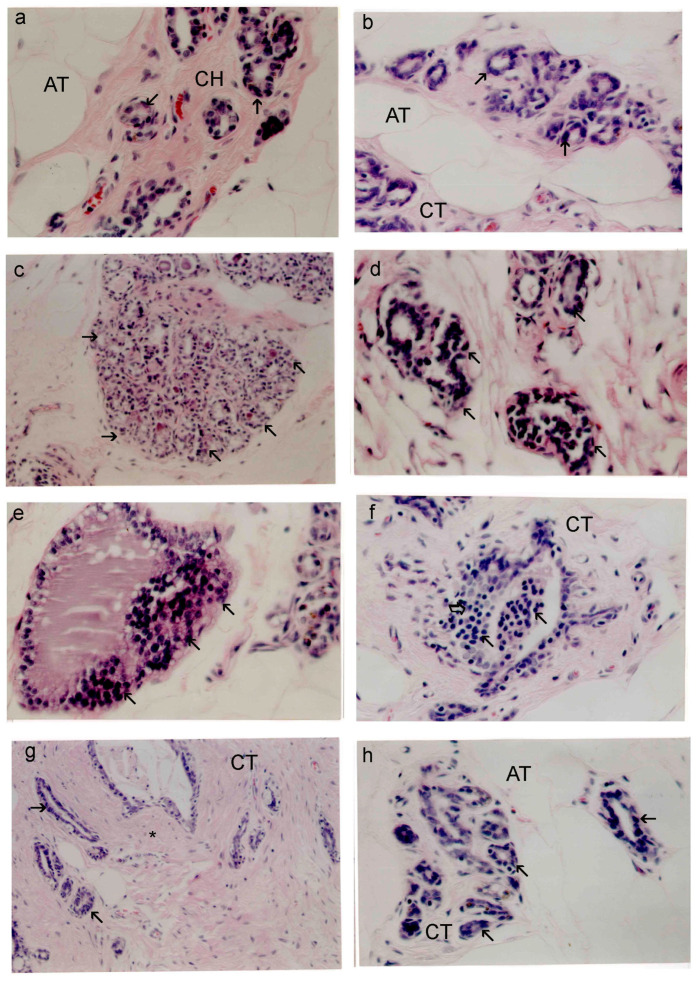
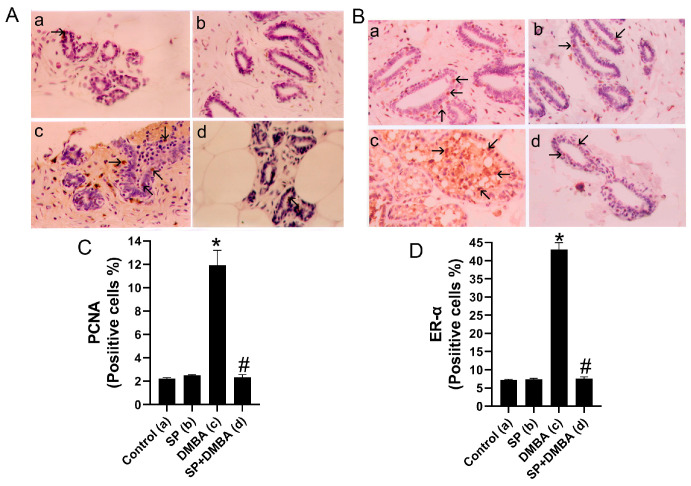
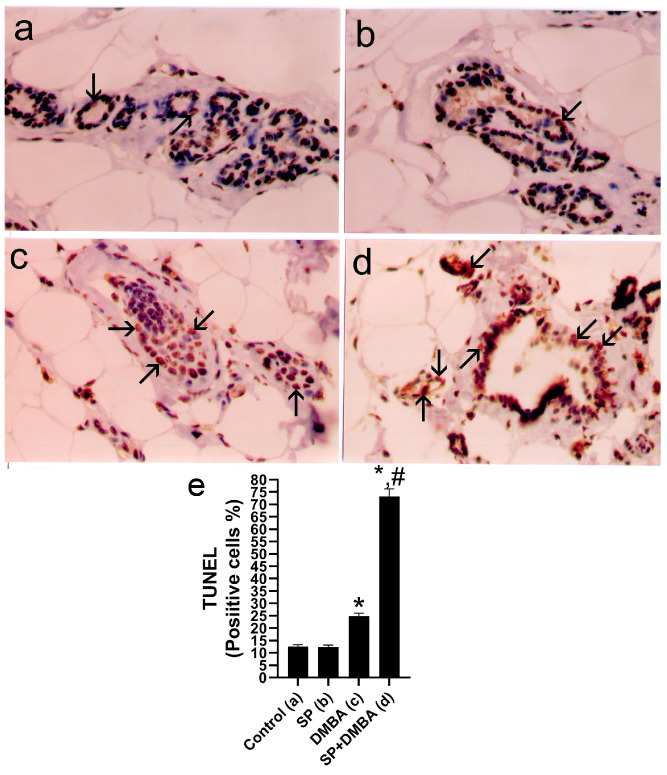
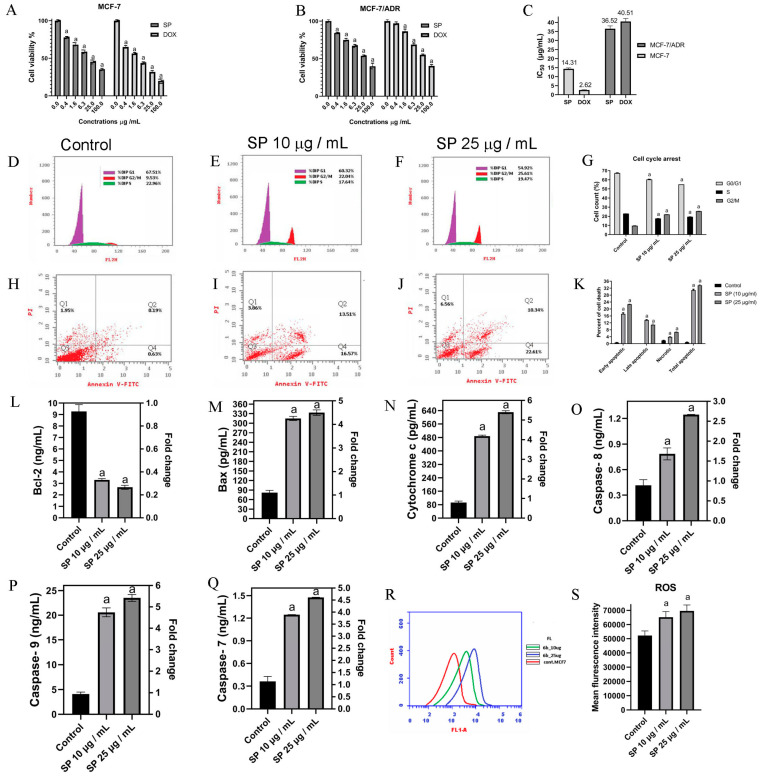
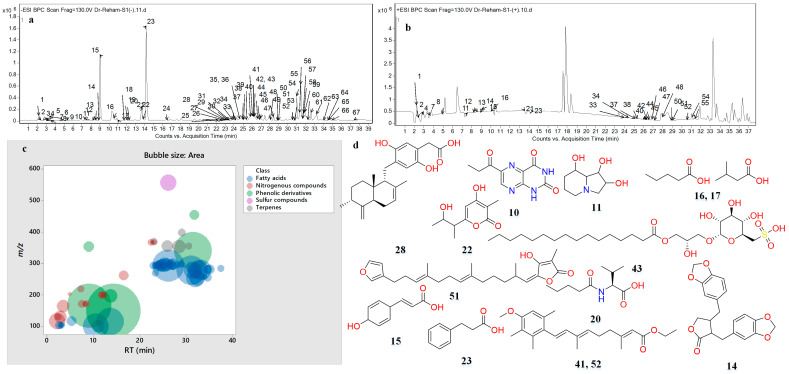
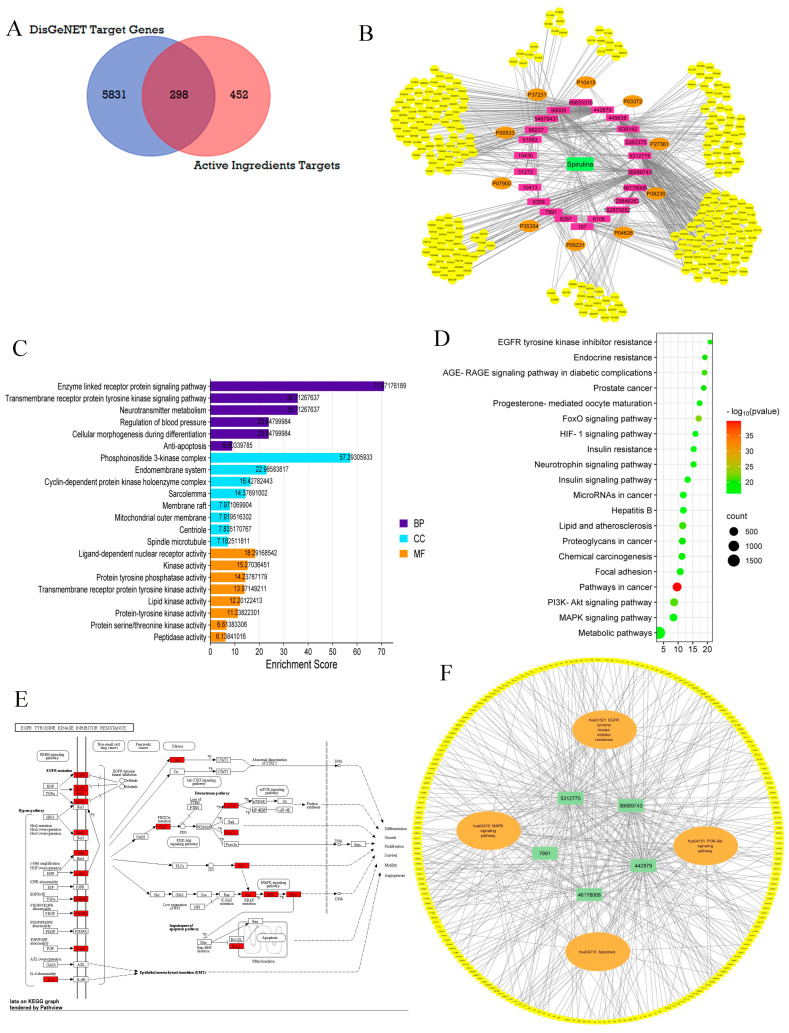
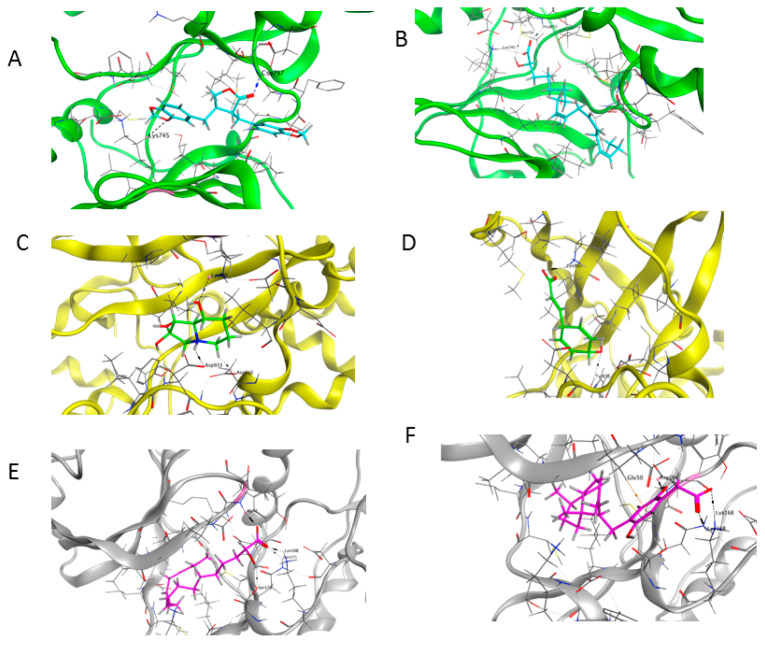
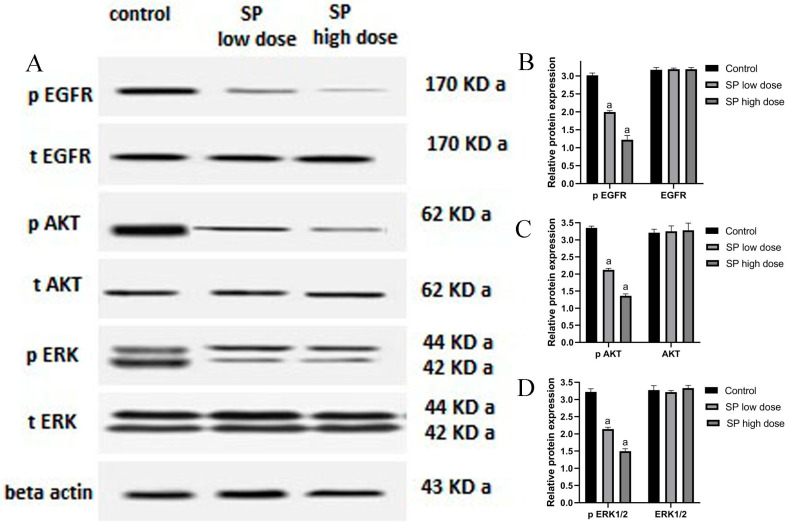
The current research employed an animal model of 7,12-dimethylbenz(a)anthracene (DMBA)-induced mammary gland carcinogenesis. The estrogen receptor-positive human breast adenocarcinoma cell line (MCF-7) was used for in vitro analysis. This was combined with a network pharmacology-based approach to assess the anticancer properties of Spirulina (SP) extract and understand its molecular mechanisms. The results showed that the administration of 1 g/kg of SP increased the antioxidant activity by raising levels of catalase (CAT) and superoxide dismutase (SOD), while decreasing the levels of malonaldehyde (MDA) and protein carbonyl. A histological examination revealed reduced tumor occurrence, decreased estrogen receptor expression, suppressed cell proliferation, and promoted apoptosis in SP protected animals. In addition, SP disrupted the G2/M phase of the MCF-7 cell cycle, inducing apoptosis and reactive oxygen species (ROS) accumulation. It also enhanced intrinsic apoptosis in MCF-7 cells by upregulating cytochrome c, Bax, caspase-8, caspase-9, and caspase-7 proteins, while downregulating Bcl-2 production. The main compounds identified in the LC-MS/MS study of SP were 7-hydroxycoumarin derivatives of cinnamic acid, hinokinin, valeric acid, and α-linolenic acid. These substances specifically targeted three important proteins: ERK1/2 MAPK, PI3K-protein kinase B (AKT), and the epidermal growth factor receptor (EGFR). Network analysis and molecular docking indicated a significant binding affinity between SP and these proteins. This was verified by Western blot analysis that revealed decreased protein levels of p-EGFR, p-ERK1/2, and p-AKT following SP administration. SP was finally reported to suppress MCF-7 cell growth and induce apoptosis by modulating the PI3K/AKT/EGFR and MAPK signaling pathways suggesting EGFR as a potential target of SP in breast cancer (BC) treatment.

Keywords: BC; MCF-7 cell; bioactive metabolites; in vivo; network pharmacology; spirulina.


Conflict of interest statement

The authors declare no conflicts of interest.

Figures

Figure 1
Figure 1
Standard mammary gland structure in histological sections (×200) of rat mammary tissues from the nontreated control (a) and treated SP (b) groups. Small mammary ducts are in the glands, partly surrounded by fibrous connective tissue (CT) and adipose tissues (ATs). Sections from the DMBA group (cf) exhibit diverse histological alterations. (c) Dysplastic mammary gland (×200): the arrow indicates additional ducts and uneven cell division. Focal patches of dysplastic cells may be detected in these moderately dilated breast ductal tubules. (d) Fibroadenoma (×400): the arrow indicates a localized region of considerable ductal and epithelial hyperplasia, which inducts fibrosis (*). Invasive ductal carcinoma displays the proliferation of intraductal neoplastic epithelial cells with remarkable variations in cellular and nuclear sizes and shapes, which invaded the neighbor stroma, as seen in (e) (×400). The arrow represents a small lobular proliferation and localized epithelial hyperplasia with hyperchromatic enlarged nuclei. (f) (×400) The intraductal papillary carcinoma in situ: the arrow represents the micropapillae of neoplastic cells. (g,h) DMBA + SP group fibroadenoma (g) (×200) and stage of mammary gland cell death (h) (×400). (*) Fibrosis and CT connective tissues. H&E staining was used on all sections.
Figure 2
Figure 2
Figure displays immunohistochemical staining for PCNA and ER-α in breast sections, labeled as (A,B). Rats labeled as A and B were subjected to several treatments: (a) vehicle (as a control), SP (b), DMBA (c), and DMBA + SP (d) exhibiting PCNA- and ER-α-positive cell expressions in breast tissues. Photomicrographs and quantitative analysis (C,D) demonstrate the quantity of PCNA- and ER-α-positive cells The quantification of PCNA and ER-cells in each slice was conducted by enumerating the number of cells exhibiting brown staining positivity out of a total of 1000 cells seen at a magnification of 400×. Arrows indicate the presence of PCNA and ER-α-positive cells (H counter stained, 400×). Values expressed as mean ± SEM for six animals in each group. Significance was determined by one-way analysis of variance followed by a post hoc Dunnett’s test. * p < 0.05 vs. control group; # p < 0.05 vs. DMBA group.
Figure 3
Figure 3
Figure displays the presence of TUNEL-positive cells in the mammary tissues of rats subjected to several treatments: (a) vehicle (as a control), SP (b), DMBA (c), and DMBA + SP (d). The semi-quantitative analysis (e) and the photomicrographs reveal the percentage of TUNEL-positive cells in various experimental groups. The percentage of TUNEL-positive cells in each slice was determined by quantifying the number of cells exhibiting brown staining using a 400× magnification, out of a total of 1000 cells. Arrows show TUNEL-positive cells (400×, H counterstained). Values expressed as mean ± SEM for six animals in each group. Significance was determined by one-way analysis of variance followed by a post hoc Dunnett’s test. * p < 0.05 vs. control group; # p < 0.05 vs. DMBA group.
Figure 4
Figure 4
(AC) Breast cancer cell growth decreased by SP. (AC) illustrates how SP and DOX significantly reduce the viability of breast cancer cells. MCF-7 and MCF-7/ADR cells were treated with varying concentrations of SP and DOX, and 24 h later, their viability was evaluated. (DG) demonstrate that SP produced cell cycle arrest using flow cytometry, a method by which the amount of cellular DNA was assessed following PI staining. (HJ) percentage of cells in the S, G1, G2, and M stages. In every instance, untreated cells in their growth media were used as controls. SP-treatment histograms for MCF-7 cells at zero (D), 10 µg/mL (E), and 25 µg/mL (F). (G) Three studies were used to calculate the average proportion of cells in each cell cycle phase. Cell apoptosis was observed using flow cytometry and an Annexin V/PI apoptosis detection kit (HJ). The dual parametric dot plots that incorporated PI fluorescence and Annexin V-FITC analysis reveal that early apoptotic cells are located in the bottom-right quadrant (Q4), late apoptotic cells in the top-right quadrant (Q2), and the viable cell population in the bottom-left quadrant (Q3). (K) demonstrates the percentage of cell necrosis and apoptosis. The reason for MCF-7 cell death is SP, which requires mitochondria. (LQ) The expression of extrinsic and intrinsic apoptosis-related proteins (Bax, Bcl-2, cytochrome c, caspase 8, caspase 9, and caspase 7) was measured using microplate readers and ELISA kits following MCF-7 cells treated with suitable amounts of SP for 24 h. (R) The amount of ROS was measured using flow cytometry. The mean fluorescence density of the ROS level was calibrated using (S). All the data (n = 3) are displayed as mean ± SEM. One-way ANOVA was utilized first, and then Tukey’s post hoc analysis was carried out. a p < 0.05 was obtained when compared to control cells.
Figure 5
Figure 5
Base peak chromatograms (BPCs) of Spirulina extract in (a) the negative and (b) positive ionization modes; (c) bubble plot of the observed masses vs. the retention time in relation to metabolite classes; and (d) structures of the major compounds.
Figure 6
Figure 6
Prediction of SP by network pharmacology for BC treatment. (A) Venn diagram of component target and disease target. (B) SP-ingredients target network: the green rectangles represent SP, the purple rectangles represent ingredients, the orange circles represent the top 10 targets correlated to BC by the PPI network, and the yellow circles represent the other targets. (C) GO enrichment analysis of results for BC treatment of SP. (D) KEGG pathway enrichment analysis of results for BC treatment of SP. (E) EGFR tyrosine kinase resistance pathway. (F) The component–target pathway network.
Figure 7
Figure 7
Three-dimensional representation of the most potent compounds against target enzymes: (A) hinokinin, 442879/EGFR (Green), (B) hydroxylinoleic acid II, 5312775/EGFR (Green), (C) swainsonine, 51683/PI3K (Yellow), (D) p-dihydrocoumaric acid, 129846263/PI3K (Yellow), (E) hydroxylinoleic acid II, 5312775/MAPK(ERK) (Gray), and (F) peyssonoic acid B, 46178008/MAPK(ERK) (Gray).
Figure 8
Figure 8
SP modulates MAPK and PI3K/Akt/EGFR signaling pathways in MCF-7 cells. In MCF-7 cells treated with low (10 μg/mL) and high (25 μg/mL) doses of SP for 24 h, the expression levels of p-EGFR, EGFR, p-AKT, AKT, p-ERK1/2, and ERK1/2 proteins are shown in the Western blot image in (A). Remarkably, the overall protein concentrations of EGFR, AKT, and ERK1/2 did not change with therapy. As a function of SP concentration, the relative protein expression levels of p-EGFR, EGFR, p-AKT, AKT, p-ERK1/2, and ERK1/2 are shown in (BD). The control group consisted of untreated cells grown in their growth medium. The presentation of all data is as mean ± SEM (n = 3). After one-way ANOVA, Tukey’s post hoc analysis was carried out. a p < 0.05 was obtained when compared to control cells.

References

    1. Ferlay J., Colombet M., Soerjomataram I., Parkin D.M., Piñeros M., Znaor A., Bray F. Cancer statistics for the year 2020: An overview. Int. J. Cancer. 2021;149:778–789. doi: 10.1002/ijc.33588. - DOI - PubMed
    1. Chhikara B.S., Parang K. Global Cancer Statistics 2022: The trends projection analysis. Chem. Biol. Lett. 2023;10:451
    1. Laskar Y.B., Lourembam R.M., Mazumder P.B. Medicinal Plants-Use in Prevention and Treatment of Diseases. IntechOpen; London, UK: 2020. Herbal Remedies for Breast Cancer Prevention and Treatment.
    1. Feng M., Feng C., Yu Z., Fu Q., Ma Z., Wang F., Wang F., Yu L. Histopathological alterations during breast carcinogenesis in a rat model induced by 7, 12-Dimethylbenz (a) anthracene and estrogen-progestogen combinations. Int. J. Clin. Exp. Med. 2015;8:346. - PMC - PubMed
    1. Iqbal J., Abbasi B.A., Mahmood T., Kanwal S., Ali B., Shah S.A., Khalil A.T. Plant-derived anticancer agents: A green anticancer approach. Asian Pac. J. Trop. Biomed. 2017;7:1129–1150. doi: 10.1016/j.apjtb.2017.10.016. - DOI