. 2024 Jul 13;10(7):1113-1122.
doi: 10.3390/tomography10070084.

Hyperpolarized Water for Coronary Artery Angiography and Whole-Heart Myocardial Perfusion Quantification

Affiliations

Hyperpolarized Water for Coronary Artery Angiography and Whole-Heart Myocardial Perfusion Quantification

Yupeng Zhao et al. Tomography. .

Abstract

Purpose: Water freely diffuses across cell membranes, making it suitable for measuring absolute tissue perfusion. In this study, we introduce an imaging method for conducting coronary artery angiography and quantifying myocardial perfusion across the entire heart using hyperpolarized water. Methods:1H was hyperpolarized using dissolution dynamic nuclear polarization (dDNP) with UV-generated radicals. Submillimeter resolution coronary artery images were acquired as 2D projections using a spoiled GRE (SPGRE) sequence gated on diastole. Dynamic perfusion images were obtained with a multi-slice SPGRE with diastole gating, covering the entire heart. Perfusion values were analyzed through histograms, and the most frequent estimated perfusion value (the mode of the distribution), was compared with the average values for 15O water PET from the literature. Results: A liquid state polarization of 10% at the time of the injection and a 30 s T1 in D2O TRIS buffer were measured. Both coronary artery and dynamic perfusion images exhibited good quality. The main and small coronary artery branches were well resolved. The most frequent estimated perfusion value is around 0.6 mL/g/min, which is lower than the average values obtained from the literature for 15O-water PET (around 1.1 and 1.5 mL/g/min). Conclusions: The study successfully demonstrated the feasibility of achieving high-resolution, motion-free coronary artery angiography and 3D whole-heart quantitative myocardial perfusion using hyperpolarized water.

Keywords: coronary artery angiography; hyperpolarized MRI; myocardium; perfusion.


Conflict of interest statement

Jan Henrik Ardenkjær-Larsen is the owner of Polarize ApS, Denmark.

Figures

Figure 1
Figure 1
Time-resolved coronary MRA. The figure depicts the arrival of two contrast agent boluses. Frames 1–3 capture the initial arrival of the first bolus in the main artery branch, spreading to the smaller branches. Frames 4–6 show the arrival of the second bolus. Notably, both the main and small left coronary circumflex arteries are well resolved in the images.
Figure 2
Figure 2
SNR map of coronary artery images: The SNR is calculated as the ratio between the signal and the standard deviation (SD) of noise. In each voxel, the signal is determined as the maximum signal intensity among all sampled time steps. The SD of noise is measured in the background (red square delineation), where no hyperpolarized signal is present. The map reveals that the coronary arteries in the image exhibit a high SNR (around 120). Additionally, the small branches at the end of the arteries also display a moderate SNR, approximately 60.
Figure 3
Figure 3
(a) Dynamic perfusion-weighted images: The contrast agent arrival starts at frame 2. Notably, frame 2 reveals a high-amplitude signal in the main artery (slice 1), and the contrast agent perfuses the heart tissues in the subsequent frames. However, due to the short T1 relaxation time of hyperpolarized water in blood, the increased signal is visible only over four frames. (b) Overlay of perfusion and anatomical images. The myocardial region perfused by the hyperpolarized water can be seen in the figure. The colorbar in both subfigures (a,b) covers the signal range.
Figure 4
Figure 4
Quantitative perfusion maps obtained from the upslopes of the signal time courses. Slices 1–8 depict the heart from base to apex. The yellow areas indicate artifactual high perfusion values in the coronary artery.
Figure 5
Figure 5
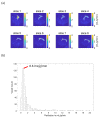
Histogram of estimated perfusion values within a region exhibiting high signal intensity. The region was delineated manually based on dynamic perfusion-weighted images to encompass both arterial and tissue regions. In (a), quantitative perfusion maps are shown, and the area outlined by the white line represents the manually drawn signal region. In (b), the perfusion values within this region are analyzed using a histogram. The most frequent estimated perfusion value is around 0.6 mL/g/min, which is lower than literature values [24,25] (around 1.1 and 1.5 mL/g/min). Much higher estimated values appear due to arterial signal contributions (yellow regions in Figure 3).

References

    1. WHO Cardiovascular Diseases (CVDs) (WHO). Published 7 November 2021. [(accessed on 26 February 2024)]. Available online: https://www.who.int/news-room/fact-sheets/detail/cardiovascular-diseases...
    1. Heo R., Nakazato R., Kalra D., Min J.K. Noninvasive Imaging in Coronary Artery Disease. Semin. Nucl. Med. 2014;44:398–409. doi: 10.1053/j.semnuclmed.2014.05.004. - DOI - PMC - PubMed
    1. Webb J.A.W., Stacul F., Thomsen H.S., Morcos S.K. Members of the Contrast Media Safety Committee of the European Society of Urogenital Radiology. Late adverse reactions to intravascular iodinated contrast media. Eur. Radiol. 2003;13:181–184. doi: 10.1007/s00330-002-1650-5. - DOI - PubMed
    1. Nievelstein R.A.J., Quarles van Ufford H.M.E., Kwee T.C., Bierings M.B., Ludwig I., Beek F.J.A., de Klerk J.M.H., Mali W.P.T.M., de Bruin P.W., Geleijns J. Radiation exposure and mortality risk from CT and PET imaging of patients with malignant lymphoma. Eur. Radiol. 2012;22:1946–1954. doi: 10.1007/s00330-012-2447-9. - DOI - PMC - PubMed
    1. Chiribiri A., Botnar R.M., Nagel E. Magnetic Resonance Coronary Angiography: Where Are We Today? Curr. Cardiol. Rep. 2013;15:328. doi: 10.1007/s11886-012-0328-0. - DOI - PMC - PubMed

Publication types

LinkOut - more resources