. 2024 Dec 2;14(12):2471-2488.
doi: 10.1158/2159-8290.CD-23-1529.

MARK2/MARK3 Kinases Are Catalytic Codependencies of YAP/TAZ in Human Cancer

Affiliations

MARK2/MARK3 Kinases Are Catalytic Codependencies of YAP/TAZ in Human Cancer

Olaf Klingbeil et al. Cancer Discov. .

Abstract

The Hippo signaling pathway is commonly dysregulated in human cancer, which leads to a powerful tumor dependency on the YAP/TAZ transcriptional coactivators. In this study, we used paralog cotargeting CRISPR screens to identify kinases MARK2/3 as absolute catalytic requirements for YAP/TAZ function in diverse carcinoma and sarcoma contexts. Underlying this observation is the direct MARK2/3-dependent phosphorylation of NF2 and YAP/TAZ, which effectively reverses the tumor suppressive activity of the Hippo module kinases LATS1/2. To simulate targeting of MARK2/3, we adapted the CagA protein from Helicobacter pylori as a catalytic inhibitor of MARK2/3, which we show can regress established tumors in vivo. Together, these findings reveal MARK2/3 as powerful codependencies of YAP/TAZ in human cancer, targets that may allow for pharmacology that restores Hippo pathway-mediated tumor suppression. Significance: We show how genetic redundancy conceals tight functional relationships between signaling and transcriptional activation in cancer. Blocking the function of MARK2/3 kinases leads to the reactivation of the Hippo tumor suppressive pathway and may have therapeutic potential in YAP/TAZ-dysregulated carcinomas and sarcomas. See related commentary by Gauthier-Coles and Sheltzer, p. 2312.


Conflict of interest statement

D.L. Spector reports grants from NIH during the conduct of the study. D.A. Tuveson reports other support from Leap Therapeutics, Xilis, Mestag Therapeutics, Dunad Therapeutics, and Sonata, as well as grants from ONO outside the submitted work. C.R. Vakoc reports grants from Treeline Biosciences during the conduct of the study, as well as personal fees from Treeline Biosciences and KSQ Therapeutics outside the submitted work. No disclosures were reported by the other authors.

Figures
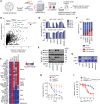
Figure 1.
Figure 1.
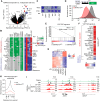
Paralog cotargeting CRISPR screens identify MARK2/3 as context-specific cancer dependencies. A and B, Workflow of paralog double knockout CRISPR screens including paralog identification, domain mapping, sgRNA design, oligo synthesis, cloning, and negative-selection screening. Numbers of paralog combinations are indicated. B, Summary of CRISPR screening results, analysis of synergy between paralog gene pairs (Gemini score; Supplementary Tables S4–S6), maximum scores are shown together with variance of dependency [variance of average LFC of dgRNA abundance] across 22 screened cell lines. Each dot represents a double knockout paralog pair (n = 2,726) among signaling and epigenetic regulators. C and D, Competition-based fitness assays in Cas9-expressing cancer cells after lentiviral knockout of indicated genes [expression of dgRNAs was linked to GFP]. C, Heatmap color indicates the LFC of normalized GFP (%GFP+ normalized to day 3 or 6 after infection). n = 3. D, Competition-based fitness assays in the indicated cell lines. Data are shown as mean ± SD of normalized %GFP+ (to day 3 after infection). n = 3. E, Western blot analysis of the indicated cell lines. F, Apoptosis measurements using annexin-V and DAPI in Cas9-expressing YAPC cells. Indicated genes were knocked out using lentiviral dgRNAs linked to GFP. Data are shown as mean ± SD. n = 3–6. P value was calculated on change in viability compared with control with one-way ANOVA and Dunnett correction. G, Crystal violet staining of indicated cells after lentiviral knockout of indicated genes. Data shown are representative of three independent biological replicates. H, Rescue experiment in YAPC cells using lentiviral expression of CRISPR-resistant (CR) cDNAs or empty vector control (Ctrl). Data shown are the mean ± SD of %GFP+ (normalized to day 3 after infection). n = 3. P values are calculated using a mixed effects model (considering the interaction of experimental groups over time) compared with the Ctrl group and corrected with Holm–Bonferroni. I, Normalized relative luminescence units from CellTiter-Glo viability measurements of the indicated YAPC cell lines after 5 days of 1-NM-PP1 treatment. Data are shown as mean ± SD. n = 9. Measurements from three biological replicates were performed in triplicate. Four-parameter dose–response curves were plotted.
Figure 2.
Figure 2.
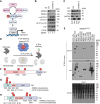
MARK2/3 dependency in cancer is linked to the maintenance of YAP/TAZ function. A, mRNA expression differences comparing 19 MARK2/3-dependent with 12 MARK2/3-independent human cancer cell lines. Transcriptome data were obtained from the CCLE database, KLM1 (GSE140484), and CHL1 (this article). TPM were calculated and the difference in log2(TPM + 1) was plotted. P values were calculated using empirical Bayes statistics (eBayes) for differential expression with Holm–Bonferroni (BH) correction. B, Heatmap of MARK2/3-dependent and MARK2/3-independent cancer cell lines showing dependence on YAP/TAZ and expression of target genes. Competition-based fitness assays in Cas9-expressing cancer cells after lentiviral knockout of indicated genes (expression of dgRNAs was linked with GFP). Heatmap color indicates the LFC of %GFP+ (normalized to day 3 or 6 after infection). n = 3. C, Crystal violet stain of indicated cells following lentiviral knockout of indicated genes. Data shown are representative of three independent biological replicates. D, Flow cytometry histogram of YAP/TAZ:TEAD reporter assay (19) in MDA-MB-231 cells, on day 9 after infection. Data are representative of three independent experiments. E, Gene set enrichment analysis (GSEA) of Cas9+ MDA-MB-231 cancer cells after MARK2+3dKO, including normalized enrichment score (NES) and P value. F, Heatmap showing the GSEA NES for the YAP/TAZ gene signature following MARK2+3dKO in dependent and independent cell lines. G, Heatmap of mRNA expression [log2(normalized count)] z-scores in Cas9+ MDA-MB-231 cells of genes significantly downregulated or upregulated upon MARK2+3dKO. Expression values of downregulated genes (n = 188) and upregulated genes (n = 91) of two replicate samples after gene knockout were grouped based on unsupervised clustering. Significant differentially expressed genes were defined as adjusted P value < 10−4 and LFC >2 or <−1. P values from Wald test (DEseq2) adjusted using BH. H, CUT&RUN density profile of YAP:TEAD4−bound, YAP/TAZdKO-sensitive H3K27ac marked enhancer loci (n = 7,896) after MARK2+3dKO. Profiles shown are an average of 50 bp bins around the summit of the enhancers. I, Occupancy profiles of public chromatin immunoprecipitation sequencing (ChIP-seq; TEAD4, YAP; GSE66083) and CUT&RUN (H3K27ac) upon indicated gene knockout at YAP/TAZ target gene loci.
Figure 3.
Figure 3.
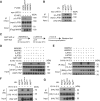
MARK2/3 suppresses the Hippo pathway and phosphorylate multiple components. A, Illustration of the Hippo pathway. B and C, Western blot analysis of Cas9+ YAPC cells: B, whole-cell lysate or C, following fractionation into nuclear (Nuc) and cytosolic (Cyto) fraction, following controldKO (Ctrl) or MARK2+3dKO. Independent dgRNA are indicated. D, Illustration of in-cell phosphorylation assay. Epitope-tagged cDNAs coding for putative MARK2 substrates are transfected into HEK293T cells together with cDNA coding for analog-sensitive mutant MARK2M129G. Kinase assay is performed using ATP analog (6-Fu-ATP-γ-S) selective for MARK2M129G. Labeled substrates are alkylated using para-nitrobenzyl mesylate and identified after purification by Western blot analysis. E, Western blot analysis of MARK2-specific in-cell phosphorylation of Hippo pathway components. Data are representative of two independent experiments. F–H, Lollipop illustration of MARK2-dependent phosphorylation sites on NF2, YAP, and TAZ identified using MS-based phosphoproteomics. C-term, carboxy-terminal domain; TAD, transactivation domain; TB, TEAD-binding domain. A, D, FH were created with BioRender.com.
Figure 4.
Figure 4.
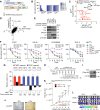
MARK2/3 catalyzes inhibitory phosphorylation of NF2 and activates phosphorylation of YAP/TAZ. A, Immunoprecipitation (IP)–Western blot analysis evaluating the phosphorylation p-LATS1 (T1079) in the presence or absence of MARK2 or MARK3 after NF2 overexpression in HEK293T cells. Data are representative of two independent experiments. B, IP–Western blot analysis evaluating the phosphorylation p-LATS1 (T1079) after NF2 mutant overexpression in HEK293T cells. Data are representative of two independent experiments. C–E,In vitro phosphorylation assay and IP–Western blot analysis, evaluating the interaction of 14-3-3ε and recombinant LATS1 (rLATS1) or LATS2 (rLATS2) phosphorylated GST-YAP or GST-TAZ, after phosphorylation with recombinant MARK2 (rMARK2) or MARK3 (rMARK3). Data are representative of two independent experiments. F, IP–Western blot analysis evaluating the interaction between 14-3-3ε and YAP5D (phosphomimetic mutant), YAP5A (phospho-null mutant) and controls YAPWT (wild-type) and YAPS127A (LATS1/2 phosphosite/14-3-3 interaction mutant) in HEK293T cells. Data are representative of two independent experiments. G, IP–Western blot analysis evaluating the interaction between 14-3-3ε and TAZ4D (phosphomimetic mutant), TAZ4A (phospho-null mutant), and controls TAZWT (wild-type) and TAZS89A (LATS1/2 phosphosite/ 14-3-3 interaction mutant) in HEK293T cells. Data are representative of two independent experiments.
Figure 5.
Figure 5.
Regulation of NF2 and YAP accounts for the essential functions of MARK2/3 in human cancer. A, Rescue experiment of MARK2+3dKO after double knockout of LATS1/2 or MST1/2 and double knockout of control (Ctrl) in indicated Cas9+ cell lines. Data shown are the mean ± SD of %GFP+ (normalized to day 3 after infection). n = 3–6. P values are calculated using a mixed effects model (considering the interaction of experimental groups over time) compared with the Ctrl group and corrected with Holm–Bonferroni (BH). B and C, Western blot analysis in YAPC cells and independent dgRNAs are indicated. D, Western blot analysis in Cas9+ YAPC cells. E, Rescue experiment of MARK2+3dKO following knockout of NF2 or Ctrl and lentiviral HA-YAP5D overexpression. Data shown are the mean ± SD of %GFP+ (normalized to day 3 after infection). n = 3. P values are calculated using a mixed effects model (considering the interaction of experimental groups over time) compared with the Ctrl group and corrected with BH.
Figure 6.
Figure 6.
Inducible expression of a protein-based MARK2/3 inhibitor reinstates Hippo-mediated tumor suppression in organoid and xenograft tumor models. A, Illustration of MKI protein derived from Helicobacter pylori. Positioning of self-cleaving peptides (2A), GFP reporter, and number of amino acids are indicated. B, Competition-based fitness assays in YAPC cells after lentiviral expression of MKIWT or MKIMUT. C, Comparison of LFC of MKI and MARK2+3dKO double knockout competition data in Cas9+ cancer cell lines. Pearson correlation coefficient was calculated. Data shown are the mean of %GFP+ (normalized to day 3 after infection). n = 3. D, Global mRNA expression LFC correlation of MKIWT vs. MKIMUT or MARK2+3dKO vs. CtrlKO MDA-MB-231 cells. E, Western blot analysis in YAPC cells 24 hours after doxycycline-induced expression of indicated proteins. F, Rescue experiment of MKIWT expression after knockout of LATS1/2, NF2, or Ctrl and lentiviral HA-YAP5D overexpression. Data shown are the mean ± SD of %GFP+ (normalized to day 3 after infection). n = 3. P values are calculated using a mixed effects model (considering the interaction of experimental groups over time) compared with Ctrl group and corrected with Holm–Bonferroni. G, Normalized relative luminescence units from CellTiter-Glo viability measurements of the indicated human patient–derived triple-negative breast cancer (TNBC) or pancreatic ductal adenocarcinoma (PDAC) organoids after doxycycline (Dox)–induced expression of MKIWT for 10 days. Data shown are mean ± SEM. n = 6. Measurements from two biological replicates performed in triplicate. P value was calculated using a two-tailed parametric t test with Welch’s correction. H, Experimental design of orthotopic transplantation study. Mice were treated with doxycycline 17 days after implantation, and tumor growth was monitored using NIS-SPECT and bioluminescence imaging once every 7 days. I, Western blot analysis in T3M4 cells 24 hours after doxycycline induced expression of MKIWT. J, Representative microscopic images (n = 2–3) showing IHC of GFP after 24 hours of treatment with Dox. Scale bar = 200 µm. K, Growth kinetics of orthotopic PDAC T3M4 xenografts implanted in immunodeficient mice. Expression of MKIWT from Dox-inducible lentiviral construct was induced on day 17 after injection of the cells. Data are shown as mean ± SEM. n = 10 per group. L, Representative bioluminescence measurement at indicated time points. (A and H, Created with BioRender.com.)

References

    1. Ma S, Meng Z, Chen R, Guan KL. The hippo pathway: biology and pathophysiology. Annu Rev Biochem 2019;88:577–604. - PubMed
    1. Zhao B, Wei X, Li W, Udan RS, Yang Q, Kim J, et al. . Inactivation of YAP oncoprotein by the Hippo pathway is involved in cell contact inhibition and tissue growth control. Genes Dev 2007;21:2747–61. - PMC - PubMed
    1. Huang J, Wu S, Barrera J, Matthews K, Pan D. The Hippo signaling pathway coordinately regulates cell proliferation and apoptosis by inactivating Yorkie, the Drosophila Homolog of YAP. Cell 2005;122:421–34. - PubMed
    1. Meng Z, Moroishi T, Mottier-Pavie V, Plouffe SW, Hansen CG, Hong AW, et al. . MAP4K family kinases act in parallel to MST1/2 to activate LATS1/2 in the Hippo pathway. Nat Commun 2015;6:8357. - PMC - PubMed
    1. Zheng Y, Wang W, Liu B, Deng H, Uster E, Pan D. Identification of happyhour/MAP4K as alternative hpo/mst-like kinases in the hippo kinase cascade. Dev Cell 2015;34:642–55. - PMC - PubMed

Substances