. 2024 Sep 2;221(9):e20240656.
doi: 10.1084/jem.20240656. Epub 2024 Jul 26.

The RNA binding protein Arid5a drives IL-17-dependent autoantibody-induced glomerulonephritis

Affiliations

The RNA binding protein Arid5a drives IL-17-dependent autoantibody-induced glomerulonephritis

Yang Li et al. J Exp Med. .

Abstract

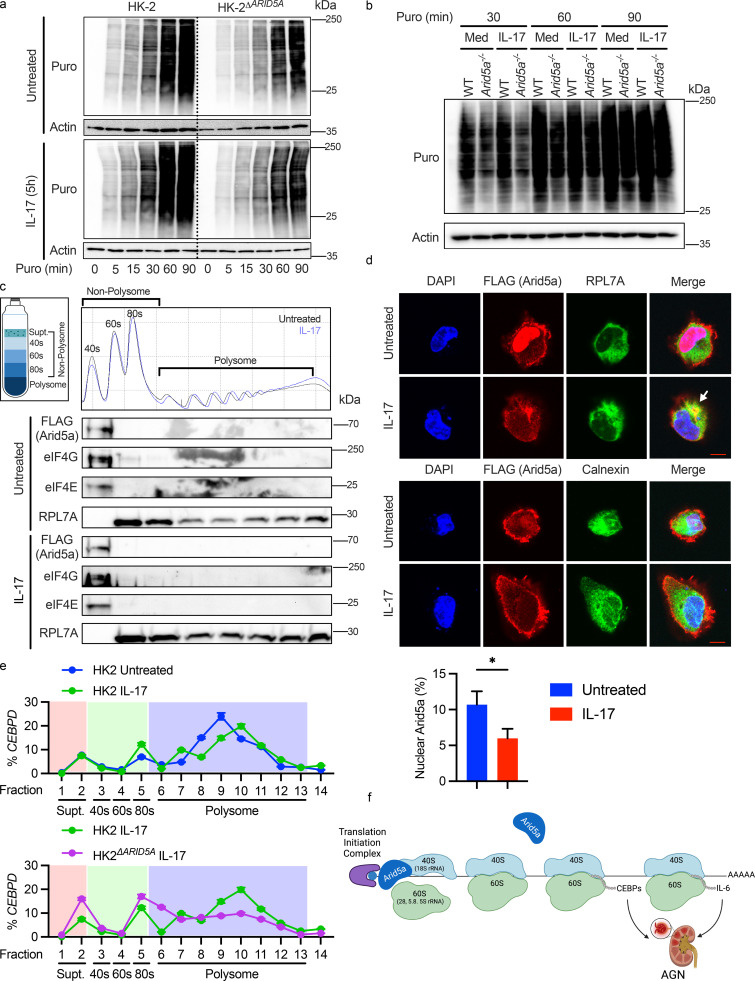
Autoantibody-mediated glomerulonephritis (AGN) arises from dysregulated renal inflammation, with urgent need for improved treatments. IL-17 is implicated in AGN and drives pathology in a kidney-intrinsic manner via renal tubular epithelial cells (RTECs). Nonetheless, downstream signaling mechanisms provoking kidney pathology are poorly understood. A noncanonical RNA binding protein (RBP), Arid5a, was upregulated in human and mouse AGN. Arid5a-/- mice were refractory to AGN, with attenuated myeloid infiltration and impaired expression of IL-17-dependent cytokines and transcription factors (C/EBPβ, C/EBPδ). Transcriptome-wide RIP-Seq revealed that Arid5a inducibly interacts with conventional IL-17 target mRNAs, including CEBPB and CEBPD. Unexpectedly, many Arid5a RNA targets corresponded to translational regulation and RNA processing pathways, including rRNAs. Indeed, global protein synthesis was repressed in Arid5a-deficient cells, and C/EBPs were controlled at the level of protein rather than RNA accumulation. IL-17 prompted Arid5a nuclear export and association with 18S rRNA, a 40S ribosome constituent. Accordingly, IL-17-dependent renal autoimmunity is driven by Arid5a at the level of ribosome interactions and translation.


Conflict of interest statement

Disclosures: S.L. Gaffen reported personal fees from Trotana and Aclaris Therapeutics during the conduct of the study; in addition, S.L. Gaffen had a patent number 8,460,647 issued. No other disclosures were reported.

Figures

None
Graphical abstract
Figure 1.
Figure 1.
Arid5a is elevated in human and mouse renal epithelium during AGN. (a) The European Renal cDNA Biobank database was interrogated for ARID5A and IL17A mRNA in the following populations (both sexes): IgA nephropathy (n = 27); focal segmental glomerulosclerosis (FSGS; n = 18); membranous nephropathy (MN, n = 21); ANCA (n = 22); tumor nephrectomy (n = 5); and healthy control (n = 21). Each symbol indicates one subject, analyzed by one-way ANOVA with Dunnett’s test for multiple comparisons, comparing each column to healthy controls. (b) Left: Renal biopsies from patients with ANCA-associated GN or healthy controls were stained with a custom ARID5A probe. Red dots indicate amplified ARID5A mRNA. Representative images are shown. Size bar = 100 µm. Right: Quantitation of RNAScope images. Each symbol represents one individual (control, n = 4; ANCA n = 12). Data show mean ± SEM, analyzed by Student's t test. (c) Timeline of AGN model. IF, immunofluorescence. (d) C57BL/6 WT and Act1−/− mice were administered PBS (Control) or subjected to AGN. Indicated kidney mRNAs were assessed on day 7 by qPCR normalized to Gapdh. Mean ± SEM, analyzed by one-way ANOVA with post-hoc Tukey’s test for multiple comparisons. Each symbol represents one mouse (n = 4–7), pooled from two independent experiments. (e) Frozen kidney sections from WT mice subjected to AGN for 7 days were stained for DAPI and Arid5a. Representative images indicating renal cortex and medulla are shown. Size bar = 100 µm. *P < 0.05, ** < 0.01, *** < 0.001, **** < 0.0001.
Figure S1.
Figure S1.
Arid5a expression in human and murine AGN (associated with Figs. 1 and 2). (a) ARID5A levels according to the Human Cell Atlas single-cell RNA-Seq datasets (Stewart et al., 2019). ARID5A and ATP1A1 (ATPase Na+/K+ transporting subunit α1) are indicated, analyzed by Adifa. PT, proximal tubule. dPT, distinct proximal tubule. EPC, epithelial progenitor cell. PC, principal cell. PE, pelvic epithelium. TE, transitional epithelium of ureter. CNT, connecting tubule. LOH, loop of Henle. IC, intercalated cells. podo, podocyte. Fib, fibroblast. MFib, myofibroblast. GE, glomerular endothelium. DVRE/AVRE, descending/ascending vasa recta endothelium. PCE, peritubular capillary endothelium. NK, natural killer. (b) ARID5A and ATP1A1 in the Human Nephrogenesis Atlas by single-cell RNA-Seq (Lindström et al., 2021). (c) Mice were given PBS (Control) or subjected to AGN and analyzed on day 7. qPCR analysis of Zc3h12a normalized to Gapdh. Each symbol represents one mouse. Results were pooled from two independent experiments (n = 2–6). Analyzed by one-way ANOVA with post-hoc Tukey’s test. (d) Sections from WT and Arid5a−/− kidneys were stained for DAPI and anti-Arid5a by IF. Representative images are shown. Scale bar = 500 µm. (e) Mice were given PBS (Control) or subjected to AGN and analyzed on day 7. Serum BUN was assessed by ELISA. Mean ± SEM, analyzed by one-way ANOVA with post-hoc Tukey’s test. Results were pooled from two independent experiments (n = 5–7). (f) Indicated mRNAs in kidney were assessed on day 7 by qPCR normalized to Gapdh. Mean ± SEM, analyzed by one-way ANOVA with post-hoc Tukey’s test. Each symbol represents one mouse (n = 5–7) pooled from two independent experiments. (g) Mice were administered PBS or AA1, and serum BUN was assessed by ELISA on day 6. Each symbol represents one mouse (n = 6–9), pooled from two to three independent experiments. Mean ± SEM, analyzed by one-way ANOVA with post-hoc Tukey’s test. *P < 0.05, **** < 0.0001.
Figure 2.
Figure 2.
Arid5a is required for AGN pathology. The indicated mice were administered PBS (Control) or subjected to AGN. (a) Top: Serum BUN and creatinine were evaluated by ELISA on day 14. Each symbol represents one mouse (n = 5–8) pooled from two independent experiments. Bottom: H&E staining of kidney sections with clinical scoring. Representative images are shown. Size bar = 200 µm. Percent of abnormal glomeruli within each field is indicated. Each symbol represents one mouse (n = 3–4). Data are mean ± SEM, analyzed by one-way ANOVA with post-hoc Tukey’s test for multiple comparisons. (b) Indicated mRNAs in kidney were assessed on day 7 by qPCR normalized to Gapdh. Mean ± SEM, analyzed by one-way ANOVA with post-hoc Tukey’s test for multiple comparisons. Each symbol represents one mouse (n = 5–7) pooled from two independent experiments. (c) C57BL/6 WT and Arid5a−/− mice were administered PBS (Control) or subjected to AGN. Kidneys were analyzed on day 7. Representative flow cytometry plots and percentages are shown for macrophages (CD45+CD11b+F4/80+) and inflammatory monocytes (CD45+CD11b+Ly6C+Ly6G). Each symbol represents one mouse (n = 5–7), pooled from two independent experiments. Data were analyzed by one-way ANOVA with post-hoc Tukey’s test for multiple comparisons. (d) C57BL/6 WT or Arid5a−/− mice were lethally irradiated and reconstituted with femoral BM from reciprocal donors. After 6 wk, mice were administered PBS (Control) or subjected to AGN. On day 14, serum BUN and creatinine were measured by ELISA. Each symbol represents one mouse (n = 7–8) pooled from two independent experiments. Data analyzed by one-way ANOVA with post-hoc Tukey’s test for multiple comparisons. *P < 0.05, ** < 0.01, *** < 0.001, **** < 0.0001.
Figure S2.
Figure S2.
Immune cell levels in Arid5a−/− mice during AGN (associated with Figs. 2 and 3). WT and Arid5a−/− mice were administered PBS (Control) or subjected to AGN. On day 7, renal homogenates were analyzed by flow cytometry. (a) Gating strategy for flow cytometry. (b) Total numbers of macrophages (CD45+CD11b+F4/80+) and inflammatory monocytes (CD45+CD11b+Ly6C+Ly6G). (c) Total numbers of DCs, neutrophils, CD4+, and CD8+ cells. (d) Percentage of the indicated subpopulations within CD45+ subset. Results were pooled from two independent experiments (n = 5–7). Data analyzed by one-way ANOVA with post-hoc Tukey’s test. *P < 0.05, ** < 0.01.
Figure 3.
Figure 3.
Cell proliferation is not altered in the absence of Arid5a. (a) C57BL/6 WT and Arid5a−/− mice were administered PBS (Control) or subjected to AGN. On day 7, renal cell proliferation was determined by staining for CD45CD133+Ki67+ absolute cell number (left) and percentages (right) in the CD45 population. Each symbol represents one mouse (n = 3–4). (b) BrdU was injected i.p. on 6 days after AGN induction. On day 7, renal cell homogenates were assessed by flow cytometry. CD133CD45+ (top) and CD133+CD45 (bottom). (c) Percentage of cells within the indicated cell cycle stages in CD133+CD45 (left) and CD133CD45+ (right) populations were quantified. Data analyzed by ordinary one-way ANOVA with post-hoc Tukey’s test. Each symbol represents one mouse (n = 2–3). (d) Representative Ki-67 staining in WT or Arid5a/ primary fibroblasts isolated from mouse ear and treated ± IL-17 (200 ng/ml) for 3 or 6 h. Plot is representative of three independent experiments. (e) WT and Arid5a−/− primary ear fibroblasts were plated and recovered in a standard scratch assay was monitored at the indicated time points. Each number represents one monitored area (n = 18), pooled from six independent samples. Data analyzed by two-way ANOVA with post-hoc Tukey’s test with no significant differences observed between WT and Arid5a/ cells. Representative images are shown. Scale bar = 400 µm.
Figure 4.
Figure 4.
Arid5a regulates C/EBP transcription factors. (a) The indicated mice were administered PBS or subjected to AGN. Expression of IL-17–induced TFs in AGN kidney was assessed on day 7 by qPCR normalized to Gapdh. Each symbol represents one mouse (n = 5–7) pooled from two independent experiments. Mean ± SEM, analyzed by one-way ANOVA with post-hoc Tukey’s test for multiple comparisons. (b) The indicated proteins were assessed in whole kidney homogenates by immunoblotting. Each lane depicts lysates from an individual mouse. (c) Primary RTECs isolated from WT or Arid5a/ kidneys were stimulated with IL-17. The indicated genes were assessed by qPCR normalized to Gapdh. Each symbol represents one mouse (n = 8), pooled from six independent experiments and analyzed by one-way ANOVA with Sidak’s test for multiple comparisons for each time point. (d) Cell lysates from primary murine RTECs were subjected to immunoblotting. C/EBPβ isoforms: LAP/LAP*, liver enriched activator protein; LIP, liver enriched inhibitor protein. Data are representative of three independent experiments. (e) HK-2 and HK-2ΔARID5A cells were stimulated with human IL-17 at the following time points: LCN2 and NFKBIZ at 2 h, IL6, CEBPB, and CEBPD at 8 h. Expression was assessed by qPCR, normalized to GAPDH. Mean ± SEM, analyzed by one-way ANOVA with post-hoc Tukey’s test for multiple comparisons. Each symbol represents one sample, pooled from four independent experiments. (f) HK-2 and HK-2ΔARID5A cells were treated with IL-17 for the indicated times, and lysates were analyzed by immunoblotting. Image representative of three independent experiments. *P < 0.05, ** < 0.01, *** < 0.001, **** < 0.0001. Source data are available for this figure: SourceData F4.
Figure S3.
Figure S3.
Arid5a-mediated C/EBP regulation (associated with Fig. 4). (a) Densitometric quantitation of blots (Fig. 4 b) was determined by ImageJ. Mean ± SEM, analyzed by one-way ANOVA with post-hoc Tukey’s test. C/EBPβ isoforms: LAP/LAP*, liver enriched activator protein; LIP, liver enriched inhibitor protein. (b) HK-2 cells were stimulated with human IL-17 for the indicated times, and expression of mRNAs implicated in AGN was measured by qPCR normalized to GAPDH. Each number represents an individual sample, pooled from up to six independent experiments (n = 2–6). Data are mean ± SEM, analyzed by one-way ANOVA with post-hoc Dunnett’s test, comparing each time point to the control (0 h) sample. (c) RNA stabilization was determined by Roadblock-PCR (Watson et al., 2020) in HK-2 and HK-2ΔARID5A cells ± IL-17 (200 ng/ml) for the indicated times. Data analyzed by one phase decay best-fit. (d) HK-2 and HK-2ΔARID5A cells were treated with human IL-17 at the indicated times. Left: Cytoplasmic or nuclear RNA assessed by qPCR, normalized to GAPDH (cytoplasm) or MALAT1 (nucleus). Right: Validation of cellular fractionation was confirmed by immunoblotting for YY1 (nucleus) or tubulin (cytoplasm). Mean ± SEM, analyzed by one-way ANOVA with post-hoc Tukey’s test. Each symbol represents an individual sample (n = 6), pooled from two independent experiments. *P < 0.05, ** < 0.01, *** < 0.001, **** < 0.0001. Source data are available for this figure: SourceData FS3.
Figure 5.
Figure 5.
Identification of Arid5a target transcripts in RTECs. (a) Experimental design. Inset: HK-2 cells were transfected with Flag-Arid5a and treated ± IL-17 for the indicated times. Flag-Arid5a was assessed in cell lysates by immunoblotting, representative of three independent experiments. (b) HK-2 cells were transfected with Flag-Arid5a, treated ± IL-17 for 3 h, and enrichment of the indicated mRNAs after RIP was assessed by qPCR. Each symbol represents an individual sample, pooled from three independent experiments. Results were normalized to untreated IgG RIP controls. Data are mean ± SEM, analyzed by one-way ANOVA with post-hoc Tukey’s test for multiple comparisons. (c) HK-2 cells were transfected with Flag-Arid5a, treated ± IL-17 for 3 h, and lysates were subjected to RIP-Seq with anti-Flag or IgG isotype controls. Heatmaps show selected inflammatory mRNAs from three independent replicates. (d) GSEA pathway prediction of RIP-Seq comparing untreated and IL-17–treated samples, FDR < 0.05, minimum gene IDs in category = 5. (e) HK-2 cells were transfected with Flag-Arid5a, treated ± IL-17 for 3 h, and lysates subjected to RIP. Enrichment of rRNAs corresponding to 40S (18S) and 60S ribosomes (5S, 5.8S, 28S) were determined by qPCR, normalized to untreated IgG RIP controls. Data show mean ± SEM, analyzed by one-way ANOVA with post-hoc Tukey’s test. Data were pooled from five independent experiments. *P < 0.05, ** < 0.01, *** < 0.001, **** < 0.0001. Source data are available for this figure: SourceData F5.
Figure S4.
Figure S4.
Arid5a RIP-Seq analysis in RTECs (associated with Figs. 5 and 6). (a) HK-2 cells were transfected with Flag-Arid5a, treated ± IL-17 for 3 h (n = 3). Lysates were immunoprecipitated with anti-Flag Abs or IgG controls and subjected to Illumina sequencing. PCA showing sample heterogeneity among groups captured by gene expression. (b) Biotype distribution of 2788 Arid5a associated RNAs enriched in IL-17–treated group. (c) Genes in Gene Ontology Translation geneset (GO:0006412) in IL-17–treated Arid5a (anti-Flag) pulldowns compared with untreated controls. (d) HK-2 and HK-2ΔARID5A cells were treated with IL-17 for 1 h, and cytoplasmic lysates were subjected to sucrose gradient fractionation. Fractions used for qPCR are indicated. (e) Translation efficiency for the indicated transcripts was calculated as the percentage of RNA compared to total RNA in large polysomes (fractions 11–13) or small polysomes (fractions 6–10)/non-polysome (fractions 2–5). Data are representative of two independent experiments. Supt, supernatant.
Figure 6.
Figure 6.
Arid5a facilitates protein synthesis in RTECs. (a) HK-2 cells were treated ± IL-17 for 5 h, labeled with puromycin, and immunoblotted with anti-puromycin or β-actin Abs, representative of three independent experiments. (b) Primary mouse RTECs were treated ± IL-17 for 5 h and labeled with puromycin. Lysates were immunoblotted with anti-puromycin or β-actin Abs, representative of three independent experiments. Med, media alone. (c) Cells were transfected with Flag-Arid5a and treated ± IL-17 for 3 h. Cytoplasmic lysates were separated by sucrose gradient fractionation. Y-axis shows A260 absorbance. Expression of Flag (Arid5a), eIF4G, eIF4E, and RPL7A was assessed in three pooled fractions per sample. Data representative of three independent experiments. (d) HK-2 cells were treated ± IL-17 for 3 h, stained with DAPI or Abs against Flag, RPL7A, or calnexin, and imaged by confocal microscopy. Size bar = 10 µm. Representative images are shown. Quantitation of nuclear Arid5a is shown below. Each value represents the percentage of colocalized volume from an individual cell (n = 218–225). Arrow denotes region of co-association of Arid5a with RPL7A. Analyzed by Student’s t test. (e) HK-2 cells were treated ± IL-17 for 1 h, and CEBPD in two pooled fractions per sample was assessed by qPCR, presented as a percent of total CEBPD from all fractions. Shading: pink denotes supernatant (Supt), green denotes 40S, 60S, and 80S fractions, and blue denotes polysomes. (f) Proposed mechanism of Arid5a function in AGN: Arid5a binds to 18S rRNA (40S ribosome subunit). Arid5a also binds to the 5S rRNA (60S), though interactions are likely weak or transient. Arid5a enhances translational efficiency of CEBPD and IL6 among other RNAs, cumulatively promoting pathology in AGN. *P < 0.05. Source data are available for this figure: SourceData F6.
Figure 7.
Figure 7.
Arid5a binds rRNAs and facilitates protein synthesis in murine stromal cells. (a) Experimental design. Inset: ST2 cells were treated with murine IL-17 for 1, 3, or 6 h, and Arid5a and β-actin were assessed by immunoblotting, representative of two independent experiments. (b) ST2 cells were treated ± IL-17 for 3 h and lysates were subjected to RIP with anti-Arid5a Abs or IgG controls. Enrichment of rRNAs corresponding to mouse 18S, 5S, 5.8S, and 28S were determined by qPCR, normalized to untreated IgG RIP controls. Data show mean ± SEM, analyzed by one-way ANOVA with the Kruskal–Wallis test. Each symbol represents an individual experimental sample (18S n = 10; 5S, 5.8S, and 28S n = 6), pooled from two independent experiments. (c) ST2 cells were treated ± IL-17 for 3 h and lysates were subjected to fRIP-Seq by Illumina with anti-Arid5a Abs. The plot shows differentially expressed mRNAs in IL-17–treated pulldowns compared to untreated controls (n = 3–4 independent replicates). NS, not significant. (d) GSEA pathway predictions of Arid5a-fRIP-Seq, comparing untreated controls and IL-17–treated samples. FDR < 0.25, minimum gene IDs in category = 15. (e) Intersection analysis comparing orthologs in Arid5a RIP-Seq from IL-17–treated ST2 and HK-2 cells (from ). Selected genes identified in the intersection dataset. (f) ST2 cells were treated ± IL-17 for 3 h. Cytoplasmic lysates were separated by sucrose gradient fractionation. Arid5a and RPL7A were assessed in two pooled fractions per sample. Data are representative of two independent experiments. (g) ST2 cells were treated ± IL-17 for 3 h, stained with DAPI or Arid5a and RPL7A, and imaged by confocal microscopy. Arrows denote regions of co-association of Arid5a with RPL7A. Size bar = 10 µm. Quantitation of nuclear Arid5a is shown on the right. Each value represents the percentage of colocalized volume from an individual cell (n = 17–31). Analyzed by Student’s t test. *P < 0.05, ** < 0.01, *** < 0.001, **** < 0.0001. Source data are available for this figure: SourceData F7.
Figure S5.
Figure S5.
Arid5a signaling in murine stromal (ST2) cells (associated with Fig. 7). (a) ST2 cells were treated ± IL-17 for 3 h and expression of indicated mRNAs was assessed by qPCR, normalized to Gapdh. Mean ± SEM, analyzed by one-way ANOVA with post-hoc Tukey’s test. Each symbol represents one replicate. (b) PCA showing sample heterogeneity. (c) Intersection analysis comparing orthologs in Arid5a RIP-Seq from HK-2 versus ST2 cells. ***P < 0.001, **** < 0.0001.

References

    1. Amatya, N., Childs E.E., Cruz J.A., Aggor F.E.Y., Garg A.V., Berman A.J., Gudjonsson J.E., Atasoy U., and Gaffen S.L.. 2018. IL-17 integrates multiple self-reinforcing, feed-forward mechanisms through the RNA binding protein Arid5a. Sci. Signal. 11:eaat4617. 10.1126/scisignal.aat4617 - DOI - PMC - PubMed
    1. Amatya, N., Garg A.V., and Gaffen S.L.. 2017. IL-17 signaling: The yin and the Yang. Trends Immunol. 38:310–322. 10.1016/j.it.2017.01.006 - DOI - PMC - PubMed
    1. Anwar, T., Sen B., Aggarwal S., Nath R., Pathak N., Katoch A., Aiyaz M., Trehanpati N., Khosla S., and Ramakrishna G.. 2018. Differentially regulated gene expression in quiescence versus senescence and identification of ARID5A as a quiescence associated marker. J. Cell. Physiol. 233:3695–3712. 10.1002/jcp.26227 - DOI - PubMed
    1. Balamurugan, K., and Sterneck E.. 2013. The many faces of C/EBPδ and their relevance for inflammation and cancer. Int. J. Biol. Sci. 9:917–933. 10.7150/ijbs.7224 - DOI - PMC - PubMed
    1. Bechara, R., Amatya N., Bailey R.D., Li Y., Aggor F.E.Y., Li D.D., Jawale C.V., Coleman B.M., Dai N., Gokhale N.S., et al. . 2021. The m6A reader IMP2 directs autoimmune inflammation through an IL-17- and TNFα-dependent C/EBP transcription factor axis. Sci. Immunol. 6:eabd1287. 10.1126/sciimmunol.abd1287 - DOI - PMC - PubMed

Publication types

MeSH terms

LinkOut - more resources