. 2024 Aug 27;43(8):114531.
doi: 10.1016/j.celrep.2024.114531. Epub 2024 Jul 25.

The chemokine Cxcl14 regulates interneuron differentiation in layer I of the somatosensory cortex

Affiliations

The chemokine Cxcl14 regulates interneuron differentiation in layer I of the somatosensory cortex

Andrew F Iannone et al. Cell Rep. .

Abstract

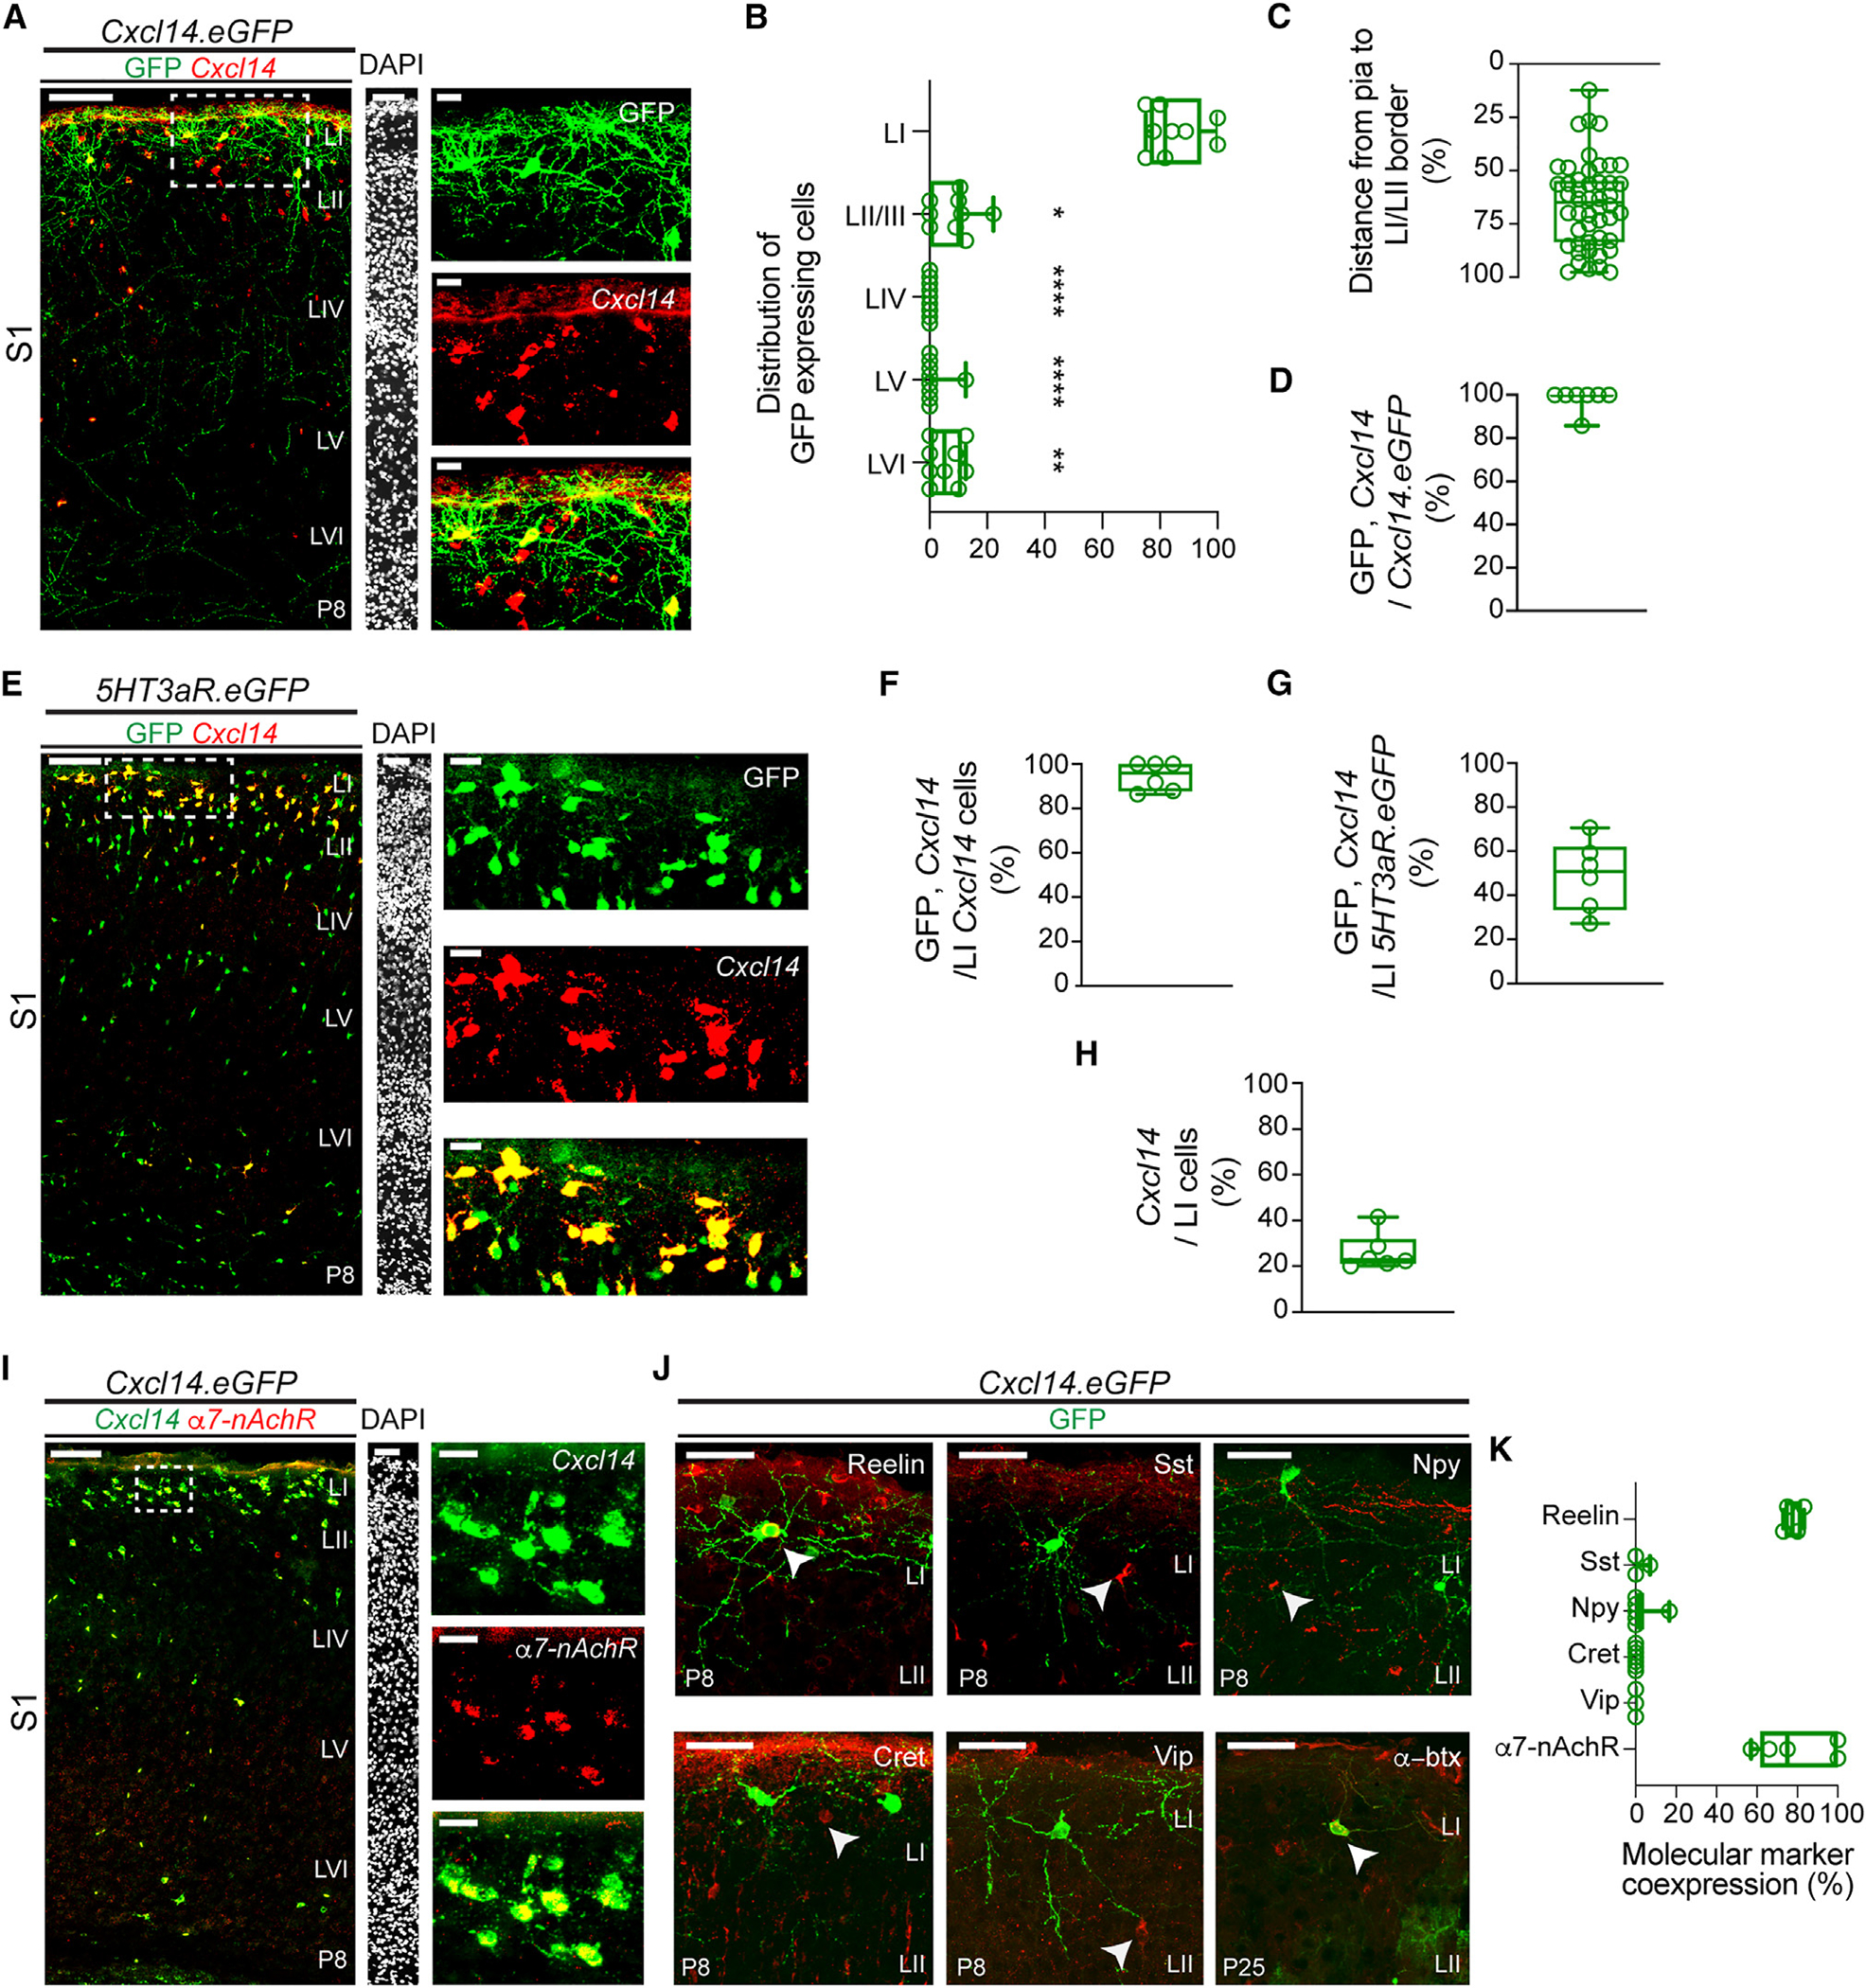
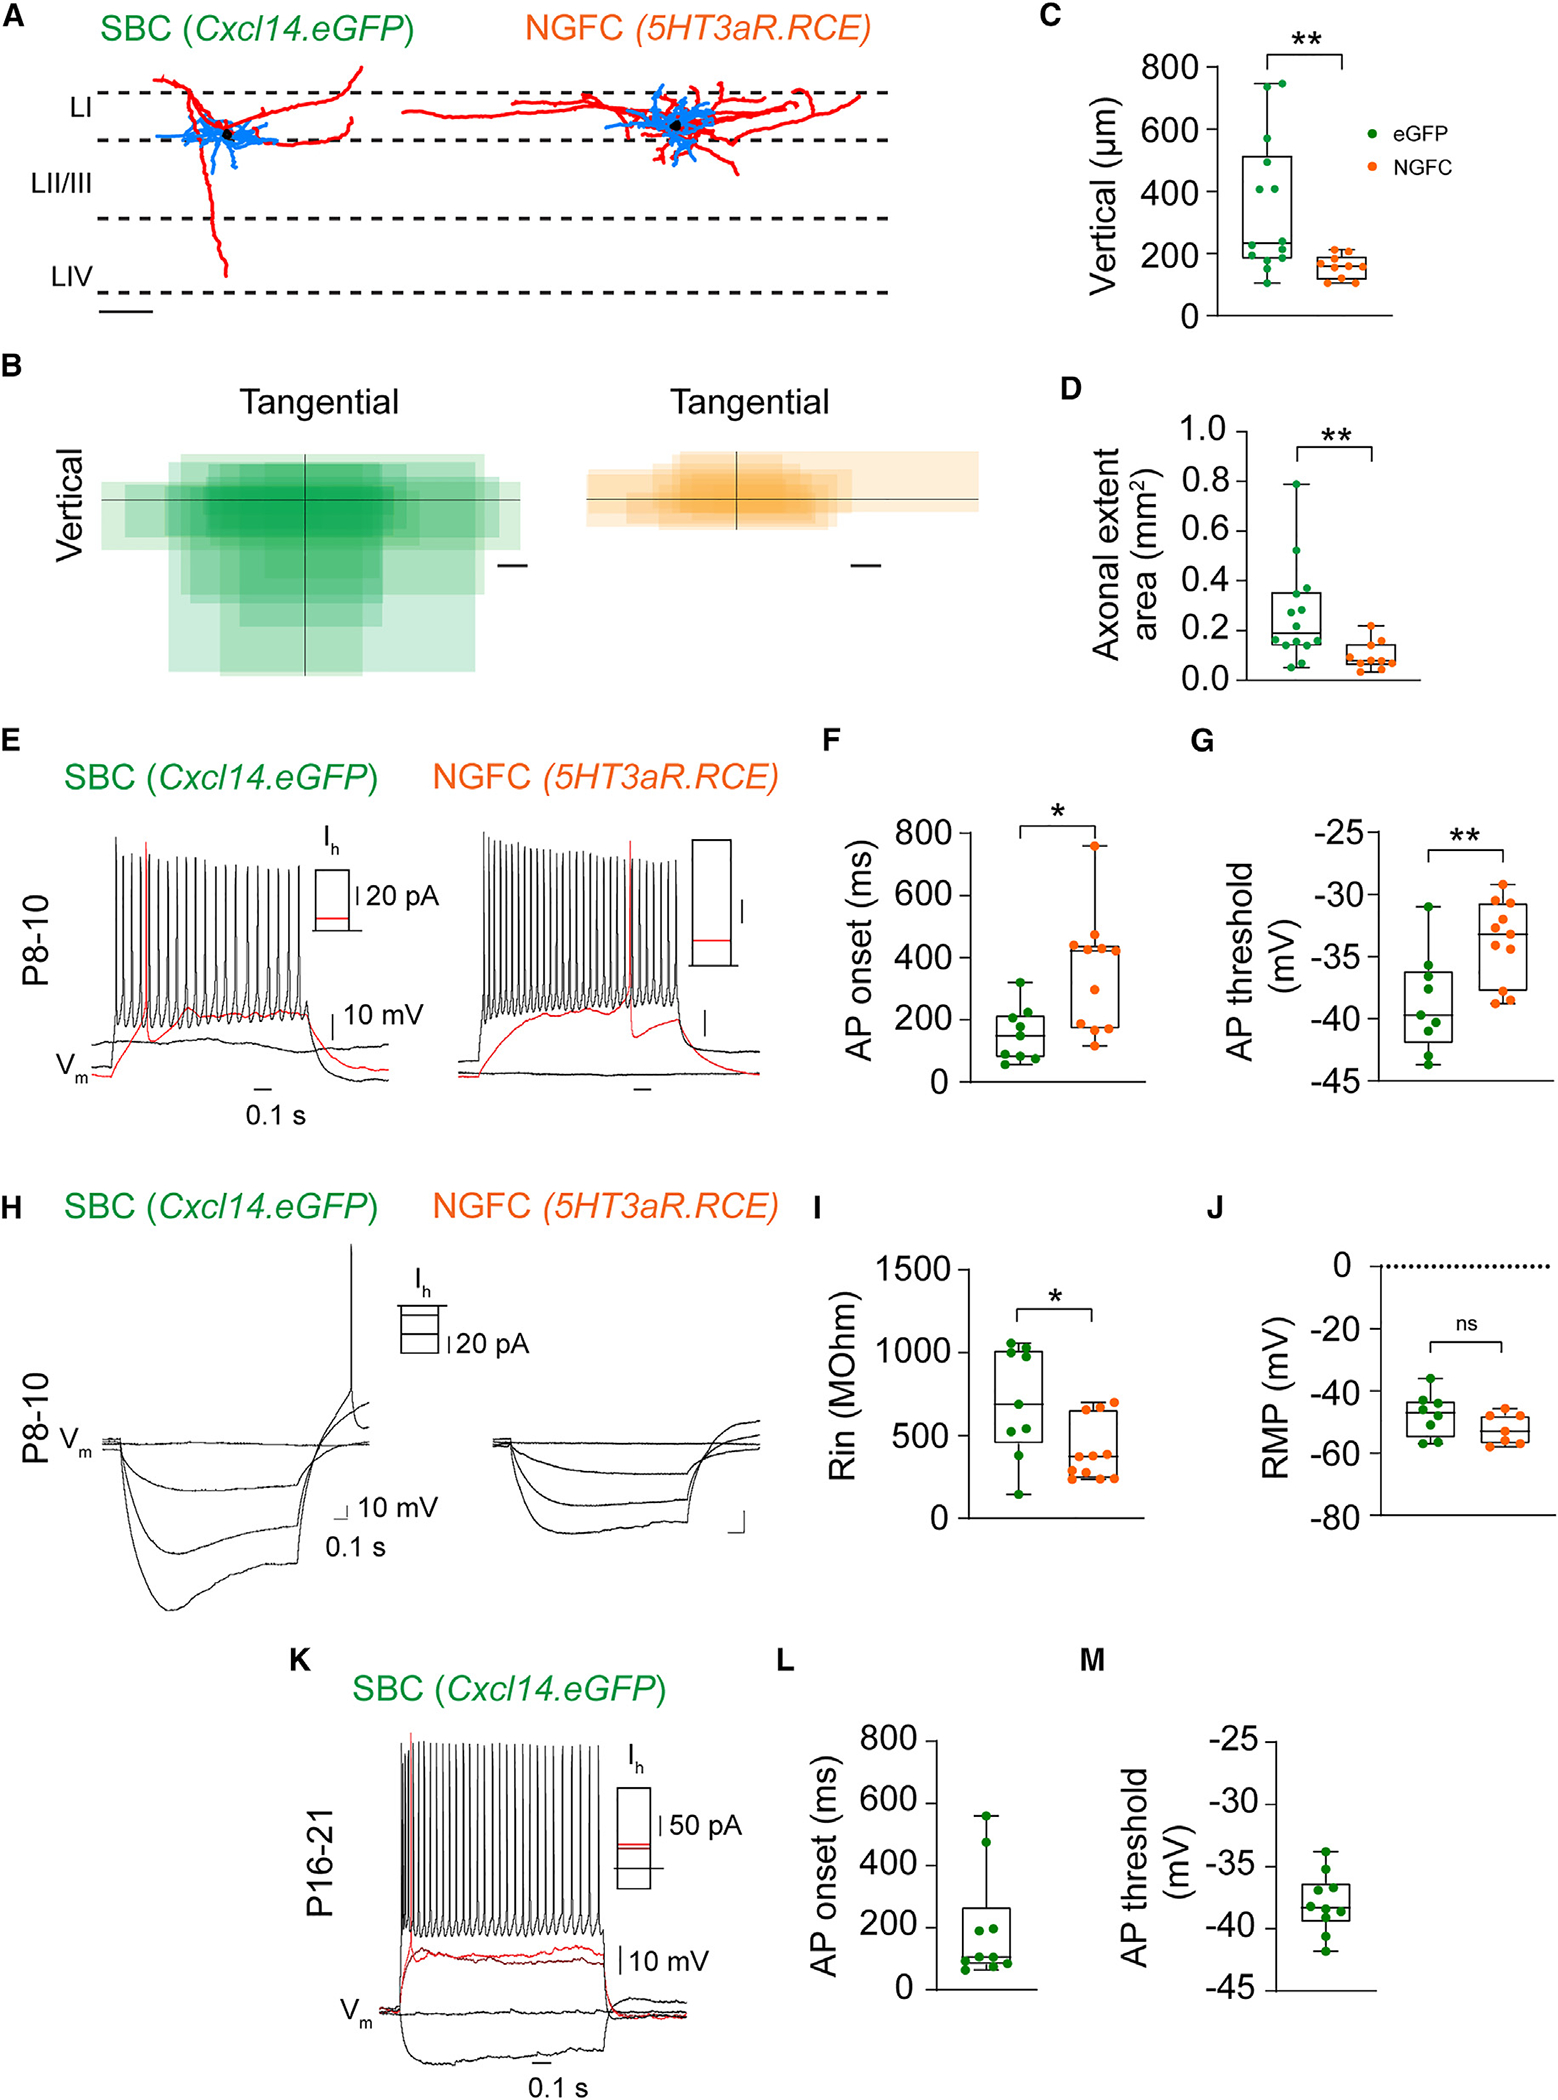
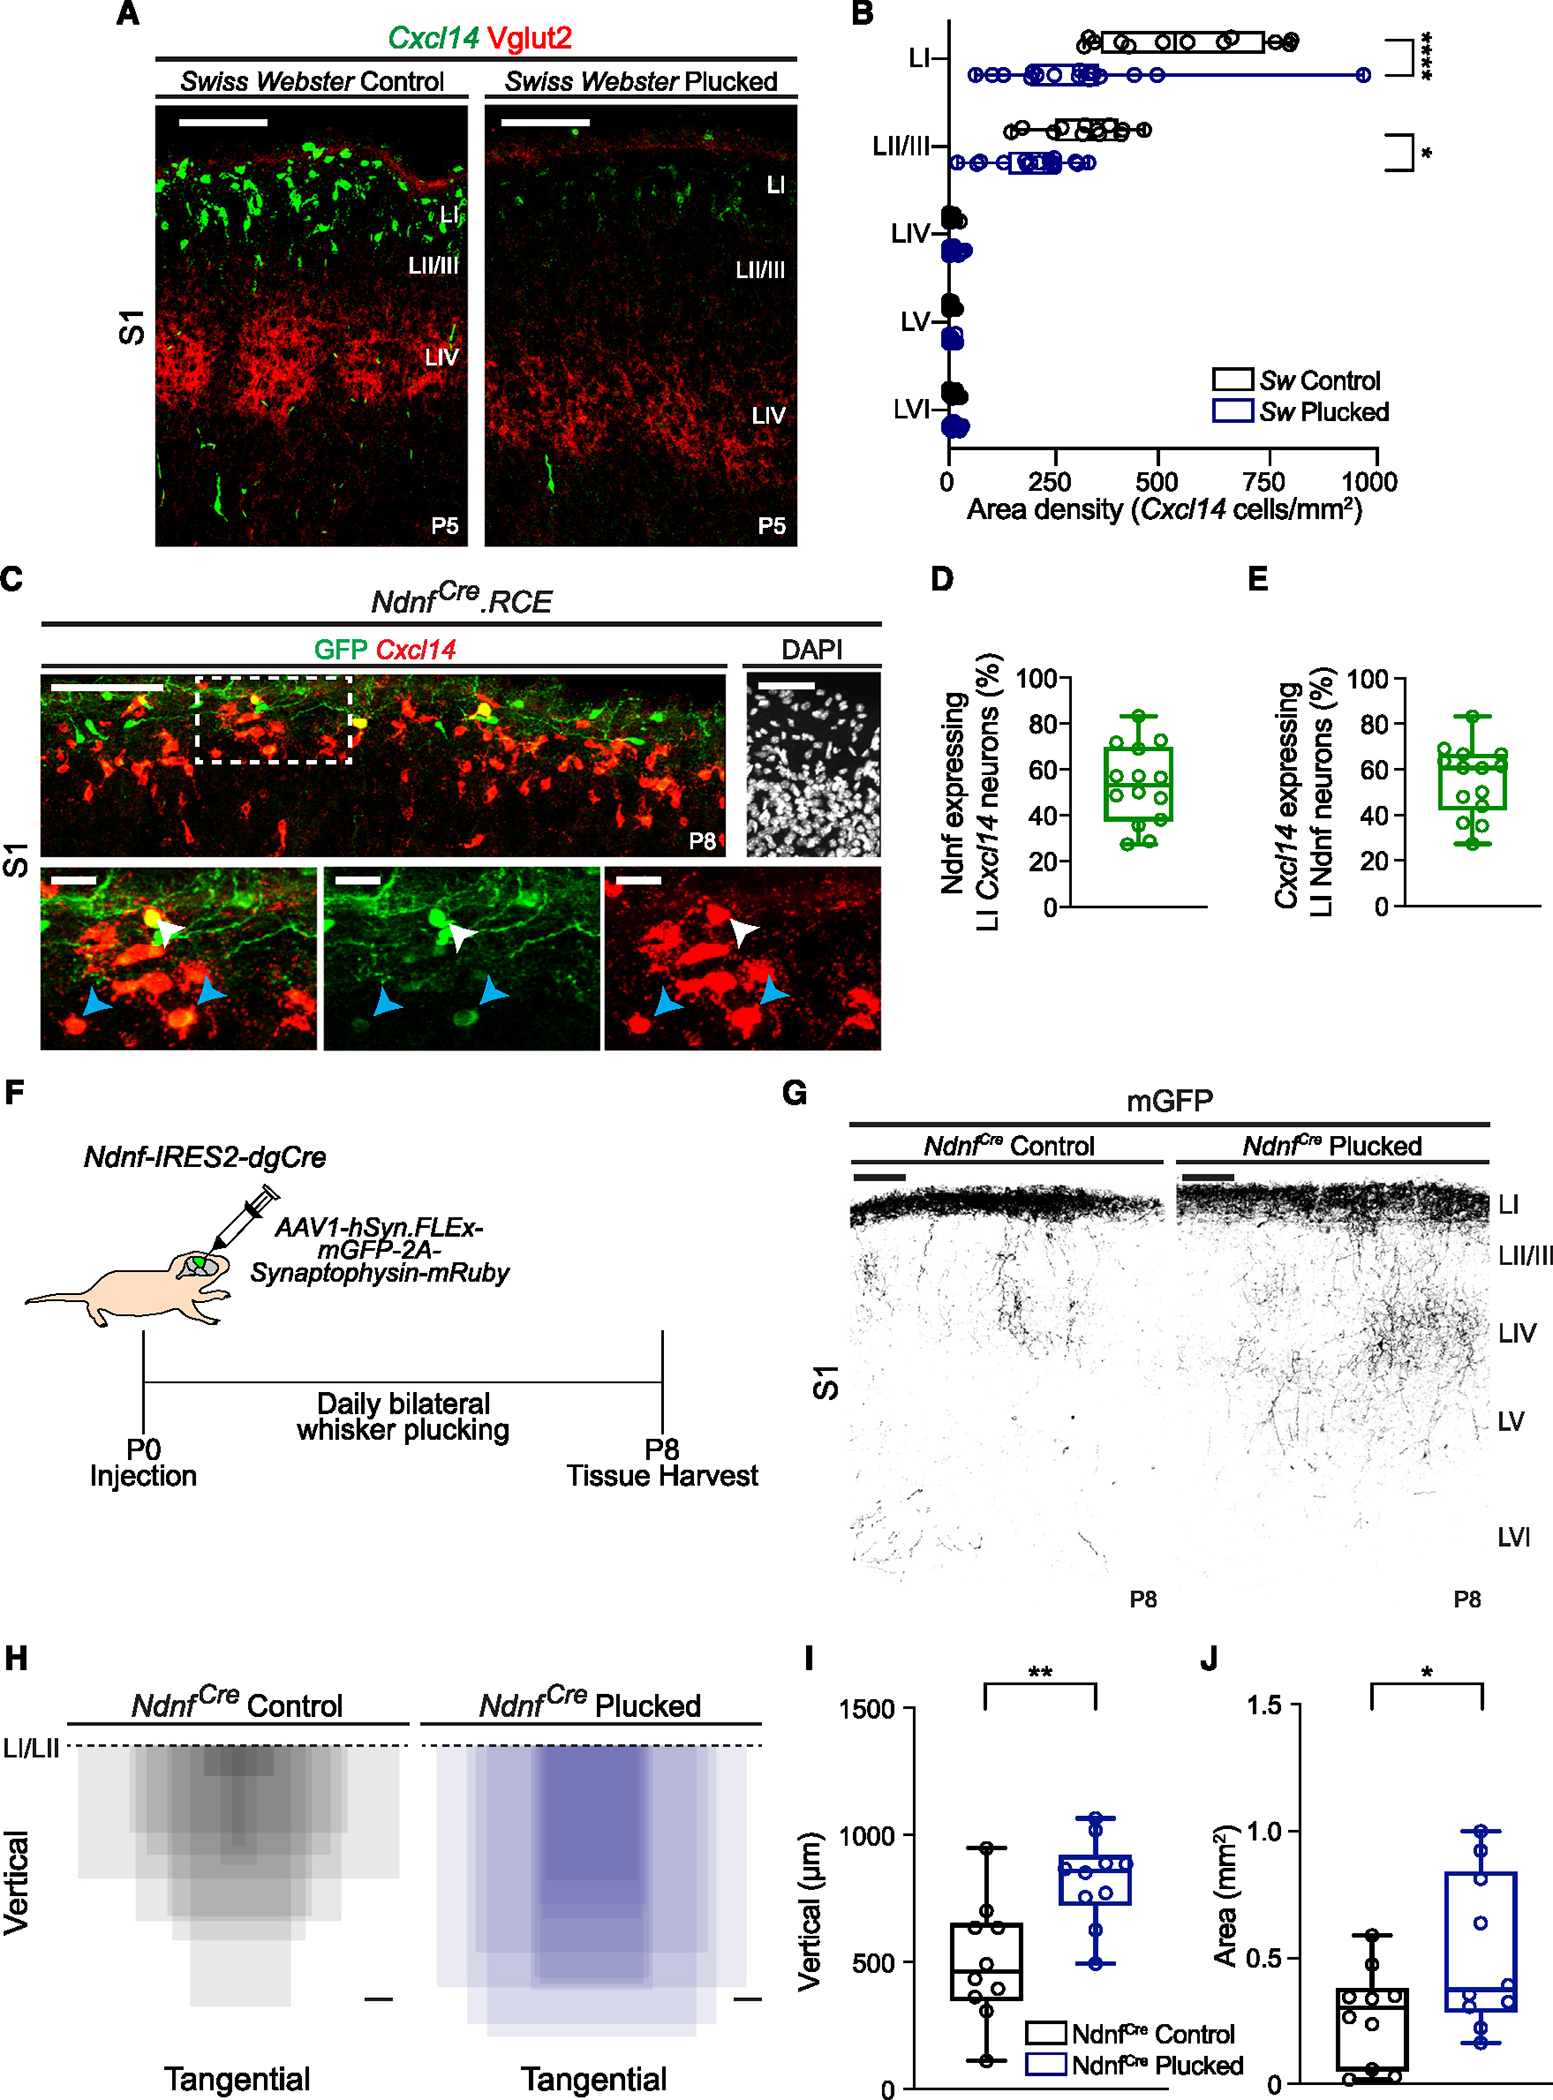
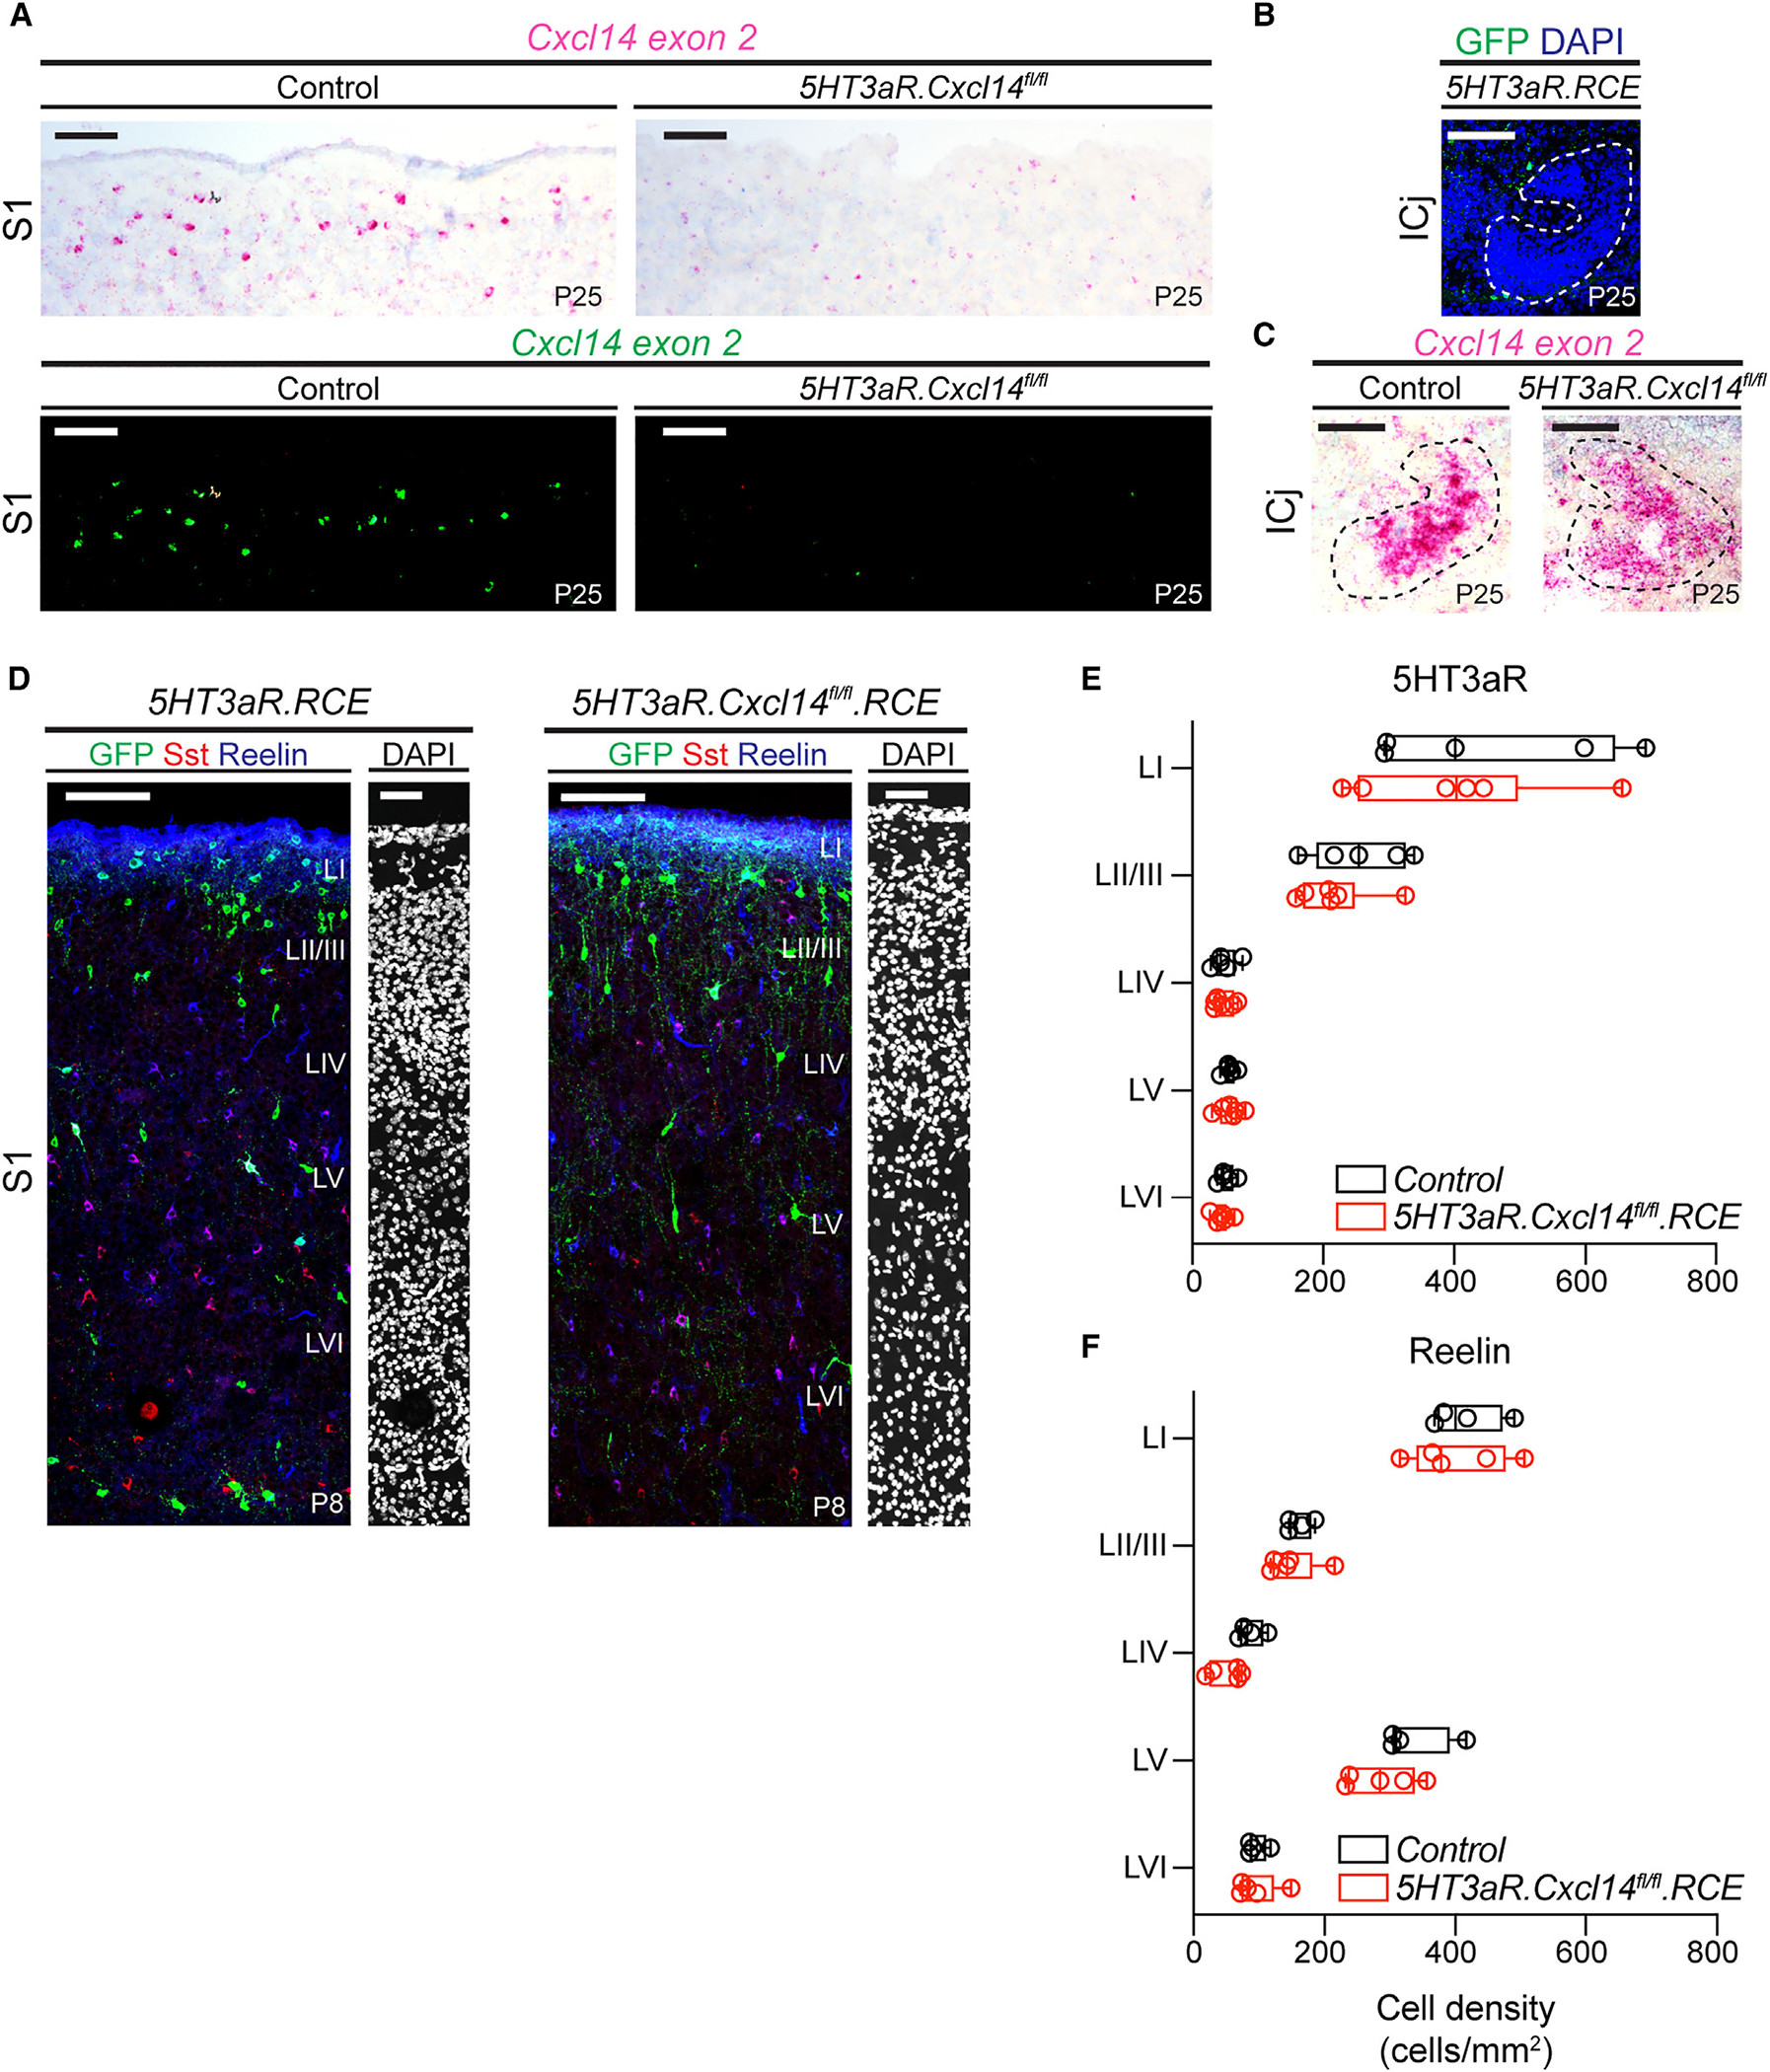
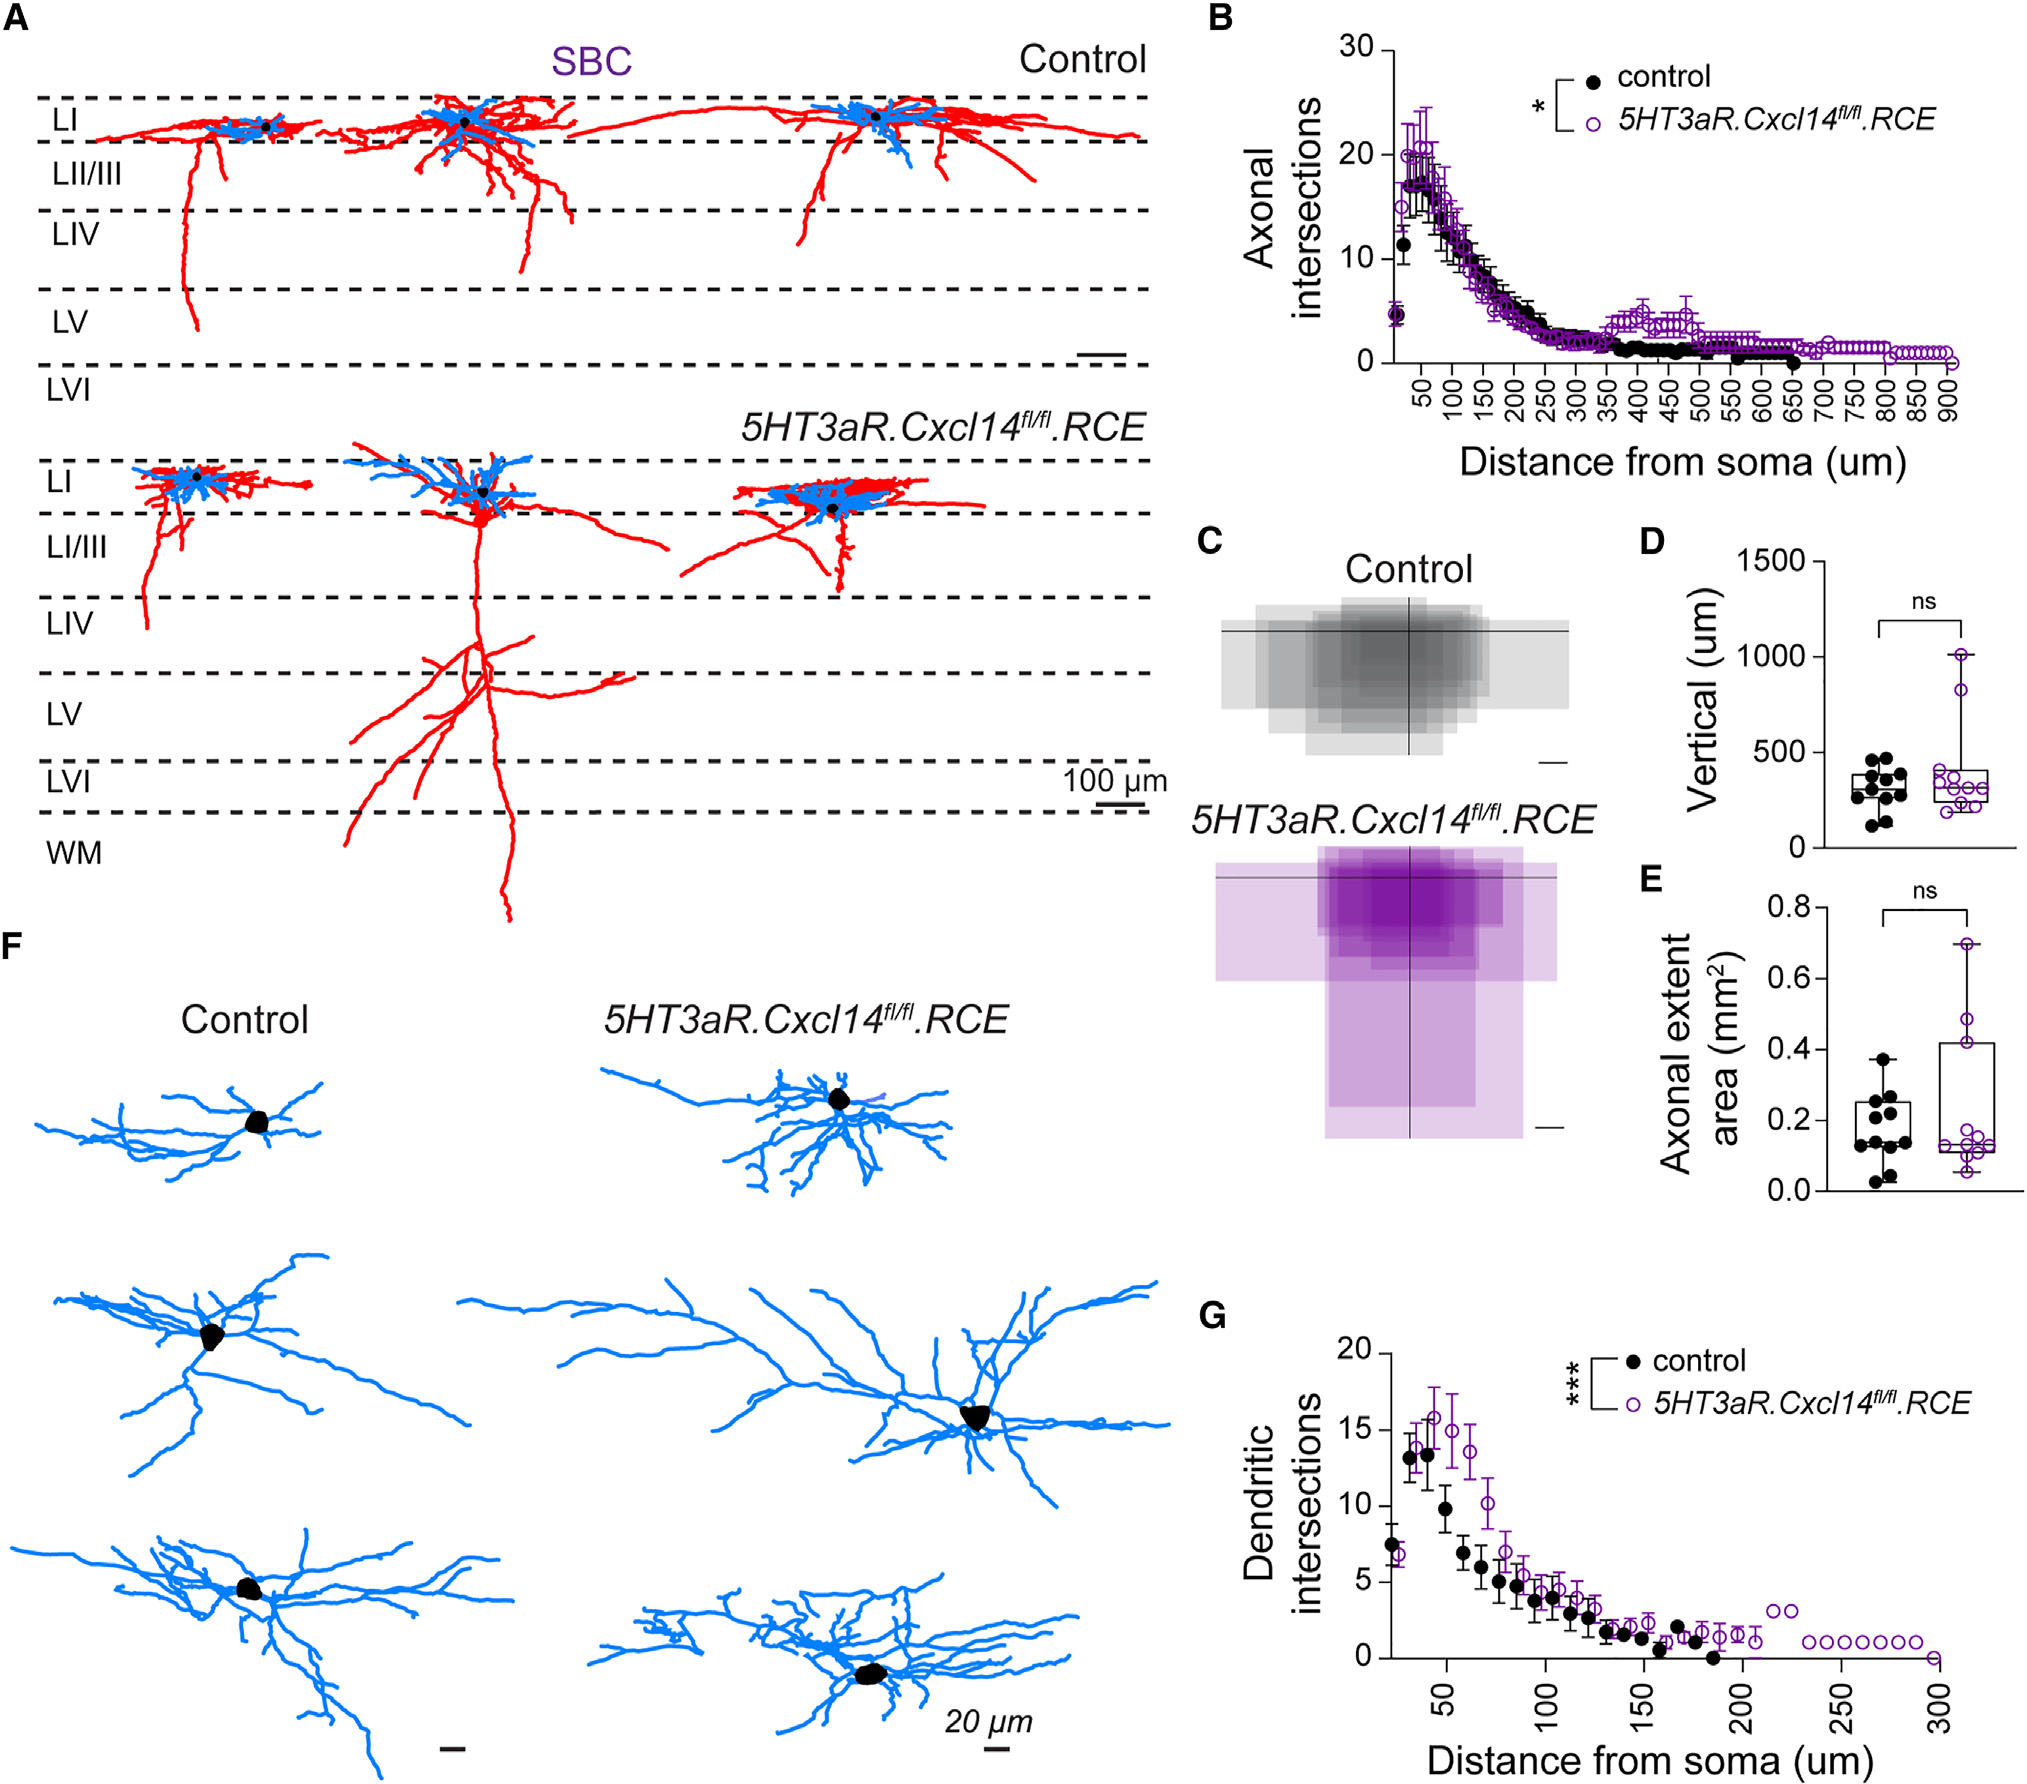
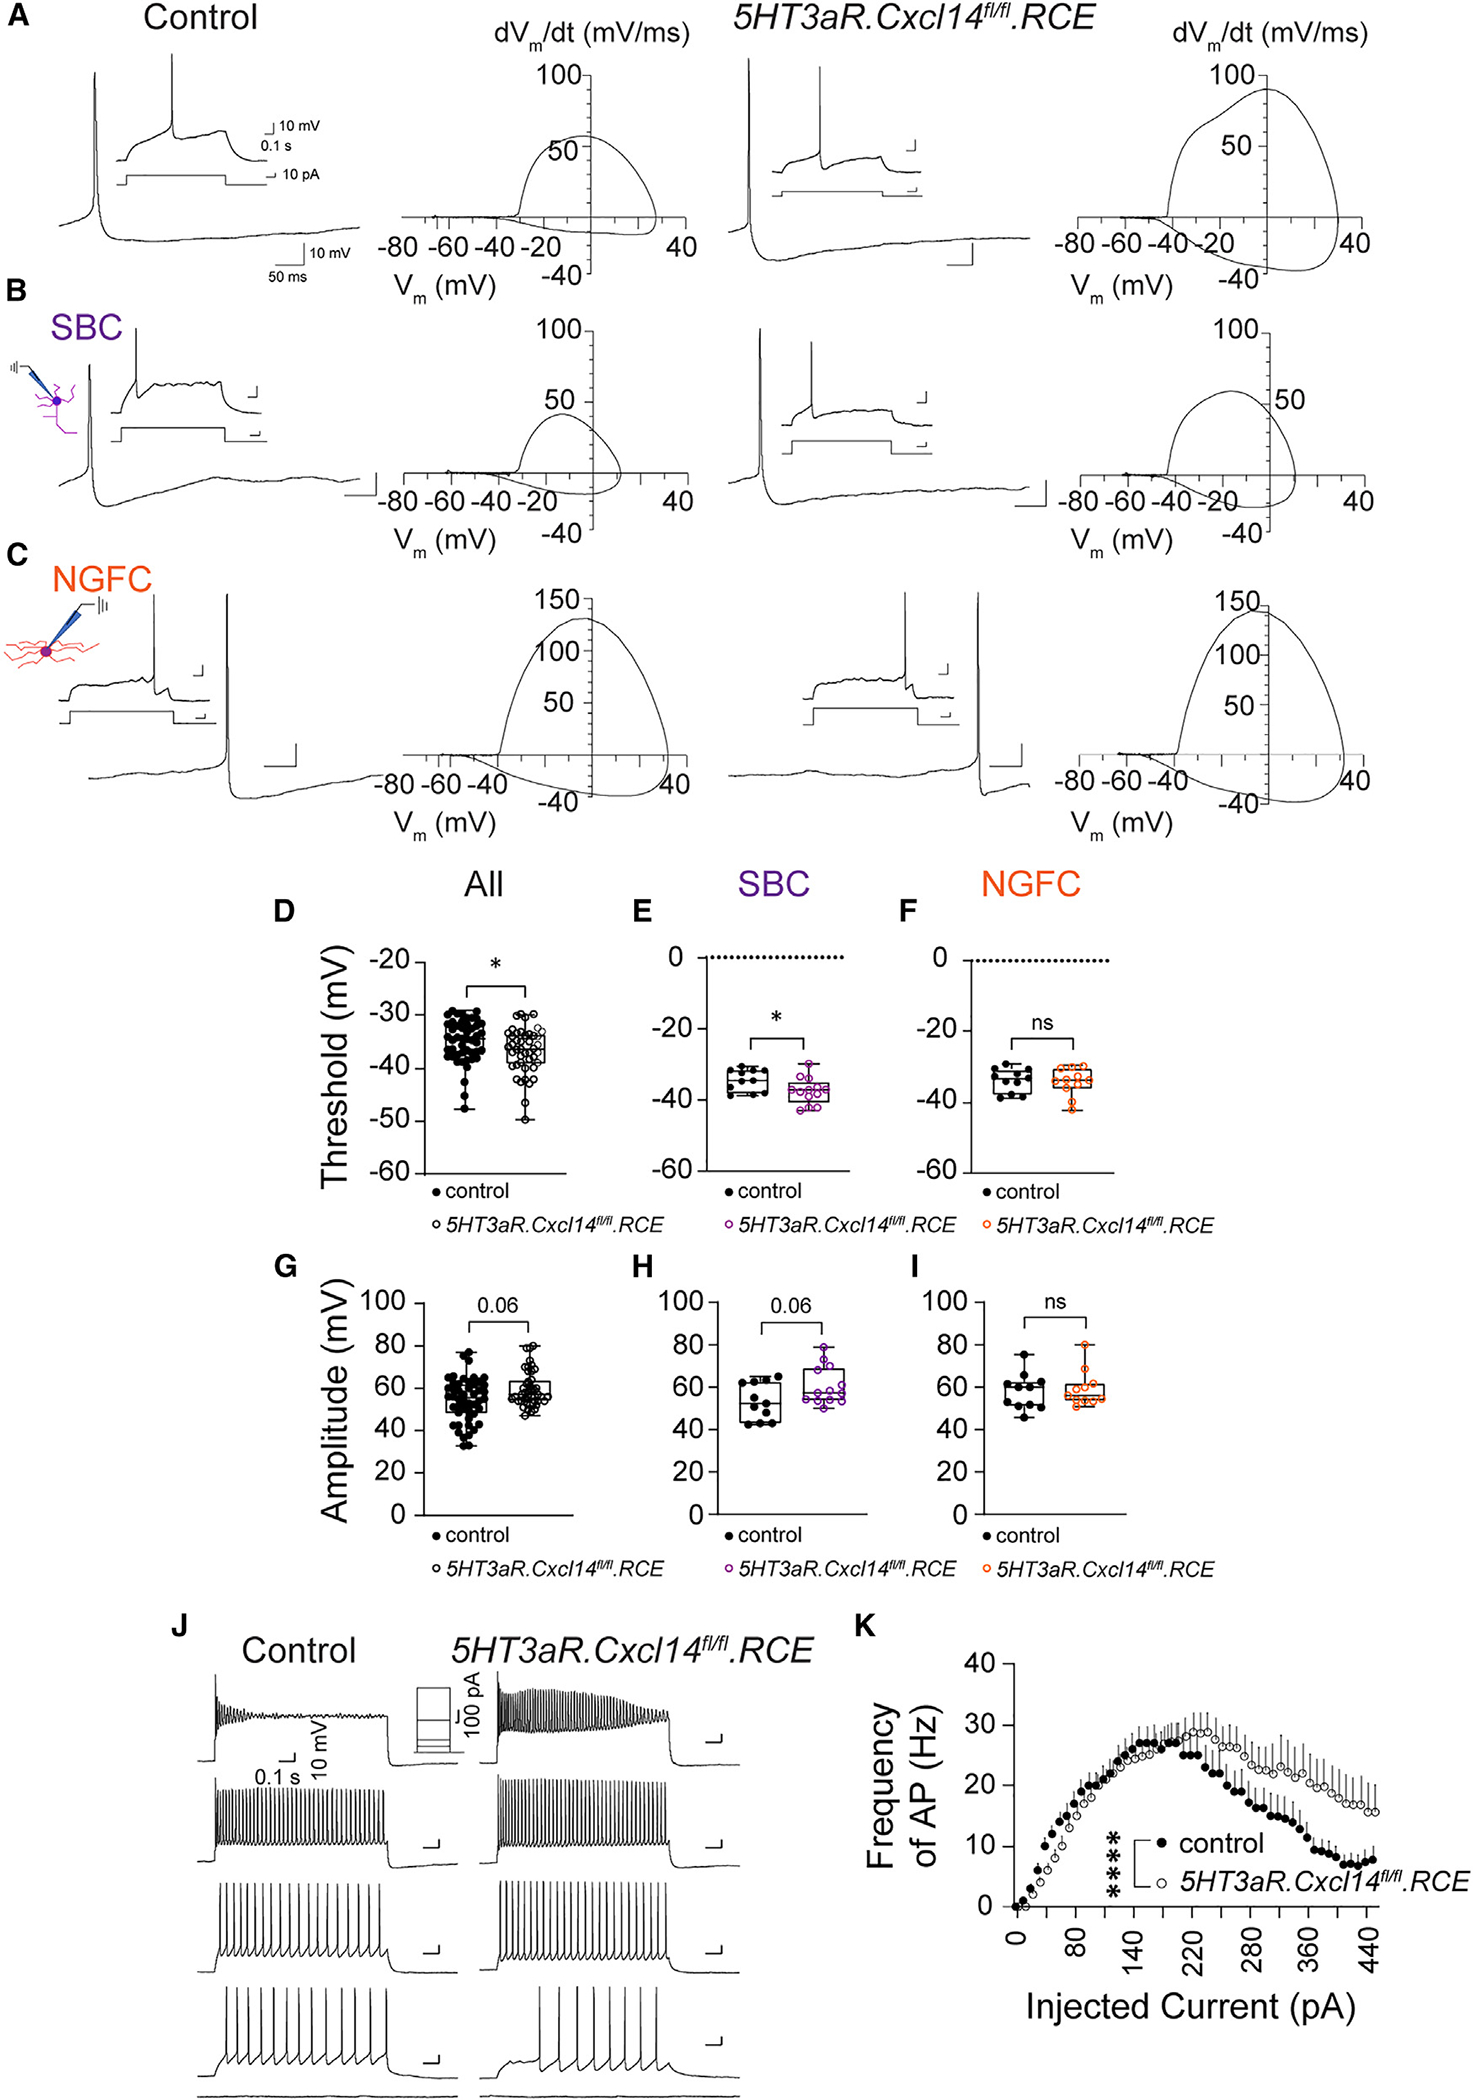
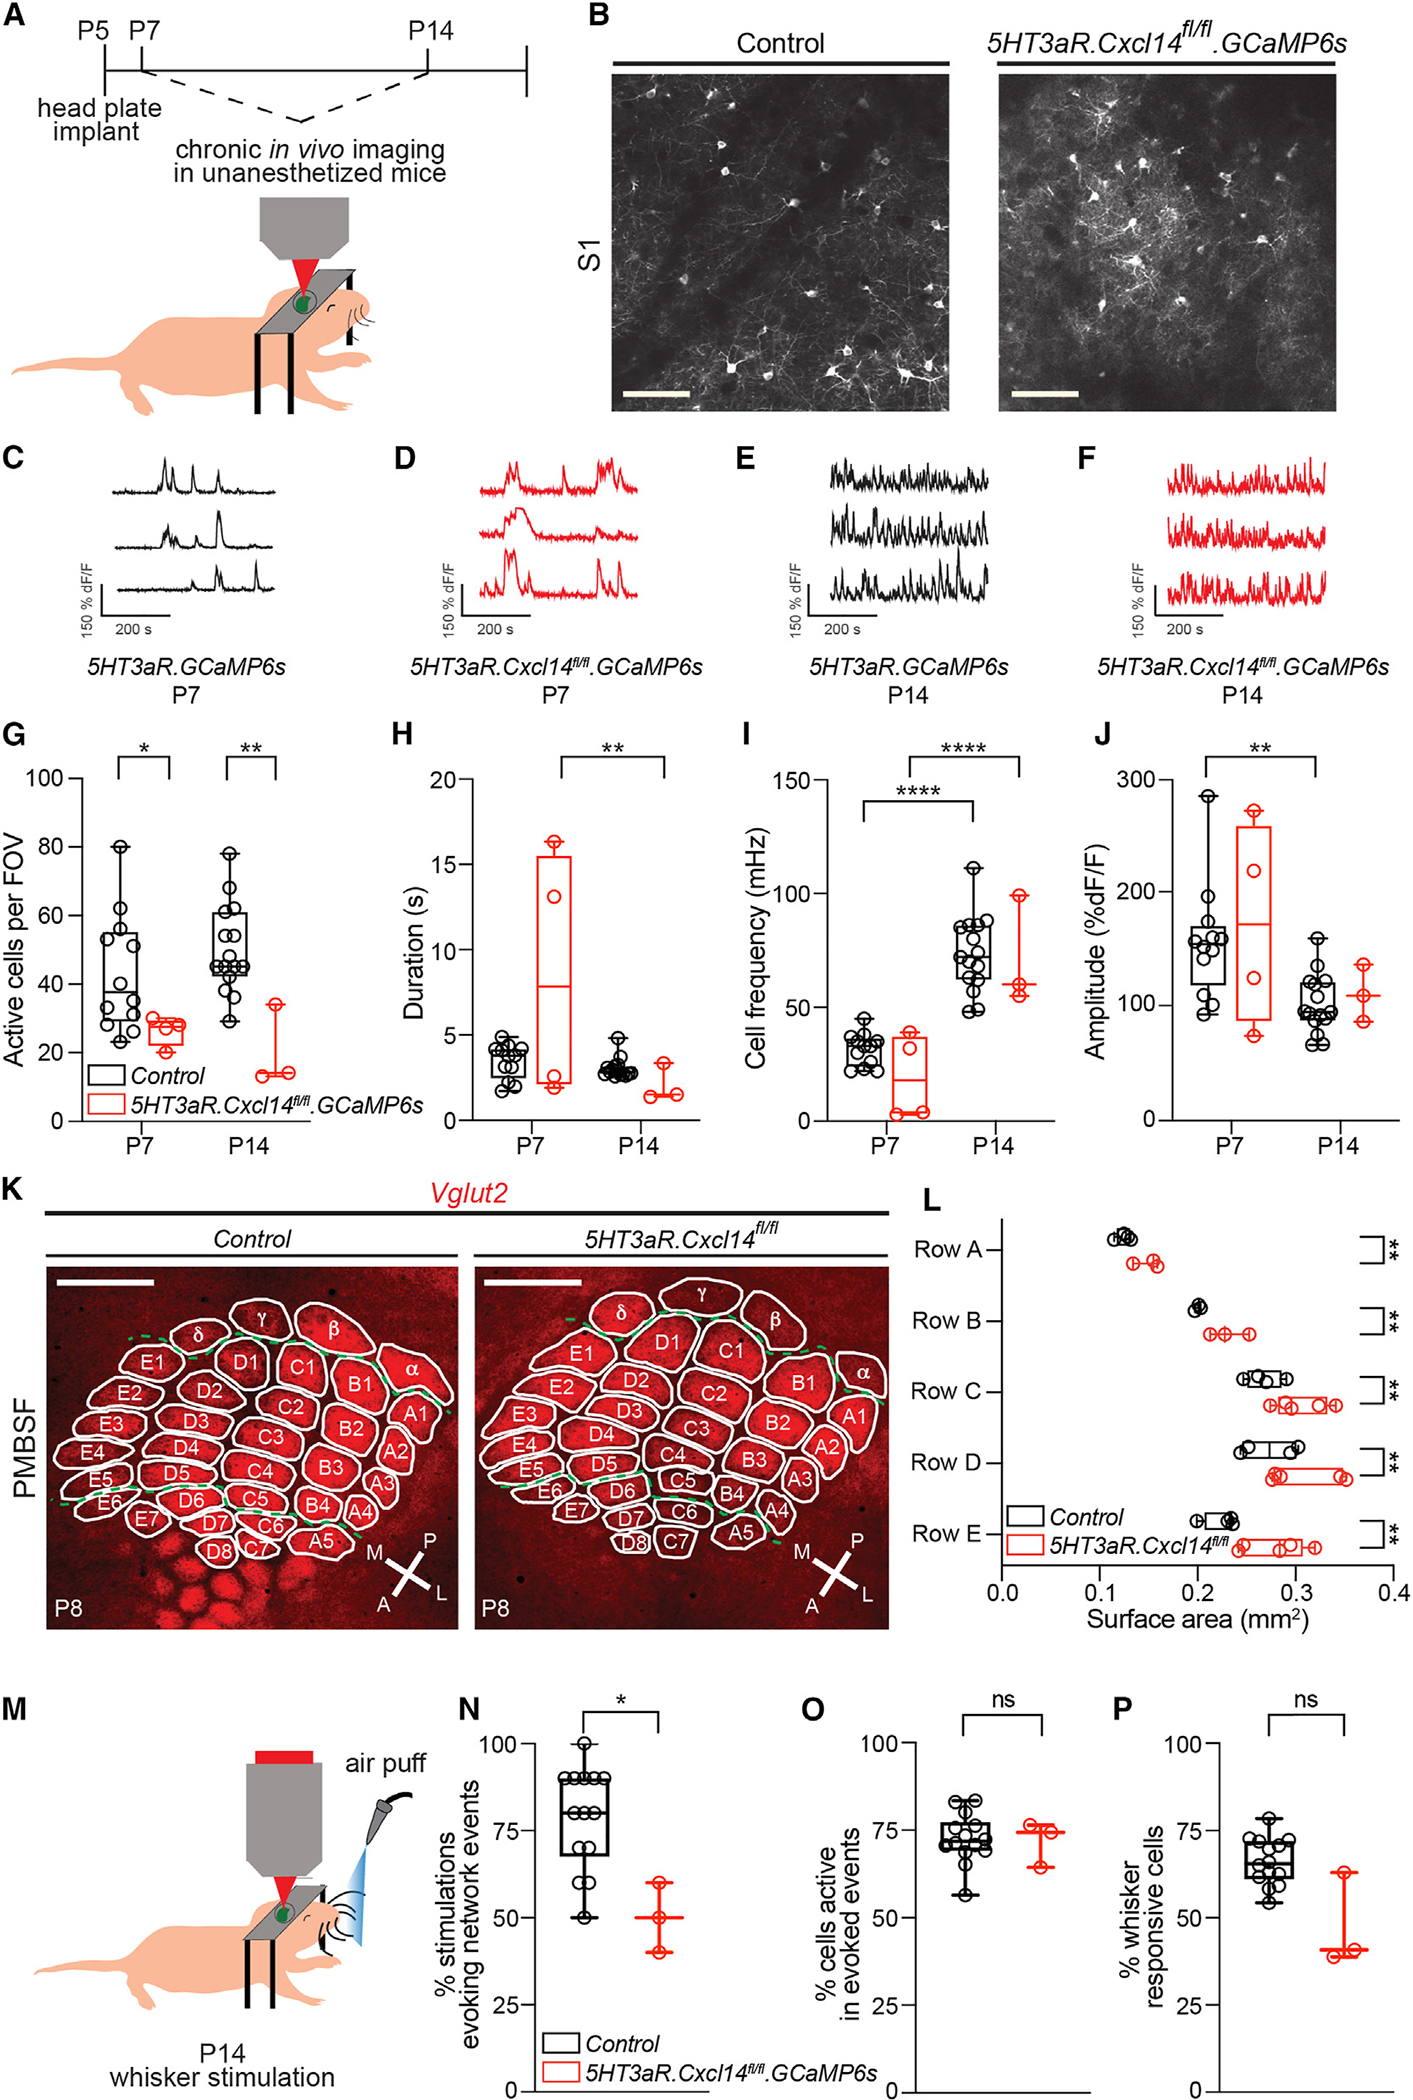
Spontaneous and sensory-evoked activity sculpts developing circuits. Yet, how these activity patterns intersect with cellular programs regulating the differentiation of neuronal subtypes is not well understood. Through electrophysiological and in vivo longitudinal analyses, we show that C-X-C motif chemokine ligand 14 (Cxcl14), a gene previously characterized for its association with tumor invasion, is expressed by single-bouquet cells (SBCs) in layer I (LI) of the somatosensory cortex during development. Sensory deprivation at neonatal stages markedly decreases Cxcl14 expression. Additionally, we report that loss of function of this gene leads to increased intrinsic excitability of SBCs-but not LI neurogliaform cells-and augments neuronal complexity. Furthermore, Cxcl14 loss impairs sensory map formation and compromises the in vivo recruitment of superficial interneurons by sensory inputs. These results indicate that Cxcl14 is required for LI differentiation and demonstrate the emergent role of chemokines as key players in cortical network development.

Keywords: CP: Neuroscience; barrel cortex; chemokines; development; interneurons; layer I; sensory inputs.


Conflict of interest statement

Declaration of interests The authors declare no competing interest.

Figures

Figure 1.
Figure 1.. Cxcl14 expression delineates a subtype of layer I interneurons
(A) Overlay of Cxcl14 in situ hybridization and GFP fluorescent signals in Cxcl14.eGFP mice at P8 in primary somatosensory cortex (S1); scale bar, 100 μm (left). Layer boundaries were determined by DAPI labeling; scale bar, 50 μm (middle). Enlarged detail of area delineated by the dotted box shows expression of GFP (top right), Cxcl14 transcript (middle right), and merged (bottom right); scale bars, 20 μm. (B) Percentage distribution by layer of GFP-expressing cells in Cxcl14.eGFP mice at P8 in S1 (n = 10 mice). Kruskal-Wallis test (****p < 0.0001) followed by Dunn’s multiple comparisons test of laminar distribution; LI vs. LII/III, *p = 0.0443; LI vs. LIV, ****p < 0.0001; LI vs. LV, ****p < 0.0001; LI vs. LVI, **p = 0.008. All other comparisons are non-significant. (C) Distribution of individual GFP-expressing cells in LI as a percentage of the depth from the pial border (0%) to the LI/LII border (100%). Cxcl14.eGFP n = 48 cells, 7 mice. (D) Percentage of cells that co-express Cxcl14 and GFP over the total number of GFP-expressing cells in LI of Cxcl14.eGFP mice at P8. n = 7 sections, 2 mice. (E) Expression of Cxcl14 transcript in 5HT3aR.eGFP mice at P8 in S1; scale bar, 100 μm (left). DAPI; scale bar, 50μm (middle). Enlarged detail of area delineated by the dotted box shows expression of GFP (top right), Cxcl14 transcript (middle right), and merged (bottom right); scale bars, 20 μm. (F) Percentage of cells that co-express GFP and Cxcl14 over the total number of Cxcl14-expressing cells in LI of 5HT3aR.eGFP mice at P8. n = 6 sections, 2 mice. (G) Percentage of cells that co-express GFP and Cxcl14 over the total number of 5HT3aR.eGFP-expressing cells in LI at P8. n = 6 sections, 2 mice. (H) Percentage of Cxcl14-expressing cells over the total number of LI cells revealed by DAPI at P8. n = 6 sections, 2 mice. (I) Overlap of Cxcl14 and α7-nAChR transcripts in LI of Cxcl14.eGFP mice (GFP expression omitted for clarity) at P8 in S1; scale bar, 100 μm (left). DAPI; scale bar, 50 μm (middle). Enlarged detail of area delineated by the dotted box shows expression of Cxcl14 transcript (top right, pseudocolored green), α7-nAChR transcript (middle right), and merged (bottom right); scale bars, 20 μm. n = 6 sections, 1 mouse. (J) Immunohistochemical staining for reelin (top left), somatostatin (Sst, top middle), neuropeptide Y (Npy, top right), calretinin (Cret, bottom left), and vasoactive intestinal peptide (Vip, bottom middle) in Cxcl14.eGFP mice at P8 in S1. Expression of the α7 subunit of the nicotinic acetylcholine receptor (α7-nAChR) revealed through fluorescently labeled α-bungarotoxin (α-btx, bottom right) in Cxcl14.eGFP mice at P25; scale bars, 20 μm. (K) Molecular marker expression in GFP+ LI interneurons of Cxcl14.eGFP mice at P8 (reelin, Sst, Npy, Cret, Vip) or P25 (α7-nAChR). Reelin, n = 4 mice; Sst, n =3 mice; Npy, n = 6 mice; Cret, n = 7 mice; Vip, n = 3 mice; α7-nAChR, n = 5 sections, 2 mice. Data are represented as box-and-whisker plots from minimum to maximum range (whiskers) with interquartile ranges (box). See also Figures S1 and S2.
Figure 2.
Figure 2.. Early functional specification of layer I interneuron subtypes
(A) Representative morphological reconstruction of a single-bouquet cell (SBC) (left) and a neurogliaform cell (NGFC, right) in Cxcl14.eGFP and 5HT3aR.RCE mice, respectively, at P8–P10 in S1. Dashed lines demarcate layer borders (LI, LII/III, and LIV). Scale bar, 100 αm. Blue, dendrite; red, axon; black, soma. (B) Summary of axonal extent in SBC (green) and NGFC (orange) interneurons with respect to the dura. Soma location is represented by the intersection of black lines. SBC, n = 14 cells, 8 mice; NGFC, n = 10 cells, 9 mice; scale bars, 100 μm. (C) Vertical axonal length. Unpaired t test, n = 14 SBCs, 8 mice, vs. n = 10 NGFCs, 9 mice; **p = 0.0048. (D) Axonal areal extent. Unpaired t test, n = 14 SBCs, 8 mice, vs. n = 10 NGFCs, 9 mice; **p = 0.0091. (E) Representative voltage traces (Vm) of an LI SBC (left) and LI NGFC (right) recorded at resting state (~ −65 mV) in Cxcl14.eGFP and 5HT3aR.RCE mice, respectively, at P8–P10. Rheobase trace (red; SBC, 10 pA; NGFC, 10 pA) and action potential (AP) train at ~30 Hz (SBC, 70 pA; NGFC, 50 pA). (F) AP onset. Mann-Whitney test of SBCs (n = 9 cells, 3 mice) vs. NGFCs (n = 11 cells, 6 mice); *p = 0.013. (G) AP threshold. Unpaired t test of SBCs (n = 9 cells, 3 mice) vs. NGFCs (n = 11 cells, 6 mice); **p = 0.007. (H) Representative voltage traces at resting (flat traces) and hyperpolarizing states in Cxcl14.eGFP mice at P8–P10. A single spike was observed in three of seven GFP-expressing interneurons following hyperpolarizing stimulation and was absent in the NGFC group. Current stimulation protocol: −50, −30, −10, and 0 pA. (I) Input resistance. Mann-Whitney test of SBCs (n = 9 cells, 3 mice) vs. NGFCs (n = 11 cells from 6 mice); *p = 0.038. (J) Resting membrane potential. Unpaired t test of SBCs (n = 9 cells, 3 mice) vs. NGFCs (n = 11 cells, 6 mice); non-significant (ns). (K) Representative voltage traces recorded in current clamp at resting state in Cxcl14.eGFP mice at P16–P21. Rheobase trace (red; SBC, 52 pA) and AP train at ~30 Hz (SBC, 200 pA). (L) AP onset. Cxcl14.eGFP, n = 10 cells, 3 mice. (M) AP threshold. Cxcl14.eGFP, n = 10 cells, 3 mice. Data are represented as box-and-whisker plots from minimum to maximum range (whiskers) with interquartile range (box). See also Table S1.
Figure 3.
Figure 3.. Cxcl14 expression is reliant on sensory inputs during development
(A) Cxcl14 expression in Swiss Webster (Sw) littermate control (left) and daily whisker-plucked (right) pups at P5 in S1; scale bars, 100 μm. VGlut2 labels thalamocortical axon afferents. (B) Layer distribution of Cxcl14-expressing cells in control (n = 12 sections, 3 mice) and whisker-plucked (n = 16 sections, 4 mice) pups. Two-way ANOVA (****pwhisker status < 0.0001) with Sidák’s multiple comparisons test of control vs. whisker-plucked by layer; LI, ****p < 0.0001; LII/III, *p = 0.011. All other comparisons are non-significant. (C) Co-expression of GFP and Cxcl14 in NdnfCre.RCE mice at P8. Scale bar, 100 μm. DAPI; scale bar, 50 μm (top right). Detail of the area in the dotted box shows expression of merged (bottom left), GFP (bottom middle), and Cxcl14 transcript (bottom right); scale bars, 20 μm. White arrowheads, Ndnf cells that robustly co-express Cxcl14; blue arrowheads, Ndnf cells with weak Cxcl14 expression. (D) Percentage of LI Cxcl14 cells that co-express GFP in NdnfCre.RCE mice at P8 in S1. n = 14 sections, 4 mice. (E) Percentage of LI GFP cells that co-express Cxcl14 in NdnfCre.RCE mice at P8 in S1. n = 14 sections, 4 mice. (F) Schematic of experimental approach for the anatomical tracing of axonal terminals in NdnfCre mice undergoing daily bilateral whisker plucking. (G) Representative images of mGFP-labeled axonal collaterals of Ndnf LI interneurons at P8 (inverted images). Scale bars, 100 μm. (H) Axonal extent of Ndnf LI interneurons with respect to the LI/LII border (dashed line). Control, n = 10 mice; plucked, n = 10 mice; scale bars, 100 μm. (I) Vertical axonal depth. Unpaired t test of controls (n = 10 mice) vs. plucked (n = 10 mice); **p = 0.003. (J) Axonal extent in S1. Unpaired t test of controls (n = 10 mice) vs. plucked (n = 10 mice); *p = 0.046. Data are represented as box-and-whisker plots from minimum to maximum range (whiskers) with interquartile ranges (box). See also Figure S3.
Figure 4.
Figure 4.. Normal laminar migration after loss of Cxcl14 function in superficial interneurons
(A) Representative images of LI in 5HT3aR.RCE (left, control) and 5HT3aR.Cxcl14fl/fl.RCE (right, mutant) mice at P25, following in situ hybridization with a probe specific for Cxcl14 exon 2 (top). Tissue counterstained with hematoxylin. Images with probe labeling isolated and color inverted (bottom). Control, n = 4 sections, 2 mice; mutant, n = 3 sections, 2 mice; scale bars, 100 μm. S1, primary somatosensory cortex. (B) GFP expression in a major island of Calleja (ICj; dotted outline) in a 5HT3aR.RCE mouse at P25; scale bar, 100 μm. (C) Cxcl14 expression in an ICj (dotted outline) from a control (left) and a mutant (right) mouse at P25; scale bar, 100 μm. (D) Representative images of interneuron distribution in 5HT3aR.RCE (control, left) and 5HT3aR.Cxcl14fl/fl.RCE (mutant, right) mice at P8 in S1. Left images, scale bars, 100 μm; DAPI, scale bars, 50 μm. (E) Layer distribution of GFP-expressing interneurons (cell density [cells/mm2] across cortical layers) in 5HT3aR.RCE and 5HT3aR.Cxcl14fl/fl.RCE mice at P8.Two-way ANOVA with Sidák’s multiple comparisons test of control (n = 5 mice) vs. mutant (n = 6 mice) by layer; all genotype comparisons by layer are non-significant. (F) Layer distribution of reelin-expressing interneurons in 5HT3aR.RCE and 5HT3aR.Cxcl14fl/fl.RCE mice at P8. Two-way ANOVA with Sidák’s multiple comparisons test of control (n = 4 mice) vs. mutant (n = 5 mice) by layer; all genotype comparisons by layer are non-significant. Data are represented as box-and-whisker plots from minimum to maximum range (whiskers) with interquartile ranges (box). See also Figures S4 and S5.
Figure 5.
Figure 5.. Cxcl14 loss leads to increased tortuosity in neuronal processes of single-bouquet cells
(A) Representative reconstructions of SBCs from 5HT3aR.RCE (control, top) and 5HT3aR.Cxcl14fl/fl.RCE (mutant, bottom) mice at P8–P10 in S1. Dashed lines demarcate layer borders; scale bars, 100 μm. Blue, dendrite; red, axon; black, soma. (B) Scholl analysis for axonal complexity. Two-way ANOVA of control (n = 11 cells, 7 mice) vs. mutant (n = 11 cells, 8 mice); *p = 0.037. (C) Summary of axonal extent in 5HT3aR.RCE (control, top) and 5HT3aR.Cxcl14fl/fl.RCE (mutant, bottom) with respect to the dura. Soma location is represented by the intersection of black lines. Control, n = 11 cells, 7 mice; mutant, n = 11 cells, 8 mice; scale bars, 100 μm. (D) Vertical axonal length. Unpaired t test of control (n = 11 cells, 7 mice) vs. mutant (n = 11 cells, 8 mice); non-significant (ns). (E) Axonal areal extent. Unpaired t test of control (n = 11 cells, 7 mice) vs. mutant (n = 11 cells, 8 mice); non-significant (ns). (F) High-magnification depiction of dendritic trees from cells shown in (A); scale bars, 20 μm. (G) Dendritic Scholl analysis. Two-way ANOVA of control (n = 11 cells, 7 mice) vs. mutant (n = 11 cells, 8 mice); ***p < 0.0008. Data are represented as box-and-whisker plots from minimum to maximum range (whiskers) with interquartile ranges (box). See also Figures S6 and S7.
Figure 6.
Figure 6.. Developmental loss of Cxcl14 leads to increased excitability of SBCs
(A) Representative voltage trace of a single action potential (AP) fired at rheobase by an LI interneuron in 5HT3aR.RCE (control) or 5HT3aR.Cxcl14fl/fl.RCE (mutant) mice at P8–P10 in S1. Insets show the 1.5 s recording window with 1 s stimulation eliciting the AP wave. Phase plots are shown to highlight differences between groups identified by genotype. Control, n = 48 cells, 14 mice; mutant, n = 44 cells, 10 mice. (B) Representative voltage trace of a single AP fired at rheobase by an LI SBC, identified by the presence of a descending axon. Phase plots are shown to highlight differences between groups identified by genotype and morphology. Control, n = 11 cells, 9 mice; mutant, n = 13 cells, 7 mice. (C) Representative voltage trace of a single AP fired at rheobase by an LI NGFC interneuron. Control, n = 11 cells, 6 mice; mutant, n = 11 cells, 7 mice. (D) AP threshold (all cells). Mann-Whitney test of control (n = 48 cells, 14 mice) vs. mutant (n = 44 cells, 10 mice); *p = 0.035. (E) AP threshold (SBC). Unpaired t test of control (n = 11 cells, 9 mice) vs. mutant (n = 13 cells, 7 mice); *p = 0.044. (F) AP threshold (NGFC). Unpaired t test of control (n = 11 cells, 6 mice) vs. mutant (11 cells, 7 mice); non-significant (ns). The control dataset (black) is replotted from the NGFC cohort in Figure 2G. (G) AP amplitude (all cells). Mann-Whitney test of control (n = 48 cells, 14 mice) vs. mutant (n = 44 cells, 10 mice); non-significant, p = 0.06. (H) AP amplitude (SBC). Unpaired t test of control (n = 11 cells, 9 mice) vs. mutant (n = 13 cells, 7 mice); non-significant, p = 0.06. (I) AP amplitude (NGFC). Mann-Whitney test of control (n = 11 cells, 6 mice) vs. mutant (11 cells, 7 mice); non-significant (ns). (J) Representative voltage traces in current clamp in response to no stimulation and current steps (50, 100, 200, and 440 pA) in 5HT3aR.RCE (control, left) and 5HT3aR.Cxcl14fl/fl.RCE (mutant, right) mice at P8–P10 in S1. (K) Input-output relationship. Two-way ANOVA of control (n = 30 cells, 10 mice) vs. mutant (n = 36 cells, 10 mice); ****pgenotype < 0.0001. Data are represented as box-and-whisker plots from minimum to maximum range (whiskers) with interquartile range (box). See also Tables S2–S4.
Figure 7.
Figure 7.. Cxcl14 is necessary for the assembly of thalamocortical circuits in the developing somatosensory cortex
(A) Schematic for longitudinal two-photon imaging through a cranial window in S1. (B) Representative images of fields of view (FOVs) from 5HT3aR.GCaMP6s (control, left) and 5HT3aR.Cxcl14fl/fl.GCaMP6s (mutant, right) mice at P7. Scale bars, 100 μm. (C–F) Representative dF/F traces of three 5HT3aR.GCaMP6s LI interneurons at P7 (C and D) and P14 (E and F). Control: P7, n = 12 FOVs, 9 mice; P14, n = 15 FOVs, 10 mice. Mutants: P7, n = 4 FOVs, 3 mice; P14, n = 3 FOVs, 3 mice (C–J). (G) Average number of spontaneously active cells per FOV. Two-way ANOVA, ***pgenotype < 0.001; Tukey’s multiple comparison test, control vs. mutant at P7, *p = 0.046, and P14, **p = 0.002. (H) Average single-cell event duration. Two-way ANOVA, **page < 0.01; Tukey’s multiple comparisons test, mutant at P7 vs. P14, **p = 0.001. (I) Average single-cell event frequency. Two-way ANOVA, ****page < 0.0001; Tukey’s multiple comparisons test, control at P7 vs. P14, ****p < 0.0001, and mutant at P7 vs. P14, ****p < 0.0001. (J) Average single-cell event amplitude. Two-way ANOVA, **page < 0.01; Tukey’s multiple comparisons test, control at P7 vs. P14, **p = 0.004. (K) Representative images of posteromedial barrel subfield (PMBSF) in 5HT3aR.Cre (control) and 5HT3aR.Cxcl14fl/fl (mutant) mice at P8. Thalamic afferents were visualized by VGlut2 immunoreactivity. Individual barrels are outlined and labeled. A, anterior; P, posterior; M, medial; L, lateral. Scale bar, 500 μm. (L) Quantification of barrel areas as the sum of individual barrel areas per row (rows A to E). Two-way ANOVA, ****pgenotype < 0.0001; Tukey’s multiple comparisons test of control (n = 4 mice) vs. mutant (n = 3 mice), rows A–E, **p = 0.001. (M) Schematic for calcium imaging in S1 after whisker stimulation. 5HT3aR.GCaMP6s (control), n = 14 FOVs, 10 mice, and 5HT3aR.Cxcl14fl/fl.GCaMP6s mice, n = 3 FOVs, 3 mice (M–P). (N) Average percentage of whisker stimulations that evoked network events. Unpaired t test of control vs. mutant, *p = 0.04. (O) Average percentage of cells active in whisker-evoked network events, normalized to the percentage of total active cells per FOV. Unpaired t test of control vs. mutant, non-significant (ns). (P) Average percentage of cells responsive to whisker stimulation. Unpaired t test of control vs. mutant, non-significant (ns). Data are represented as box-and-whisker plots from minimum to maximum range (whiskers) with interquartile ranges (box). See also Figure S8.

References

    1. Golshani P, Goncalves JT, Khoshkhoo S, Mostany R, Smirnakis S, and Portera-Cailliau C (2009). Internally mediated developmental desynchronization of neocortical network activity. J. Neurosci. 29, 10890–10899. 10.1523/JNEUROSCI.2012-09.2009. - DOI - PMC - PubMed
    1. Egorov AV, and Draguhn A (2013). Development of coherent neuronal activity patterns in mammalian cortical networks: common principles and local hetereogeneity. Mech. Dev. 130, 412–423. 10.1016/j.mod.2012.09.006. - DOI - PubMed
    1. Chini M, Pfeffer T, and Hanganu-Opatz I (2022). An increase of inhibition drives the developmental decorrelation of neural activity. Elife 11, e78811. 10.7554/eLife.78811. - DOI - PMC - PubMed
    1. Suarez R, Bluett T, McCullough MH, Avitan L, Black DA, Paolino A, Fenlon LR, Goodhill GJ, and Richards LJ (2023). Cortical activity emerges in region-specific patterns during early brain development. Proc. Natl. Acad. Sci. USA 120, e2208654120. 10.1073/pnas.2208654120. - DOI - PMC - PubMed
    1. Luhmann HJ, Sinning A, Yang JW, Reyes-Puerta V, Stuttgen MC, Kirischuk S, and Kilb W (2016). Spontaneous Neuronal Activity in Developing Neocortical Networks: From Single Cells to Large-Scale Interactions. Front. Neural Circ. 10, 40. 10.3389/fncir.2016.00040. - DOI - PMC - PubMed

Publication types

LinkOut - more resources