

Methylome-proteome integration after late-life voluntary exercise training reveals regulation and target information for improved skeletal muscle health
- PMID: 39058663
- PMCID: PMC11702923
- DOI: 10.1113/JP286681
Methylome-proteome integration after late-life voluntary exercise training reveals regulation and target information for improved skeletal muscle health
Abstract
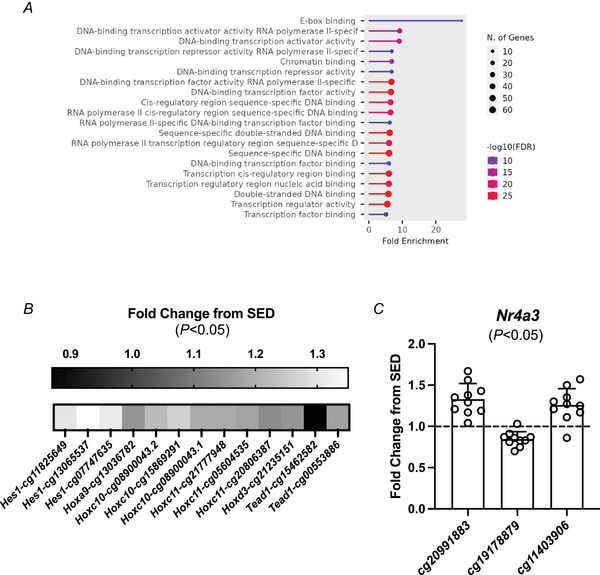
Exercise is a potent stimulus for combatting skeletal muscle ageing. To study the effects of exercise on muscle in a preclinical setting, we developed a combined endurance-resistance training stimulus for mice called progressive weighted wheel running (PoWeR). PoWeR improves molecular, biochemical, cellular and functional characteristics of skeletal muscle and promotes aspects of partial epigenetic reprogramming when performed late in life (22-24 months of age). In this investigation, we leveraged pan-mammalian DNA methylome arrays and tandem mass-spectrometry proteomics in skeletal muscle to provide detailed information on late-life PoWeR adaptations in female mice relative to age-matched sedentary controls (n = 7-10 per group). Differential CpG methylation at conserved promoter sites was related to transcriptional regulation genes as well as Nr4a3, Hes1 and Hox genes after PoWeR. Using a holistic method of -omics integration called binding and expression target analysis (BETA), methylome changes were associated with upregulated proteins related to global and mitochondrial translation after PoWeR (P = 0.03). Specifically, BETA implicated methylation control of ribosomal, mitoribosomal, and mitochondrial complex I protein abundance after training. DNA methylation may also influence LACTB, MIB1 and UBR4 protein induction with exercise - all are mechanistically linked to muscle health. Computational cistrome analysis predicted several transcription factors including MYC as regulators of the exercise trained methylome-proteome landscape, corroborating prior late-life PoWeR transcriptome data. Correlating the proteome to muscle mass and fatigue resistance revealed positive relationships with VPS13A and NPL levels, respectively. Our findings expose differential epigenetic and proteomic adaptations associated with translational regulation after PoWeR that could influence skeletal muscle mass and function in aged mice. KEY POINTS: Late-life combined endurance-resistance exercise training from 22-24 months of age in mice is shown to improve molecular, biochemical, cellular and in vivo functional characteristics of skeletal muscle and promote aspects of partial epigenetic reprogramming and epigenetic age mitigation. Integration of DNA CpG 36k methylation arrays using conserved sites (which also contain methylation ageing clock sites) with exploratory proteomics in skeletal muscle extends our prior work and reveals coordinated and widespread regulation of ribosomal, translation initiation, mitochondrial ribosomal (mitoribosomal) and complex I proteins after combined voluntary exercise training in a sizeable cohort of female mice (n = 7-10 per group and analysis). Multi-omics integration predicted epigenetic regulation of serine β-lactamase-like protein (LACTB - linked to tumour resistance in muscle), mind bomb 1 (MIB1 - linked to satellite cell and type 2 fibre maintenance) and ubiquitin protein ligase E3 component N-recognin 4 (UBR4 - linked to muscle protein quality control) after training. Computational cistrome analysis identified MYC as a regulator of the late-life training proteome, in agreement with prior transcriptional analyses. Vacuolar protein sorting 13 homolog A (VPS13A) was positively correlated to muscle mass, and the glycoprotein/glycolipid associated sialylation enzyme N-acetylneuraminate pyruvate lyase (NPL) was associated to in vivo muscle fatigue resistance.
Keywords: BETA; DNA methylation; ageing; mitoribosome; proteomics.
© 2024 The Author(s). The Journal of Physiology published by John Wiley & Sons Ltd on behalf of The Physiological Society.
Conflict of interest statement
Y.W. is the founder of MyoAnalytics LLC. S.J.W. is the founder of Ridgeline Therapeutics. The authors have no other conflicts to declare.
Figures


References
-
- Arneson, A. , Haghani, A. , Thompson, M. J. , Pellegrini, M. , Kwon, S. B. , Vu, H.a , Maciejewski, E. , Yao, M. , Li, C. Z. , Lu, A. T. , Morselli, M. , Rubbi, L. , Barnes, B. , Hansen, K. D. , Zhou, W. , Breeze, C. E. , Ernst, J. , & Horvath, S. (2022). A mammalian methylation array for profiling methylation levels at conserved sequences. Nature Communications, 13(1), 783. - PMC - PubMed
-
- Barrès, R. , Yan, J. , Egan, B. , Treebak, J. T. , Rasmussen, M. , Fritz, T. , Caidahl, K. , Krook, A. , O'gorman, D. J. , & Zierath, J. R. (2012). Acute exercise remodels promoter methylation in human skeletal muscle. Cell Metabolism, 15(3), 405–411. - PubMed
MeSH terms
Substances
Grants and funding
- R00 AG063994/AG/NIA NIH HHS/United States
- W81XWH-19-1-0290/U.S. Department of Defense (DOD)
- R01 AG080047/AG/NIA NIH HHS/United States
- R00 AR081367/NH/NIH HHS/United States
- R41 DK119052/DK/NIDDK NIH HHS/United States
- 1R41DK119052-01/National Institutes of Health NIDDK
- U44 AG074107/AG/NIA NIH HHS/United States
- P20 GM139768/GM/NIGMS NIH HHS/United States
- R01 AG080047/NH/NIH HHS/United States
- K99 AR081367/AR/NIAMS NIH HHS/United States
- P20GM139768/Arkansas Integrated Metabolic Research Center
- R00 AR081367/AR/NIAMS NIH HHS/United States
- 1U44AG074107-01/National Institutes of Health NIA
LinkOut - more resources
Full Text Sources
Molecular Biology Databases