. 2024 Jul 26;9(97):eadp1139.
doi: 10.1126/sciimmunol.adp1139. Epub 2024 Jul 26.

Sterile production of interferons in the thymus affects T cell repertoire selection

Affiliations

Sterile production of interferons in the thymus affects T cell repertoire selection

K Maude Ashby et al. Sci Immunol. .

Abstract

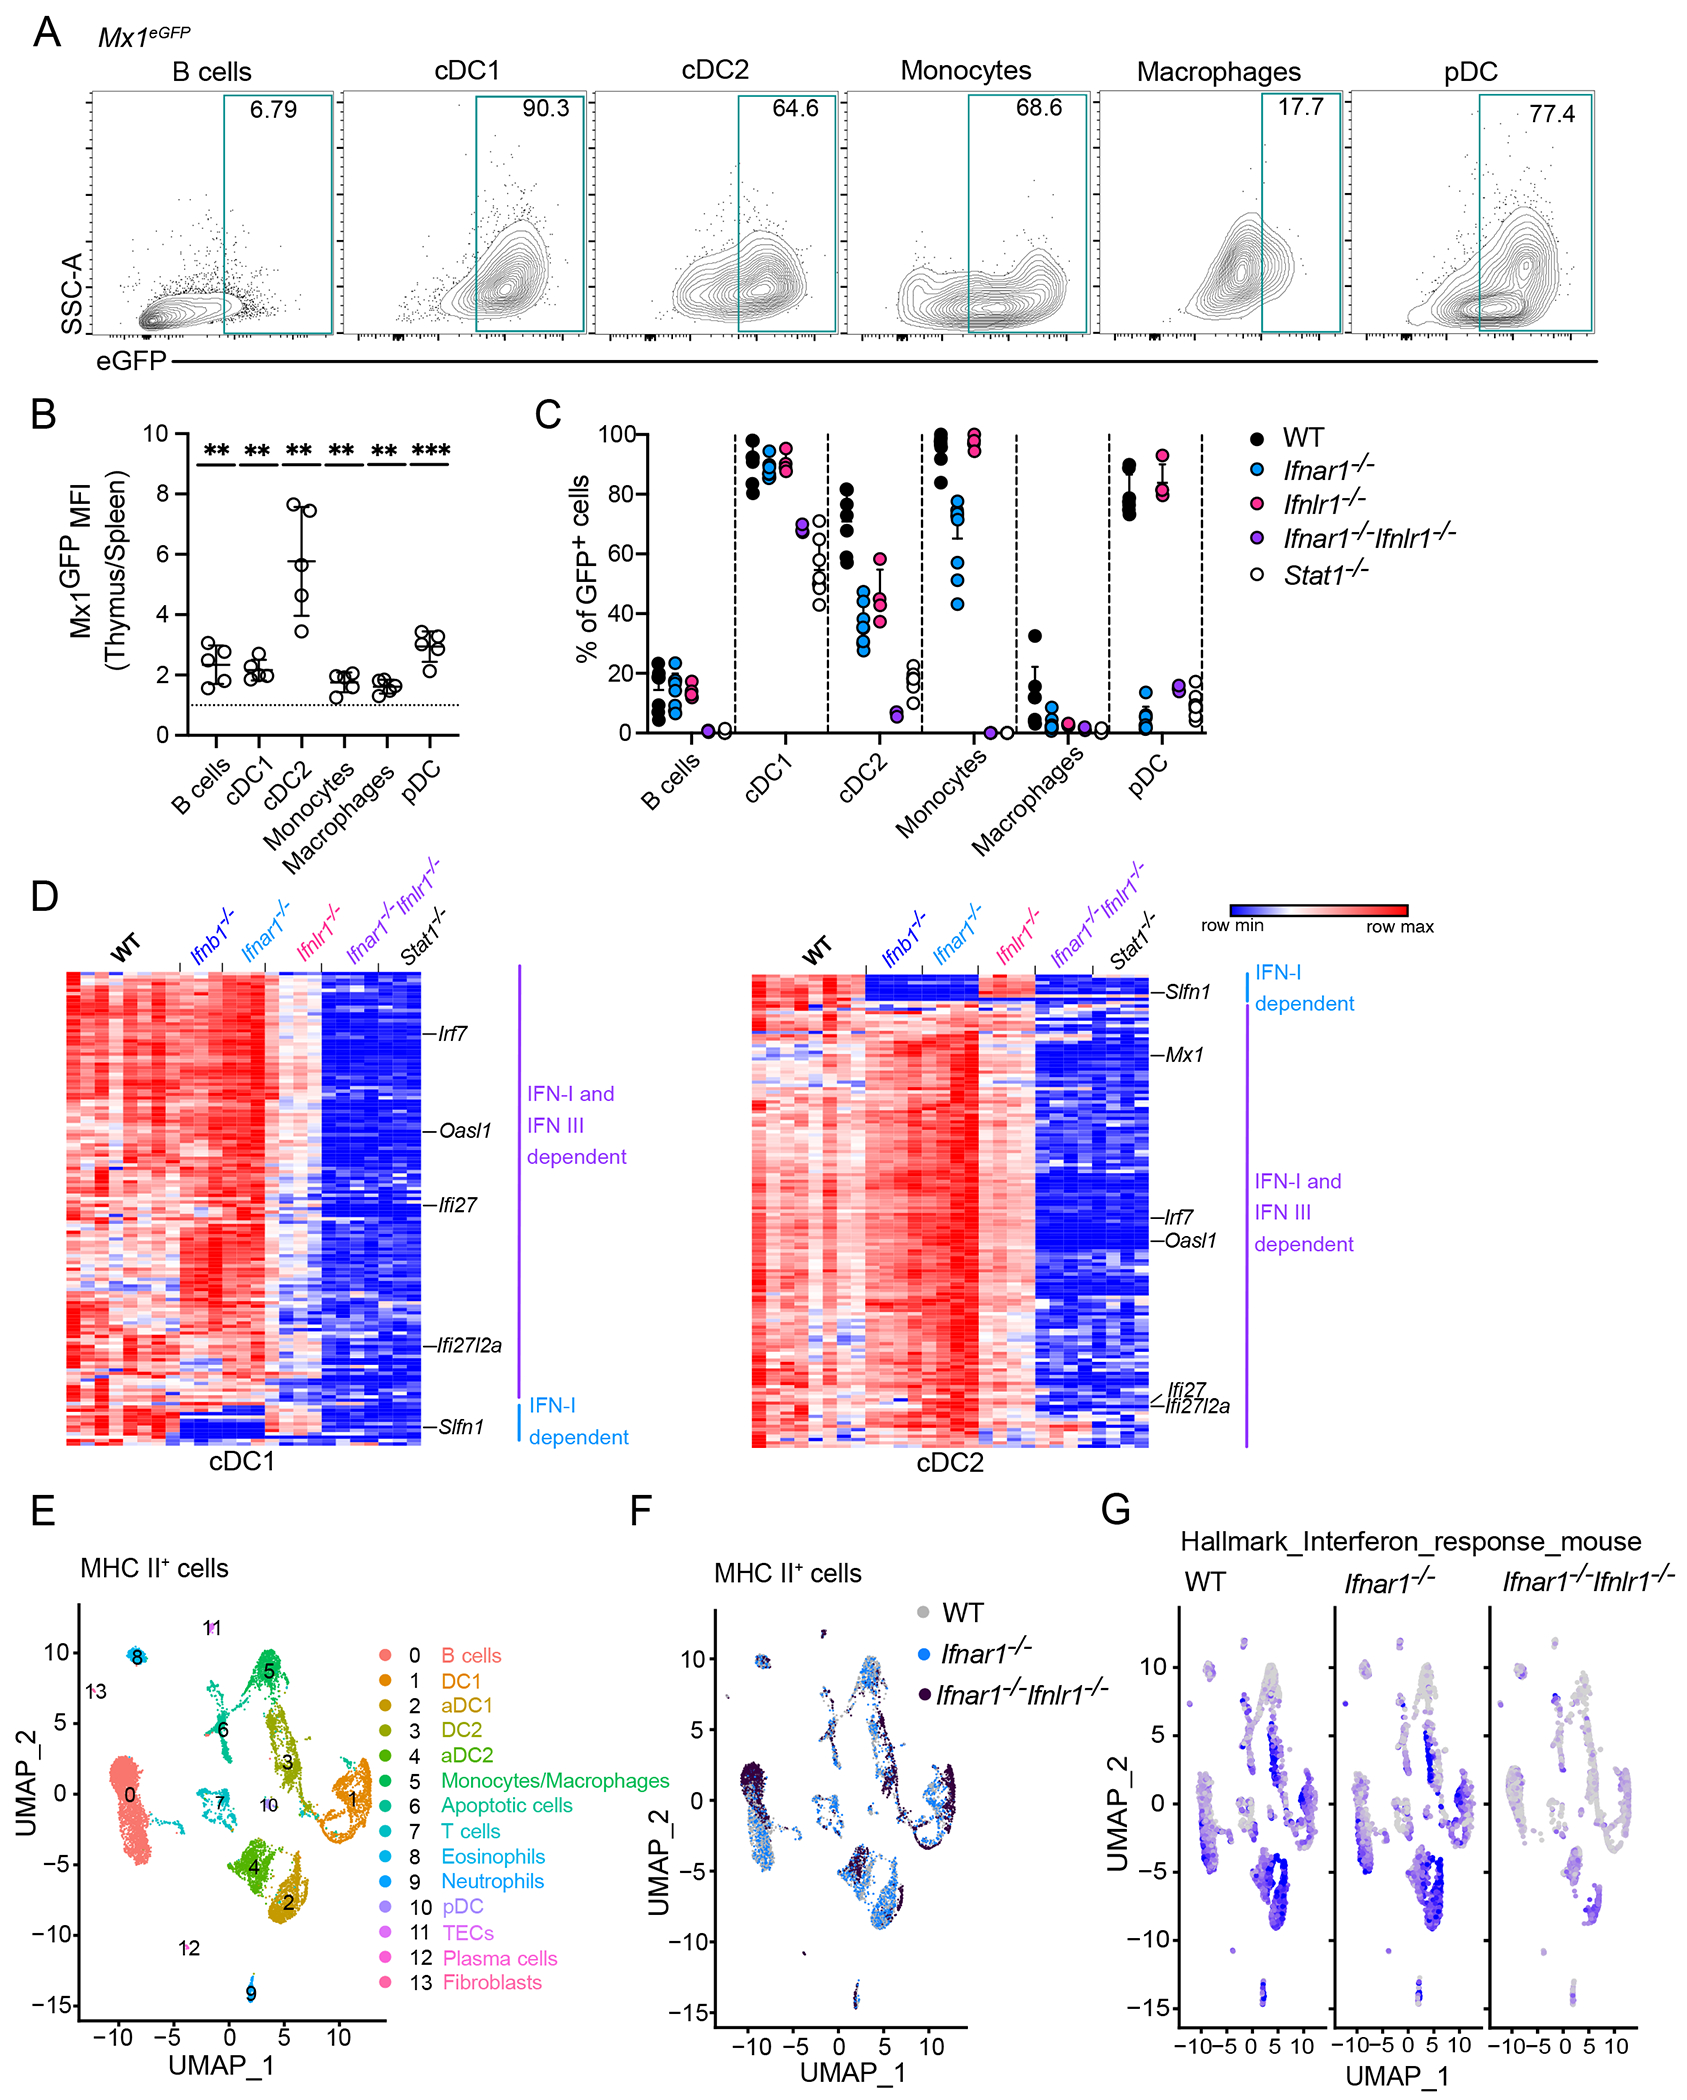
Type I and III interferons (IFNs) are robustly induced during infections and protect cells against viral infection. Both type I and III IFNs are also produced at low levels in the thymus at steady state; however, their role in T cell development and immune tolerance is unclear. Here, we found that both type I and III IFNs were constitutively produced by a very small number of AIRE+ murine thymic epithelial cells, independent of microbial stimulation. Antigen-presenting cells were highly responsive to thymic IFNs, and IFNs were required for the activation and maturation of thymic type 1 conventional dendritic cells, macrophages, and B cells. Loss of IFN sensing led to reduced regulatory T cell selection, reduced T cell receptor (TCR) repertoire diversity, and enhanced autoreactive T cell responses to self-antigens expressed during peripheral IFN signaling. Thus, constitutive exposure to IFNs in the thymus is required for generating a tolerant and diverse TCR repertoire.


Conflict of interest statement

Competing interests: Authors declare that they have no competing interests.

Figures

Figure 1.
Figure 1.. Sterile IFNβ and IFNλ are expressed in a subset of mTEC cells.
(A) The measurement of bioluminescent light emission in Ifnb1luc mice injected with D-Luciferin at 2 and 7 weeks of age. Representative pictures are shown. (B) Distribution of luciferase activity (relative light units, RLU) in various cell populations isolated from the thymus of Ifnb1luc mice, n=3 mice from 3 independent experiments. (C) Representative flow cytometry plots of IFN-β and IFN-λ expression in mTEChigh (gated as CD45EpCAM+Ly51-MHCIIhigh) from Ifnb1tdTomato and Ifnl2eGFP mice. (D) Frequency of tdTomato+ or eGFP+ cells among thymic CD45+ cells and stromal subpopulations (gating strategy shown in Fig. S1C and D) from Ifnb1tdTomato and Ifnl2eGFP mice, n=4-8 mice from 2 independent experiments. (E) Frequency of tdTomato+ and eGFP+ cells in mTEChigh from Aire−/−Ifnb1tdTomato and Aire−/−Ifnl2eGFP mice, n=3-9 mice from 2 independent experiments. (F) Luciferase bioluminescence (average flux in photons/second) (Ifnb1luc mice) or frequency of eGFP+ mTEChigh cells (Ifnl2eGFP mice) was measured at different ages, n=1-8 mice per time point. (G) Ifnb1, Ifnl2 and Ifnl3 expression by qPCR in sorted mTEChigh from WT, Aire−/−, Mavs−/−Sting−/−, Myd88−/−Trif−/−, and Germ-free mice (GF) presented relative to the expression in mTEChigh from WT mice, n=3-4 mice from 2 or 3 independent experiments. (H) Representative flow cytometry plots and frequency of tdTomato+ or eGFP+ cells in mTEChigh from Ifnb1tdTomato+/−Ifnl2eGFP+/− mice from different age (embryonic day 18.5 (E18.5), 2 days (D2) and 29 days (D29)), n=6-8 mice per 1 or 2 independent experiments. Statistical analysis was performed by a one-way ANOVA with multiple comparison test (B) or unpaired t-test (E). Data are shown as mean ± SD, **p≤0.01.
Figure 2.
Figure 2.. Thymic APCs are highly responsive to steady-state interferons.
(A) Representative flow cytometry plots of Mx1 expression in populations of thymic hematopoietic APCs from Mx1eGFP mice. eGFP+ gates were set up according to the individual WT controls per each cell type. (B) Ratio of geometric mean fluorescence (gMFI) of eGFP in the thymus vs. spleen for the indicated populations, n=5 mice. (C) Frequency of eGFP+ cells in populations of thymic hematopoietic APCs from Mx1eGFP mice crossed with Ifnar1−/−, Ifnlr1−/−, Ifnar1−/−Ifnlr1−/−, and Stat1−/− mice, n=3-7 from 3 independent experiments. (D) Transcriptomic analysis of thymic XCR1+ cDC1 and SIRPα+ cDC2 by bulk RNA sequencing sorted from Ifnb1−/−, Ifnar1−/−, Ifnlr1−/−, Ifnar1−/−Ifnlr1−/−, and Stat1−/− mice. Heatmaps display unsupervised clustering of the normalized expression of genes significantly downregulated in Stat1−/− compared to the WT in each population, n=3-8 mice. (E) MHC class II-expressing cells from thymus of WT, Ifnar1−/− and Ifnar1−/−Ifnlr1−/− were FACS-sorted, captured with a 3’ Single Cell V5 chemistry platform, and sequenced. Cell hashing was used to distinguish the genotypes of origin. Data are shown as a UMAP plot from all 10,743 transcriptome events showing 14 clusters identified. (F) UMAP plot presented in (E) using Cell hashing to identify cells from WT, Ifnar1−/−, and Ifnar1−/−Ifnlr1−/− mice. (G) Feature plots showing normalized expression of genes associated with “Hallmark interferon response mouse” in WT, Ifnar1−/−, and Ifnar1−/−Ifnlr1−/− mice. Statistical analysis in (B) was performed by one sample t and Wilcoxon test with theoretical mean 1. Data are shown as mean ± SD, **p≤0.01, ***p≤0.001.
Figure 3.
Figure 3.. Type III interferon drives maturation of thymic DC1, macrophages, and B cells.
(A) UMAP analysis of scRNA sequencing data presented in Fig. 2E separated by barcoded antibodies for WT, Ifnar1−/−, and Ifnar1−/−Ifnlr1−/− cells. The clusters showing the most pronounced differences between the genotypes (B cells, aDC1 and Monocytes/Macrophages) are marked by the dash line. (B, C, D) Representative flow cytometry plots and graphs showing differences in the frequency and numbers of aDC1 (XCR1+CCR7+ DCs) (B), MHCII+ macrophages (CD64+CD11c+MHCII+) (C) and class-switched B cells (B220+, CD11c, Ly6C+IgD) (D) between WT and Ifnar1−/−, Ifnlr1−/−, Ifnar1−/−Ifnlr1−/−, and Ifgnr1−/− mice. Cell gating shown in Fig. S5A. Differences are shown as KO/WT ratios of cell numbers, n=5-16 mice from at least 3 independent experiments. (E) Representative flow cytometry plots of aDC1 cells from Thymus and Spleen of WT and Ifnar1−/−Ifnlr1−/− mice. (F) Frequency of aDC1 and MHCII+ macrophages in 50:50 mixed bone marrow chimeras from WT and Ifnlr1−/− mice analyzed 6 weeks after reconstitution, n=5 mice. (G) Numbers of aDC1, MHCII+ macrophages and Ly6C+ B cells in Aire−/− shown as KO/WT ratios of cell numbers, n=5 mice from 2 independent experiments. Statistical analysis was performed by a one-way ANOVA with multiple comparison test (F) or one sample t and Wilcoxon test with theoretical mean 1 (B, C, D, G). Data are shown as mean ± SD, *p≤0.05, **p≤0.01, ***p≤0.001, ****p≤0.0001, n.s. = not significant.
Figure 4.
Figure 4.. Thymic interferon signaling promotes TCR repertoire diversity.
(A-B) Representative flow cytometry plots comparing murine thymocyte frequencies. (C) Frequency of mature CD4+SP thymocytes among total CD4SP. (D) Average CDR3 peptide read counts (normalized as counts per million) among CD4+ T conventional T cells (Tconv) from WT (TclibTgTcra+/−) and Ifnar1−/− (TclibTgTcra+/−Ifnar1−/−) mice. Dots are colored according to the log10(FDR) value for each CDR3. Squares represent CDR3 with FDR ≤0.05 between WT and Ifnar1−/− mice, n=5 mice per genotype. CDR3 peptide plotted below a CPM of 1 were not detected. Pie chart shows summary of DE analysis. (E) Shannon diversity (left) and species richness (right) of CDR3 peptide counts in murine CD4+ Tconv, n=5 mice. (F) Average CDR3 peptide read counts (normalized as counts per million) among CD4+ Tconv from WT (TclibTgTcra+/−) and Ifnar1−/−Ifnlr1−/− (TclibTgTcra+/− Ifnar1−/−Ifnlr1−/−) mice. Dots colored according to the log10(FDR) value for each CDR3. Squares represent CDR3 with FDR ≤0.05 between WT and Ifnar1−/−Ifnlr1−/− mice, n=6 mice per genotype. CDR3 peptide plotted below a CPM of 1 were not detected. Pie chart shows summary of DE analysis. (G) Shannon diversity (left) and species richness (right) of CDR3 peptide counts in CD4+ murine Tconv, n=6 mice. (H) Frequency of CD5+TCRβ+CD25 cleaved caspase 3+ CD4+SP murine thymocytes, n=12-27 mice per at least 2 independent experiments. (I) Violin plot from scRNAseq (Fig. 2E) showing expression of Ciita by cDC2 population (left). Ratio of geometric mean fluorescence (gMFI, right) of MHCII. Differences shown as KO/WT ratios of cell gMFI, n=4-8 mice from 2 independent experiments. (J) Ratio of numbers of CD301b+ cDC2, n=9-12 mice from 2 independent experiments. Statistical analysis was performed by one-way ANOVA with multiple comparison test (C, H), unpaired t-test (E, G) or one sample t and Wilcoxon test with theoretical mean 1 (I). Data are mean ± SD, *p≤0.05, **p≤0.01, ***p≤0.001, ****p≤0.0001, n.s. = not significant.
Figure 5.
Figure 5.. Interferons Plays a Crucial Role in Treg selection and central tolerance.
(A) Representative flow cytometry plots comparing frequency of murine Treg cells (B) Frequency of mature (CD25+FOXP3+) Treg cells among total murine CD4SP, n=7-23 mice from at least 3 independent experiments. (C) Average CDR3 peptide read counts (normalized as counts per million) among Treg cells (CD4+CD25+GITR+) from WT (TclibTgTcra+/−) and Ifnar1−/− (TclibTgTcra+/−Ifnar1−/−) mice. Dots are colored according to the log10(FDR) value for each CDR3. Squares represent CDR3 with FDR ≤0.05 between WT and Ifnar1−/− mice, n=5 mice per genotype. CDR3 peptide plotted below a CPM of 1 were not detected. Pie chart shows summary of DE analysis. (D) Shannon diversity (left) and species richness (right) of CDR3 peptide counts in Treg cells from WT and Ifnar1−/− mice, n=5 mice. (E) Average CDR3 peptide read counts (normalized as counts per million) among Treg cells from WT (TclibTgTcra+/−) and Ifnar1−/−Ifnlr1−/− (TclibTgTcra+/− Ifnar1−/−Ifnlr1−/−) mice. Dots are colored according to the log10(FDR) value for each CDR3. Squares represent CDR3 with FDR ≤0.05 between WT and Ifnar1−/−Ifnlr1−/− mice, n=6 mice per genotype. CDR3 peptide plotted below a CPM of 1 were not detected. Pie chart shows summary of DE analysis. (F) Shannon diversity (left) and species richness (right) of CDR3 peptide counts in Treg cells from WT and Ifnar1−/−Ifnlr1−/− mice, n=6 mice. (G) Design of experiment. (H) Quantification of CFSE dilution by flow cytometry analysis of CD4+ T cells isolated from WT, Ifnb1−/−, and Aire−/− mice intravenously transferred into the WT mice previously stimulated with PolyI:C (PI:C, 200μg) or PBS (control mice). CD4+ T cells were isolated from the spleen of donor mice 7 days after the transfer. T cells from Aire−/− mice were used as positive controls, n=5-7 mice. Statistical analysis was performed by a one-way ANOVA with multiple comparison test (B, H), unpaired t-test (D, F). Data are shown as mean ± SD, *p≤0.05, **p≤0.01, ***p≤0.001, ****p≤0.0001, n.s. = not significant.

References

    1. Kotenko SV, Rivera A, Parker D, Durbin JE, Type III IFNs: Beyond antiviral protection. Seminars in Immunology 43, 101303 (2019). - PMC - PubMed
    1. Ivashkiv LB, Donlin LT, Regulation of type I interferon responses. Nat Rev Immunol 14, 36–49 (2014). - PMC - PubMed
    1. Benhammadi M, Mathé J, Dumont-Lagacé M, Kobayashi KS, Gaboury L, Brochu S, Perreault C, IFN-λ Enhances Constitutive Expression of MHC Class I Molecules on Thymic Epithelial Cells. J Immunol 205, 1268–1280 (2020). - PubMed
    1. Lienenklaus S, Cornitescu M, Zietara N, Łyszkiewicz M, Gekara N, Jabłónska J, Edenhofer F, Rajewsky K, Bruder D, Hafner M, Staeheli P, Weiss S, Novel reporter mouse reveals constitutive and inflammatory expression of IFN-beta in vivo. J Immunol 183, 3229–3236 (2009). - PubMed
    1. Xing Y, Wang X, Jameson SC, Hogquist KA, Late stages of T cell maturation in the thymus involve NF-κB and tonic type I interferon signaling. Nat Immunol 17, 565–573 (2016). - PMC - PubMed

Publication types