. 2024 Jul 26;10(30):eado2825.
doi: 10.1126/sciadv.ado2825. Epub 2024 Jul 26.

Nuclear pyruvate dehydrogenase complex regulates histone acetylation and transcriptional regulation in the ethylene response

Affiliations

Nuclear pyruvate dehydrogenase complex regulates histone acetylation and transcriptional regulation in the ethylene response

Zhengyao Shao et al. Sci Adv. .

Abstract

Ethylene plays its essential roles in plant development, growth, and defense responses by controlling the transcriptional reprograming, in which EIN2-C-directed regulation of histone acetylation is the first key step for chromatin to perceive ethylene signaling. But how the nuclear acetyl coenzyme A (acetyl CoA) is produced to ensure the ethylene-mediated histone acetylation is unknown. Here we report that ethylene triggers the accumulation of the pyruvate dehydrogenase complex (PDC) in the nucleus to synthesize nuclear acetyl CoA to regulate ethylene response. PDC is identified as an EIN2-C nuclear partner, and ethylene triggers its nuclear accumulation. Mutations in PDC lead to an ethylene hyposensitivity that results from the reduction of histone acetylation and transcription activation. Enzymatically active nuclear PDC synthesizes nuclear acetyl CoA for EIN2-C-directed histone acetylation and transcription regulation. These findings uncover a mechanism by which PDC-EIN2 converges the mitochondrial enzyme-mediated nuclear acetyl CoA synthesis with epigenetic and transcriptional regulation for plant hormone response.


Figures
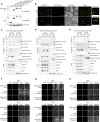
Fig. 1.
Fig. 1.. PDC interacts with EIN2-C in the nucleus in response to ethylene.
(A) In vitro pull-down experiment to validate the interaction between EIN2-C and PDC E1, E2, and E3 subunits. IB, immunoblotting. (B) Subcellular localization of EIN2-YFP fusion protein in Arabidopsis leaf epidermal cells with MitoTracker Red staining without (top) and with (bottom) the presence of 10 μM ACC. Red arrowhead indicates mitochondria signal by MitoTracker staining; yellow arrowhead indicates EIN2-YFP fluorescence signal. Scale bars, 20 μm. (C to E) In vivo co-IP assay to examine the interaction between EIN2-C and E1 (C), E2 (D), and E3 (E) in the indicated transgenic plants. Three-day-old etiolated seedlings carrying both PDC and EIN2 fusion proteins treated with air or 4 hours of ethylene gas were fractionated to isolate cytosol and nuclei for the immunoprecipitation with either Flag-Trap magnetic agarose (DYKDDDDK Fab-Trap) or anti-HA magnetic beads, respectively. The immunoprecipitation with immunoglobulin G (IgG) beads serves as a negative control. Phosphoenolpyruvate carboxylase (PEPC) was used as cytosolic marker protein; cytochrome C (Cyt C) is a mitochondrial marker protein, and BiP is an ER marker to assess nuclear extraction purity. Histone H3 is a loading control for nuclear fractions. (F to H) Confocal microscopy images of BiFC assay showing the interaction between EIN2 and PDC E1, E2, and E3 subunits in the nucleus after ethylene treatment. Agrobacteria containing indicated paired constructs was co-infiltrated into tobacco leaves, and the YFP fluorescence was observed 2 days after infiltration with or without 4 hours of ACC treatment. NLS-BFP was used as nuclear marker. Scale bars, 50 μm.
Fig. 2.
Fig. 2.. PDC accumulates in the nucleus in response to ethylene.
(A to C) Fractionation Western blot to examine the subcellular localization of PDC in E1-YFP-HA (A), E2-FLAG-GFP (B), and E3-FLAG-GFP (C) transgenic plants with time series of ethylene gas treatments. PDC E1 was probed with anti-HA, and E2 and E3 were probed with anti-FLAG in total protein extracts, cytoplasmic fractions, and nuclear fractions. PEPC, ATP synthase beta (ATPB), FUM1/2, Cyt C, and histone H3 were used to assess purities of nuclear and cytosolic fractionations and loading controls. Blue number indicates PDC band intensity that normalized to cytoplasmic PEPC signal. Red number indicates PDC band intensity that normalized to histone H3 signal. (D to F) Confocal microscopy images showing the subcellular localization of E1-YFP-HA (D), E2-FLAG-GFP (E), and E3-FLAG-GFP (F) with time series of ethylene gas treatments. 4′,6-Diamidino-2-phenylindole (DAPI) staining labels nuclei. Scale bars, 20 μm.
Fig. 3.
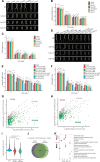
Fig. 3.. PDC is involved in the ethylene response.
(A) Photographs of pdc single mutants and Col-0 seedlings grown on MS medium containing 0, 1, 2, and 5 μM ACC. (B and C) Measurements of hypocotyl lengths (B) and root lengths (C) of indicated mutants. (D) Representative higher-order PDC mutants and Col-0 grown on MS medium containing 0, 1, 2, and 5 μM ACC. (E and F) Measurements of hypocotyl lengths and root lengths from indicated plants. In (B), (C), (E), and (F), each value is means ± SD of at least 30 seedlings, and different letters indicate significant differences between genotypes [P ≤ 0.05, calculated by a one-way analysis of variance (ANOVA) test followed by Tukey’s post hoc test for multiple comparisons]. (G and H) Scatterplots comparing the log2FC of ethylene up-regulated genes in Col-0 with that in e1-2-2 e2-2 #17 (G) or in e2-2 e3-2-2 #67 (H) in mRNA-seq. Each dot represents a DEG that its transcription level is significantly elevated by ethylene in Col-0 (log2FC > 1, P adjusted < 0.05). In (G) and (H), red dots correspond to DEGs in the elevated group, gray dots to DEGs in the unchanged group, and green dots to DEGs in the compromised group as described in Results. (I) Violin plot of log2FC distributions of ethylene up-regulated genes in the indicated plants. P values were determined by a two-tailed t test. (J) Venn diagram showing the ethylene up-regulation compromised genes in e1-2-2 e2-2 #17 and in e2-2 e3-2-2 #67. (K) Gene ontology (GO) analysis of transcriptionally co-compromised genes in both e1-2-2 e2-2 #17 and in e2-2 e3-2-2 #67. Top 15 GO categories ranked by P values were plotted. Dot size indicates the gene percentage from each GO category of all co-compromised genes (gene ratio %); dot colors indicate the P value of the GO categories.
Fig. 4.
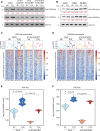
Fig. 4.. PDC is involved in the ethylene-induced histone acetylation.
(A) Western blot analysis of total histone acetylation of H3K14 and H3K23 in response to ethylene in different genetic backgrounds as indicated in the figure. Anti-H3 Western blot served as a loading control. (B) H3K14ac and H3K23ac levels in Col-0, E2ox, and E2-NLS-GFP treated with air or 4 hours of ethylene gas. Histone H3 served as a loading control. Red number indicates the quantification of H3K14ac and H3K23ac Western blot signal intensity normalized with that of histone H3. (C and D) Heatmaps of H3K14ac (C) and H3K23ac (D) ChIP-seq signal (log2 ChIP signal) from the genes that their ethylene-induced expressions are co-compromised in e1-2-2 e2-2 #17 and e2-2 e3-2-2 #67. TSS, transcription start site; TTS, transcription termination site. (E and F) Violin plots illustrating log2 normalized H3K14ac ChIP signal (E) and H3K23ac ChIP signal (F) per bin (bin size = 1) from 500 bp downstream of TSS in the genes that were co-compromised in two pdc double mutants (Fig. 3J) in the indicated genotypes and conditions. P values were calculated by a two-tailed t test.
Fig. 5.
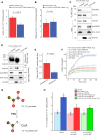
Fig. 5.. Nuclear PDC is enzymatically active to produce acetyl CoA.
(A and B) LC-MS detection of acetyl CoA (A) and malonyl CoA (B) in purified nuclei from Col-0 and e1-2-2 e2-2 e3-2-2 #67 etiolated seedlings treated with 4 hours of ethylene gas. Total protein mass was used to normalize metabolite concentration. P values were calculated by a two-tailed t test, and each data point was plotted as a dot in the bar graph. (C) Western blot analysis of the phosphorylation status of E1 using anti-pSer antibody in the cytosolic fraction and nuclear fractions from E1ox seedlings treated with 4 hours of ethylene gas. (D) Phos-tag phosphoprotein mobility shift gel of E1 phosphorylation status in the cytosolic fraction and nuclear fractions of E1ox etiolated seedlings treated with 4 hours of ethylene gas. Black arrow shows nonphosphorylated E1; red arrow indicates phosphorylated E1 protein. PEPC, CytC, and H3 were used to assess purities of nuclear and cytosolic fractionations. (E) The ratios of phosphorylated to nonphosphorylated YHGHpSMSDPGSTYR E1 peptides in the cytosolic versus in the nuclear fractions from E1ox with 4 hours of ethylene gas treatment. Peak area values were collected from three replicates. P value was calculated by t test. (F) Pyruvate dehydrogenase activity assays in the nuclear fraction from Col-0 and indicated pdc mutants treated with 4 hours of ethylene gas. (G) Schematic diagrams to show the conversion of 2,3-13C2 pyruvate to 1,2-13C2 acetyl CoA. (H) Normalized LC-MS/MS measured the concentration of 1,2-13C2 acetyl CoA that converted from 2,3-13C2 pyruvate by using the nuclear extracts from indicated plants with or without 4 hours of ethylene gas treatment. Quantification from four replicates was normalized by total protein input. Different letters represent significant differences between each group calculated by a one-way ANOVA test followed by Tukey’s post hoc test.
Fig. 6.
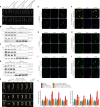
Fig. 6.. PDC functions in the ethylene response in an EIN2-C–dependent manner.
(A) Epistasis analysis of PDC E1ox, E2ox, and E3ox in the ein2-5 mutant. The seedlings were grown on MS medium containing with or without 10 μM ACC in the dark for 3 days before being photographed. (B to D) Examination of the protein levels of E1 in E1ox/Col-0 and E1ox/ein2-5 (B), E2 in E2ox/Col-0 and E2ox/ein2-5 (C), and E3 in E3ox/Col-0 and E3ox/ein2-5 (D) with 0- or 12-hour ethylene gas treatment. PEPC is cytoplasmic marker; Cyt C is a mitochondrial marker; histone H3 is a nuclear marker for a loading control. (E to J) Subcellular localization of E1-YFP-HA [(E) and (F)], E2-FLAG-GFP [(G) and (H)], and E3-FLAG-GFP [(I) and (J)] in Col-0 or ein2-5 mutant without or with 12 hours of ethylene gas treatment, respectively. Scale bars, 20 μm. (K) Photographs of 3-day-old etiolated EIN2S645A/Col-0 and EIN2S645A/e1e2e3 seedlings grown on MS medium containing indicated ACC in the dark for 3 days before being photographed. (L) ChIP-qPCR to evaluate H3K14ac (top) and H3K23ac (bottom) enrichment over selected genes in the indicated etiolated seedlings treated with air or 4 hours of ethylene gas. Different letters represent significant differences between each genotype and treatment condition that are calculated by a one-way ANOVA test followed by Tukey’s post hoc test with P ≤ 0.05.

Update of

References

    1. Achard P., Baghour M., Chapple A., Hedden P., van der Straeten D., Genschik P., Moritz T., Harberd N. P., The plant stress hormone ethylene controls floral transition via DELLA-dependent regulation of floral meristem-identity genes. Proc. Natl. Acad. Sci. U.S.A 104, 6484–6489 (2007). - PMC - PubMed
    1. Boutrot F., Segonzac C., Chang K. N., Qiao H., Ecker J. R., Zipfel C., Rathjen J. P., Direct transcriptional control of theArabidopsisimmune receptor FLS2 by the ethylene-dependent transcription factors EIN3 and EIL1. Proc. Natl. Acad. Sci. U.S.A 107, 14502–14507 (2010). - PMC - PubMed
    1. Chang C., Bleecker A. B., Ethylene biology. More than a gas. Plant Physiol. 136, 2895–2899 (2004). - PMC - PubMed
    1. Dubois M., van den Broeck L., Claeys H., van Vlierberghe K., Matsui M., Inzé D., The ETHYLENE RESPONSE FACTORs ERF6 and ERF11 antagonistically regulate mannitol-induced growth inhibition in Arabidopsis. Plant Physiol. 169, 166–179 (2015). - PMC - PubMed
    1. Ecker J. R., The ethylene signal transduction pathway in plants. Science 268, 667–675 (1995). - PubMed

MeSH terms