. 2024 Jul 26;10(30):eadn5405.
doi: 10.1126/sciadv.adn5405. Epub 2024 Jul 26.

Fetal hypoplastic lungs have multilineage inflammation that is reversed by amniotic fluid stem cell extracellular vesicle treatment

Affiliations

Fetal hypoplastic lungs have multilineage inflammation that is reversed by amniotic fluid stem cell extracellular vesicle treatment

Lina Antounians et al. Sci Adv. .

Abstract

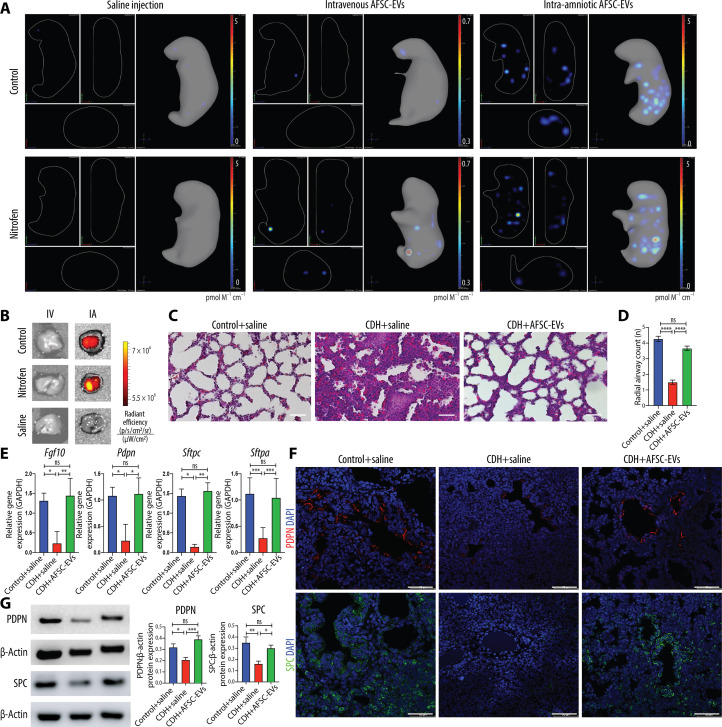
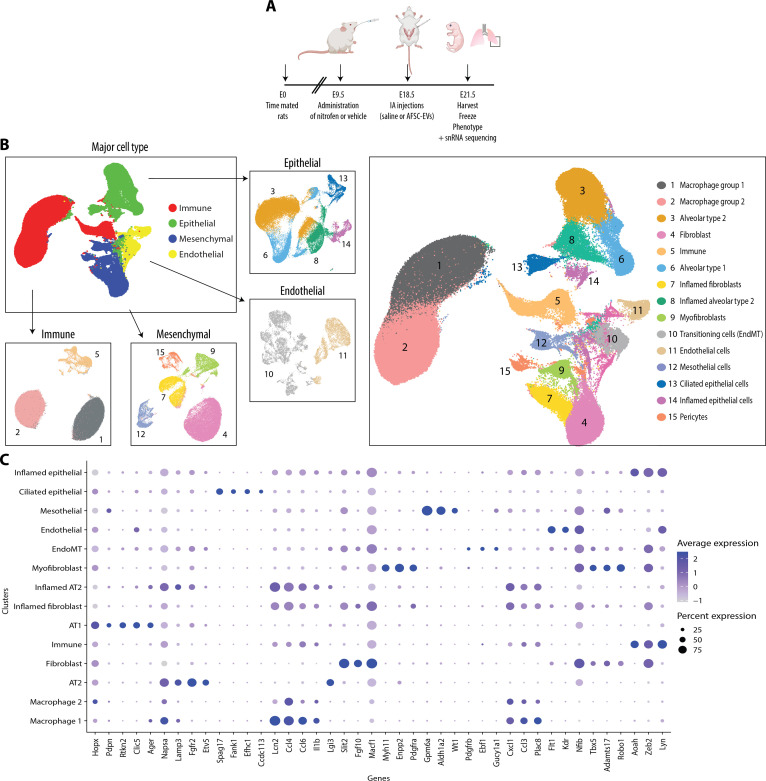
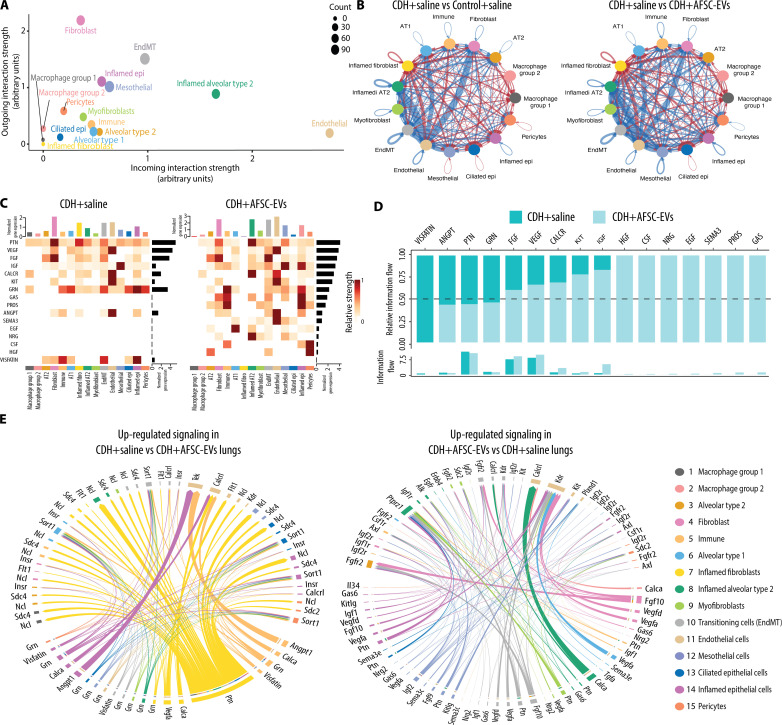
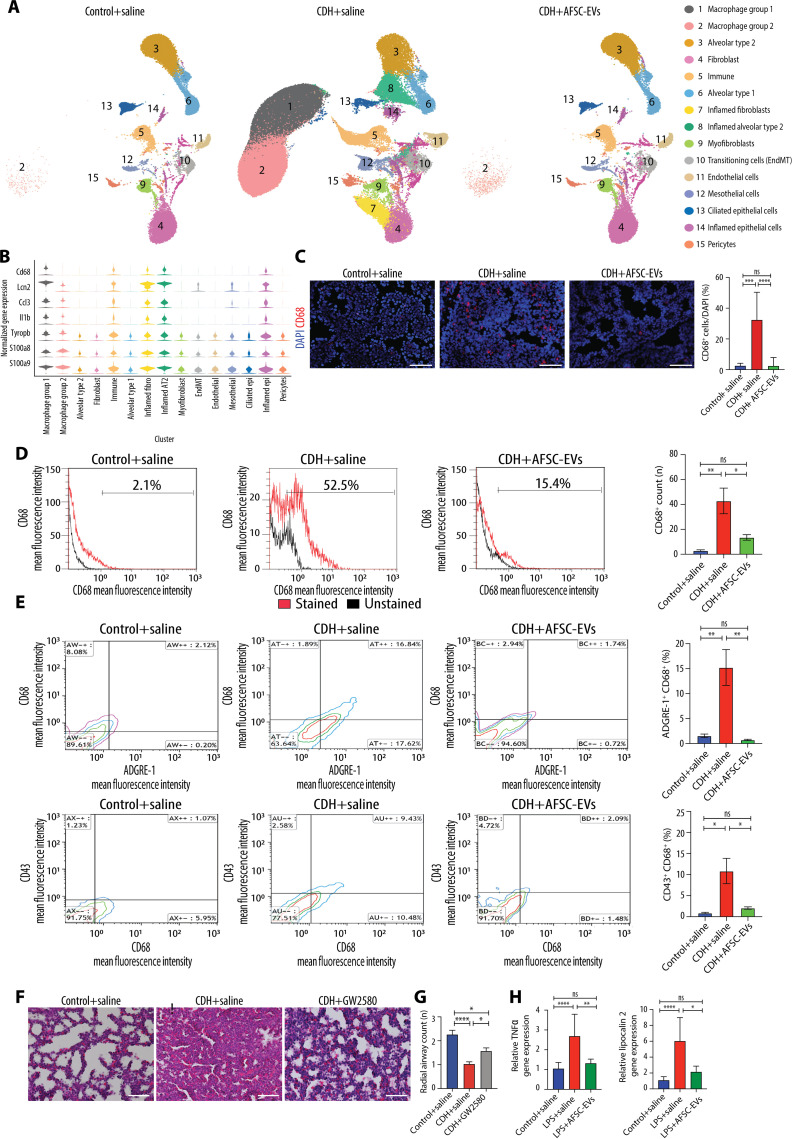
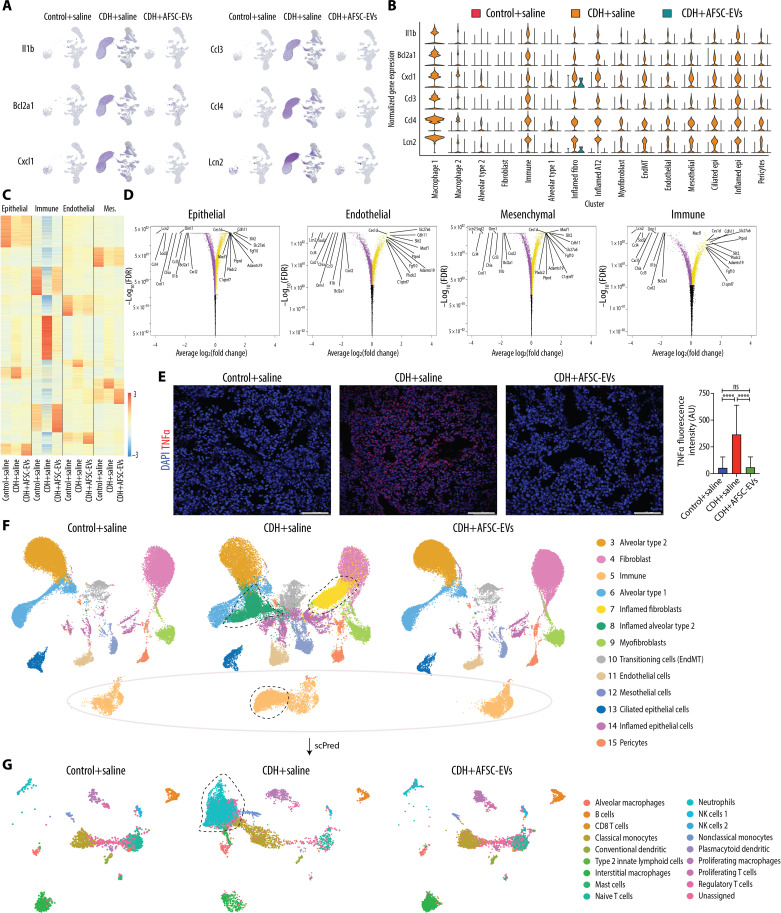
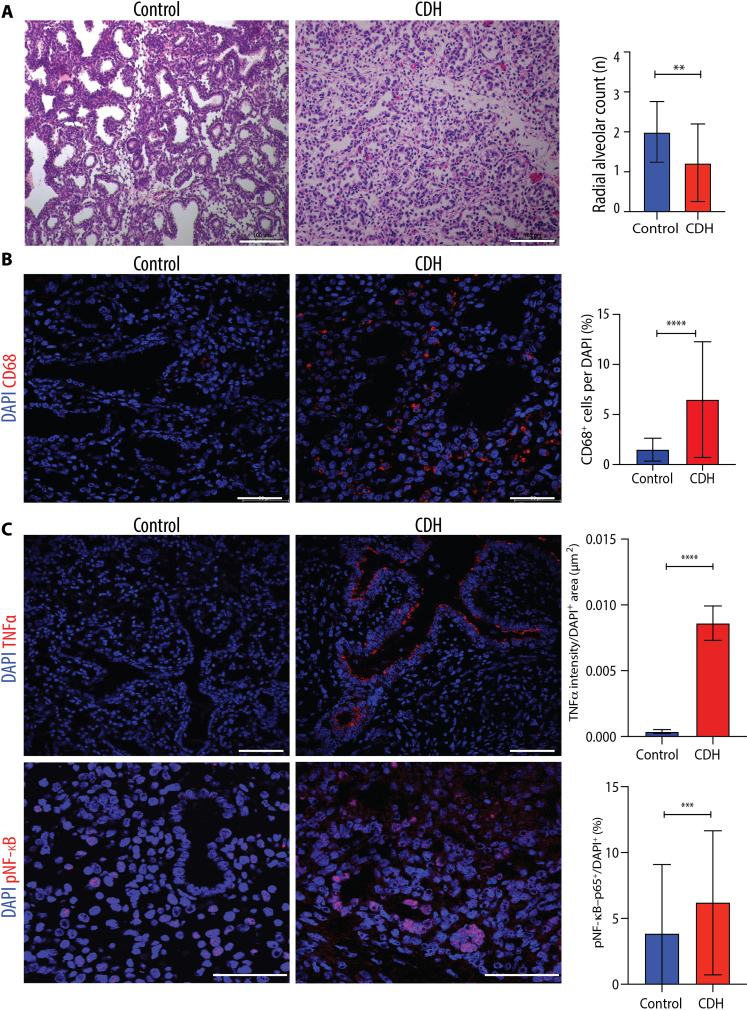
Antenatal administration of extracellular vesicles from amniotic fluid stem cells (AFSC-EVs) reverses features of pulmonary hypoplasia in models of congenital diaphragmatic hernia (CDH). However, it remains unknown which lung cellular compartments and biological pathways are affected by AFSC-EV therapy. Herein, we conducted single-nucleus RNA sequencing (snRNA-seq) on rat fetal CDH lungs treated with vehicle or AFSC-EVs. We identified that intra-amniotically injected AFSC-EVs reach the fetal lung in rats with CDH, where they promote lung branching morphogenesis and epithelial cell differentiation. Moreover, snRNA-seq revealed that rat fetal CDH lungs have a multilineage inflammatory signature with macrophage enrichment, which is reversed by AFSC-EV treatment. Macrophage enrichment in CDH fetal rat lungs was confirmed by immunofluorescence, flow cytometry, and inhibition studies with GW2580. Moreover, we validated macrophage enrichment in human fetal CDH lung autopsy samples. Together, this study advances knowledge on the pathogenesis of pulmonary hypoplasia and further evidence on the value of an EV-based therapy for CDH fetuses.


Figures

Fig. 1.
Fig. 1.. In vivo administration of AFSC-EVs reaches fetal lungs and improves lung development in fetal rats with CDH.
(A) Representative IVIS Spectrum cross-sectional images from three-dimensional (3D) bioluminescence reconstructions of whole fetuses at E21.5. Fetuses randomly received either saline injection (left), IV injection of ExoGlowVivo-stained AFSC-EVs (middle), or IA injection of ExoGlowVivo-stained AFSC-EVs (right) at E18.5 in control fetuses (top row) or fetuses with pulmonary hypoplasia/CDH that received nitrofen (bottom row). Scale bar shows background-corrected fluorescence in pmol M−1 cm−1. Control+saline (n = 3), Control+IV-AFSC-EVs (n = 3), Control+IA-AFSC-EVs (n = 7), Nitrofen+saline (n = 6), Nitrofen+IV-AFSC-EVs (n = 3), and Nitrofen+IA-AFSC-EVs (n = 16). (B) Representative 2D optical images of dissected fetal lungs from the same conditions described in (A), quantified as radiant efficiency [p/s/cm2/sr]/[μW/cm2]. Control+saline (n = 3), Control+IV-AFSC-EVs (n = 3), Control+IA-AFSC-EVs (n = 3), Nitrofen+saline (n = 3), Nitrofen+IV-AFSC-EVs (n = 4), and Nitrofen+IA-AFSC-EVs (n = 9). (C) Representative histology images (hematoxylin and eosin) of fetal lungs from Control+saline, CDH+saline, and CDH+AFSC-EV fetuses. Each condition included fetal lungs from n = 5 experiments. Scale bars, 50 μm. (D) Differences in number of alveoli (RAC) in Control+saline (n = 8), CDH+saline (n = 8), and CDH+AFSC-EVs (n = 9) quantified in at least five fields per fetal lung. ****P < 0.0001; ***P < 0.001; ns, not significant. (E) Gene expression of lung developmental markers Fgf10, Pdpn, and Sftpc and Sftpa. Control+saline (n = 5), CDH+saline (n = 5), and CDH+AFSC-EVs (n = 5). **P < 0.01; *P < 0.05. (F) Representative immunofluorescence images of PDPN (red; top) and SPC (green; bottom) protein expression between Control+saline, CDH+saline, and CDH+AFSC-EV fetuses [4′,6-diamidino-2-phenylindole (DAPI); blue]. Scale bars, 50 μm. (G) Western blot analysis of PDPN and SPC expression in fetal lung quantified by signal intensity normalized to glyceraldehyde-3-phosphate dehydrogenase (GAPDH). Control+saline (n = 6), CDH+saline (n = 7), and CDH+AFSC-EVs (n = 6). Groups were compared using Kruskal-Wallis (post hoc Dunn’s nonparametric comparison) for (D) RAC and (E) Fgf10, Pdpn, and Sftpc and one-way ANOVA (Tukey post-test) for (E) Sftpa and (G), according to Shapiro-Wilk normality test.
Fig. 2.
Fig. 2.. Single-nucleus interrogation of the rat fetal normal and hypoplastic lung identifies four major cell types each with distinct subpopulations.
(A) Schematic of experimental design and in vivo administration of AFSC-EVs in the rat model of CDH. (B) Global Uniform Manifold Approximation and Projection (UMAP) of all nuclei (n = 298,653) included in our study, further delineated by major cell type and subtype. (C) Expression of known cell type–specific markers used to distinguish cellular subtypes within major cell type clusters. Node size is proportional to the percentage of nuclei within the specified cluster, and node color denotes the average expression across nuclei within the specified cluster.
Fig. 3.
Fig. 3.. Ligand-receptor analysis reveals the biological pathways that are influenced by AFSC-EV treatment of rat fetal hypoplastic lungs.
(A to E) CellChat analysis of signaling pathways in fetal lungs from all three conditions. (A) Comparison of interaction strength of outgoing and incoming signals by specific cluster. Node size represents number of interactions. (B) Statistically significant interactions between clusters (arrows) showing number of interactions that are down-regulated (blue) and up-regulated (red) when comparing Control+saline versus CDH+saline (left) and CDH+saline versus CDH+AFSC-EVs (right). Thickness of arrow indicates interaction strength. (C) Highly expressed ligand-receptor pairs displayed as a heatmap showing outgoing signal strength (top x axis), individual signaling pathways (left y axis), strength of signaling pathway (right y axis), and cell identity (bottom y axis). (D) Shift of signaling pathways related to lung development following AFSC-EV administration to fetal CDH lungs. (E) Chord diagram showing statistically significant up-regulated or down-regulated signaling pathways in each cluster between CDH+saline and CDH+AFSC-EV conditions. Thickness of arrow indicates relative strength of specific pathway.
Fig. 4.
Fig. 4.. CDH lungs have an inflammatory phenotype with high macrophage density that is reduced to normal levels by AFSC-EV administration.
(A) UMAP of snRNA-seq data split by condition. (B) Violin plots of macrophage and inflammatory marker gene expression across cell types, as measured by snRNA-seq. (C) Representative immunofluorescence images of pan-macrophage marker CD68 in rat fetal lungs from all three conditions, quantified as fluorescence intensity of CD68 per field. Scale bars, 50 μm. Control+saline (n = 8), CDH+saline (n = 6), and CDH+AFSC-EV (n = 8). Groups were compared using Kruskal-Wallis (post hoc Dunn’s nonparametric comparison) for (C), according to Shapiro-Wilk normality test. ***P < 0.001; ****P < 0.0001. (D) Flow cytometry analysis of dissociated lung cells stained for CD68 (red) versus unstained (black) and (E) costained with ADGRE-1 and CD43 (panels are representative of n ≥ 3 pups per group; data file S4). *P < 0.05; **P < 0.01. (F) Representative histology images (hematoxylin and eosin) of fetal lungs from Control+saline, CDH+saline, and CDH+GW2580 fetuses. Scale bars, 50 μm. (G) Differences in number of alveoli (RAC) in Control+saline (n = 7), CDH+saline (n = 8), and CDH+GW2580 (n = 8), quantified in at least seven fields per fetal lung. (H) Gene expression changes in inflammatory markers Tnfα and Lcn2 in RAW264.7 cells stimulated with LPS, relative to Actb housekeeping gene.
Fig. 5.
Fig. 5.. CDH fetal lungs have a multilineage inflammatory signature that is dampened by the administration of AFSC-EVs.
(A) Featureplot of snRNA-seq data split by condition for six inflammatory genes with high expression in CDH+saline lungs. (B) Violin plot of inflammatory signature genes expression split by condition across cell types, as measured by snRNA-seq. (C) Heatmap displaying differential gene expression by major cell type, showing expression all genes ranked by log2(fold change) and P-adjusted < 0.05 within all conditions. (D) Volcano plots indicating most statistically significant differentially expressed genes by major cell type between CDH+saline-treated and CDH+AFSC-EV–treated groups. FDR, false discovery rate. (E) Representative immunofluorescence images of inflammation marker TNFα in rat fetal lungs from all three conditions, quantified as density per mm2. Scale bars, 50 μm. Control+saline (n = 5), CDH+saline (n = 5), and CDH+AFSC-EV (n = 5). AU, arbitrary units. ****P < 0.0001. (F) UMAP of a subset of data that excludes clusters 1 and 2 (overrepresented in CDH+saline group) split by condition. Outlines indicate nuclei or clusters that are represented in CDH+saline group compared to Control+saline and CDH+AFSC-EV groups. Control+saline (n = 30,064), CDH+saline (n = 45,114), and CDH+AFSC-EV (n = 42,193). (G) UMAP of predicted cell types contained in cluster 5 immune cells from (F), generated by machine learning algorithm (scPred) trained on rat adult lungs. Groups were compared using Kruskal-Wallis (post hoc Dunn’s nonparametric comparison) for (E), according to Shapiro-Wilk normality test.
Fig. 6.
Fig. 6.. Hypoplastic lungs of human fetuses with CDH have increased macrophage density and up-regulation of inflammatory mediators.
(A) Representative histology images (hematoxylin and eosin) of fetal lungs from autopsy studies of CDH fetuses (n = 4) and controls with no lung pathology or inflammatory condition (n = 4). Scale bars, 100 μm. Quantification of number of alveoli (RAC) in 10 fields per fetal lung. **P < 0.01. (B) Representative immunofluorescence images of pan-macrophage marker CD68 in human fetal lungs autopsy samples from CDH (n = 4) and controls (n = 4), quantified as number per DAPI+ cell (%). Scale bars, 50 μm. ****P < 0.0001. (C) Representative immunofluorescence images of inflammatory mediators TNFα and pNF-κB in the same experimental groups as (B) quantified by fluorescence intensity of TNFα and density of pNF-κB+ cells per field. Scale bars, 50 μm. Groups were compared using two-tailed Mann-Whitney test for (A), (B), and (C) pNF-κB and two-tailed Student’s t test for (C) TNFα, according to Shapiro-Wilk normality test. ***P < 0.001.

References

    1. Cotten C. M., Pulmonary hypoplasia. Semin. Fetal Neonatal Med. 22, 250–255 (2017). - PubMed
    1. Zani A., Chung W. K., Deprest J., Harting M. T., Jancelewicz T., Kunisaki S. M., Patel N., Antounians L., Puligandla P. S., Keijzer R., Congenital diaphragmatic hernia. Nat. Rev. Dis. Primers. 8, 37 (2022). - PubMed
    1. Global PaedSurg Research Collaboration , Mortality from gastrointestinal congenital anomalies at 264 hospitals in 74 low-income, middle-income, and high-income countries: A multicentre, international, prospective cohort study. Lancet 398, 325–339 (2021). - PMC - PubMed
    1. Jeanty C., Kunisaki S. M., MacKenzie T. C., Novel non-surgical prenatal approaches to treating congenital diaphragmatic hernia. Semin. Fetal Neonatal Med. 19, 349–356 (2014). - PubMed
    1. Figueira R. L., Antounians L., Zani-Ruttenstock E., Khalaj K., Zani A., Fetal lung regeneration using stem cell-derived extracellular vesicles: A new frontier for pulmonary hypoplasia secondary to congenital diaphragmatic hernia. Prenat. Diagn. 42, 364–372 (2022). - PubMed

Publication types

MeSH terms

LinkOut - more resources