. 2024 Sep:75:103277.
doi: 10.1016/j.redox.2024.103277. Epub 2024 Jul 20.

TrxR1 is involved in the activation of Caspase-11 by regulating the oxidative-reductive status of Trx-1

Affiliations

TrxR1 is involved in the activation of Caspase-11 by regulating the oxidative-reductive status of Trx-1

Dongsheng Bai et al. Redox Biol. 2024 Sep.

Abstract

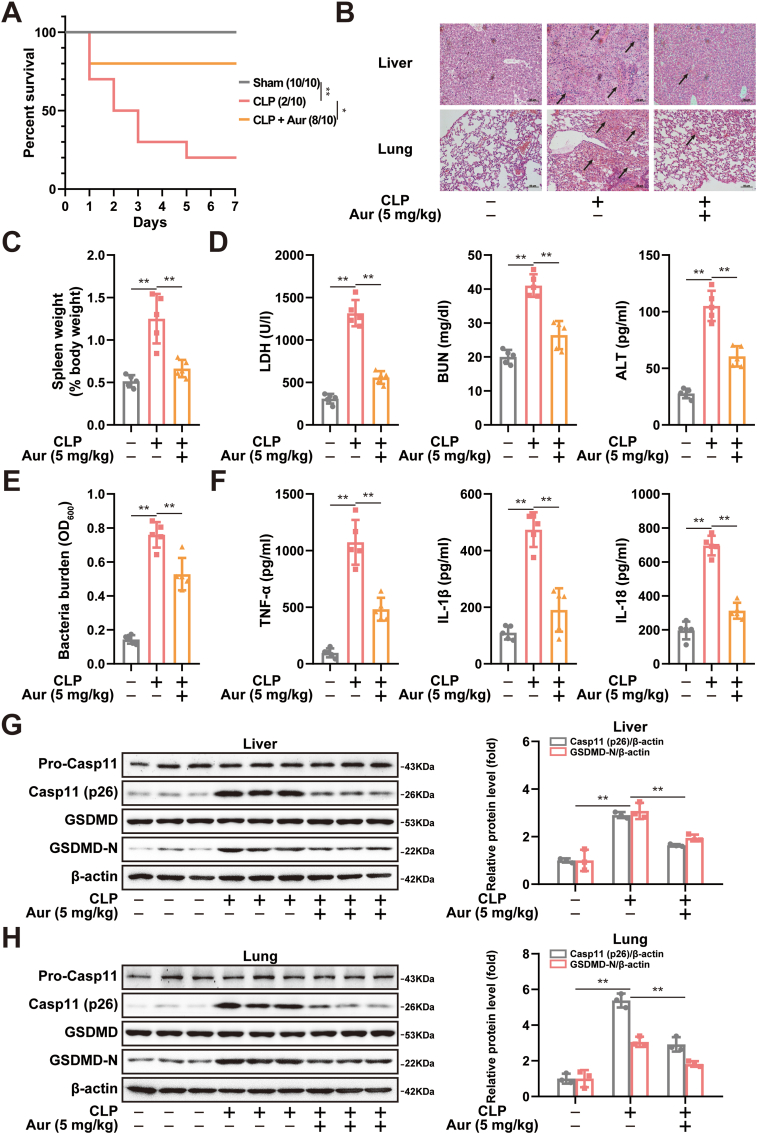
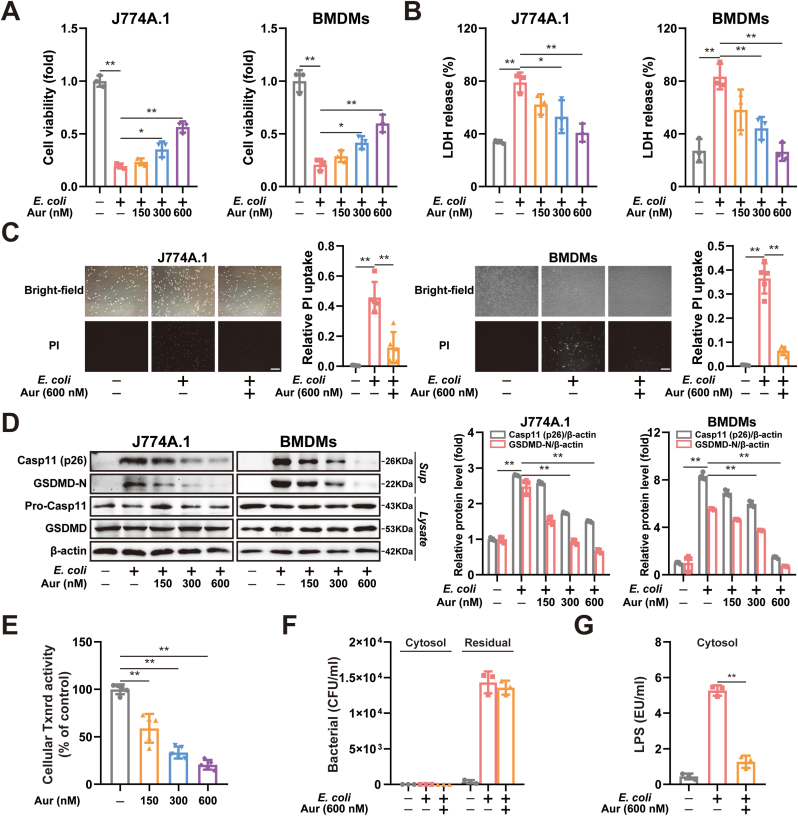
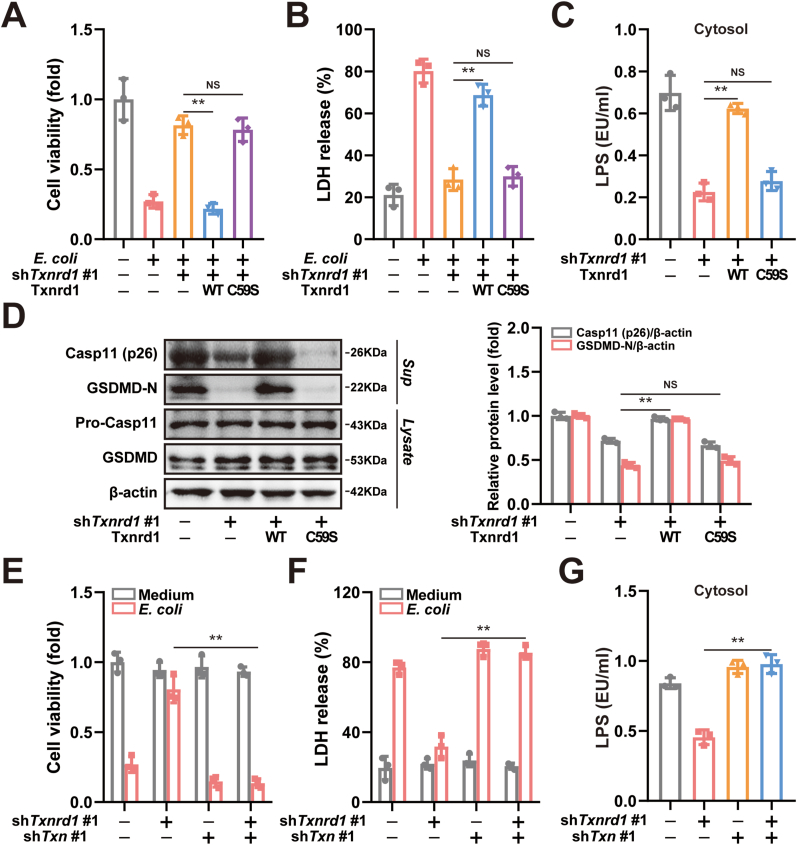
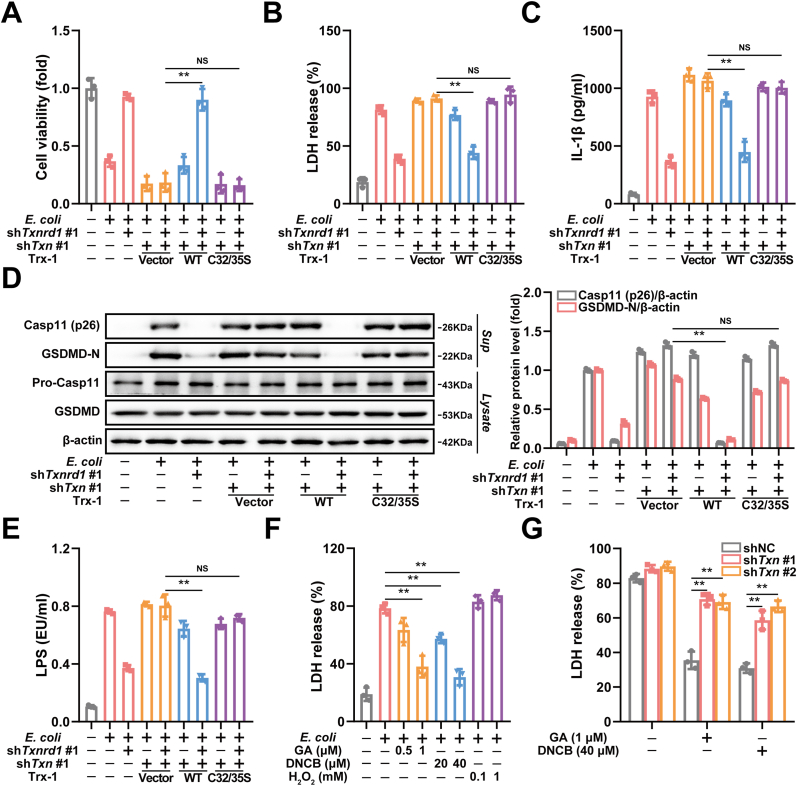
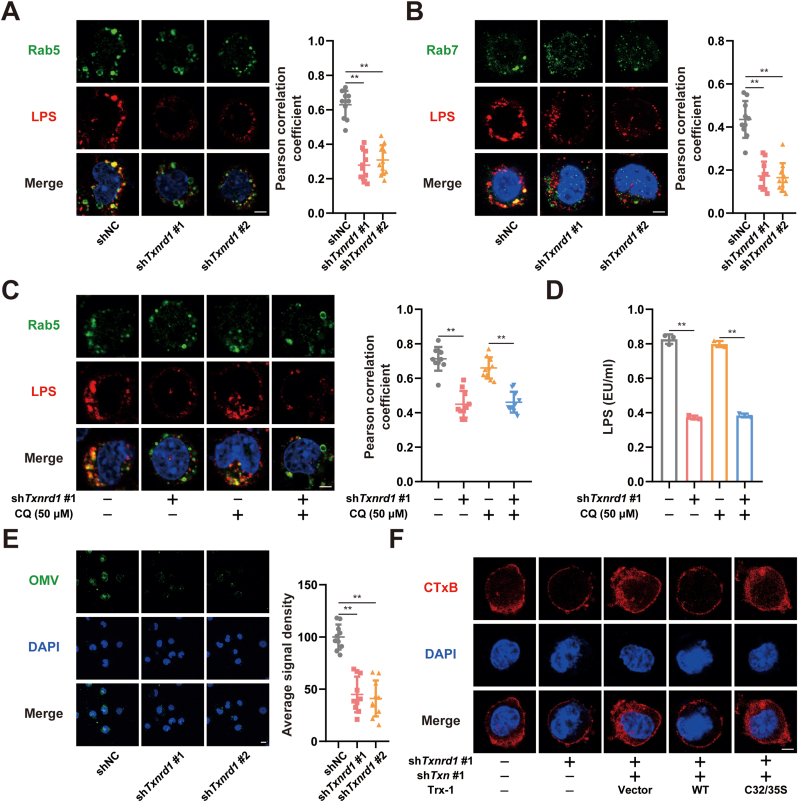
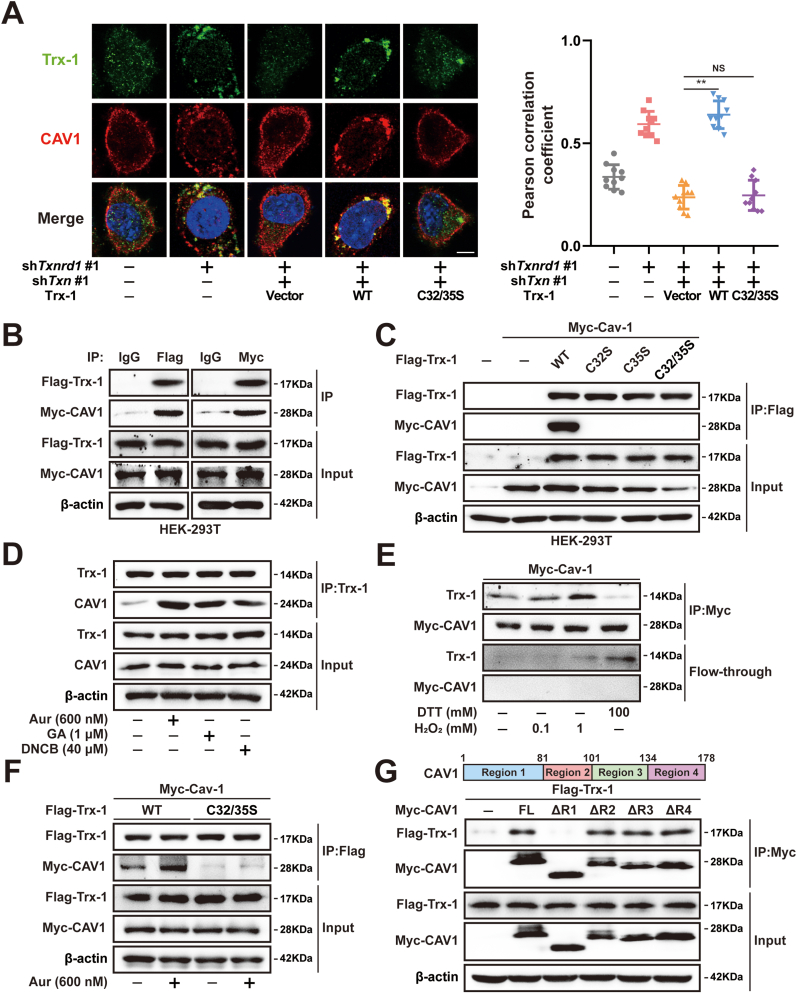
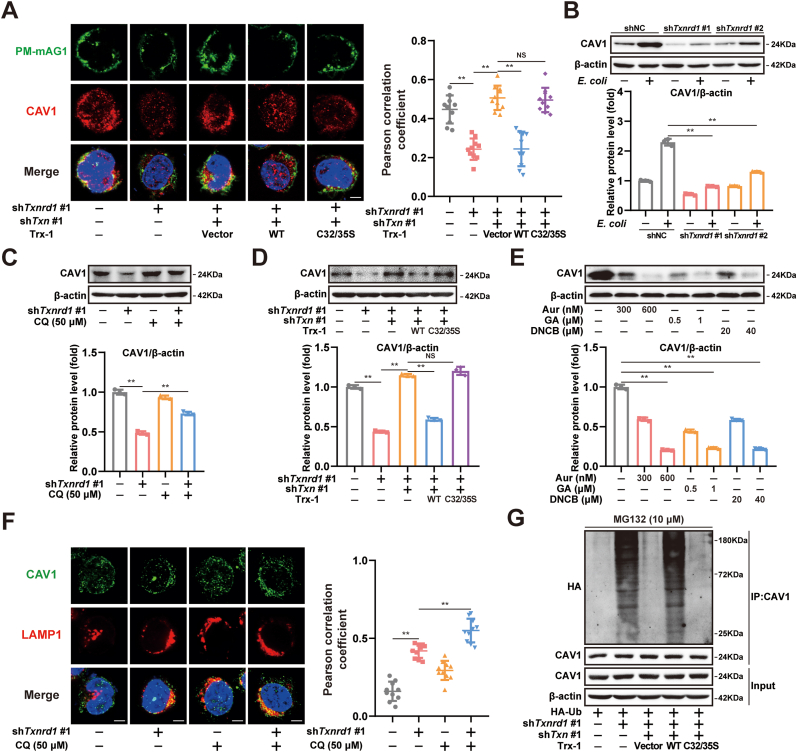
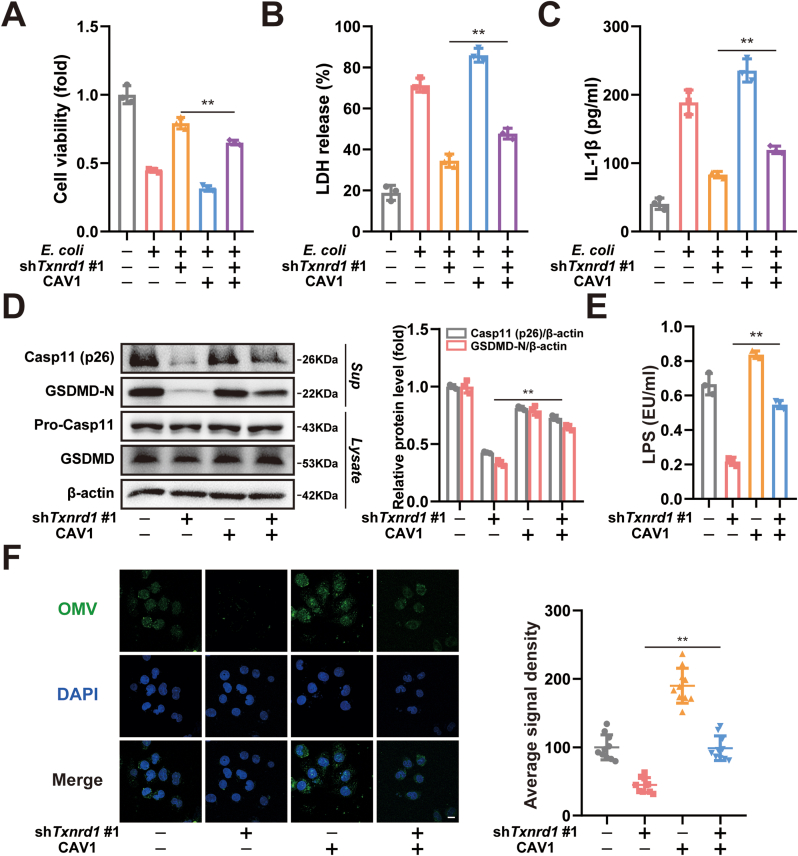
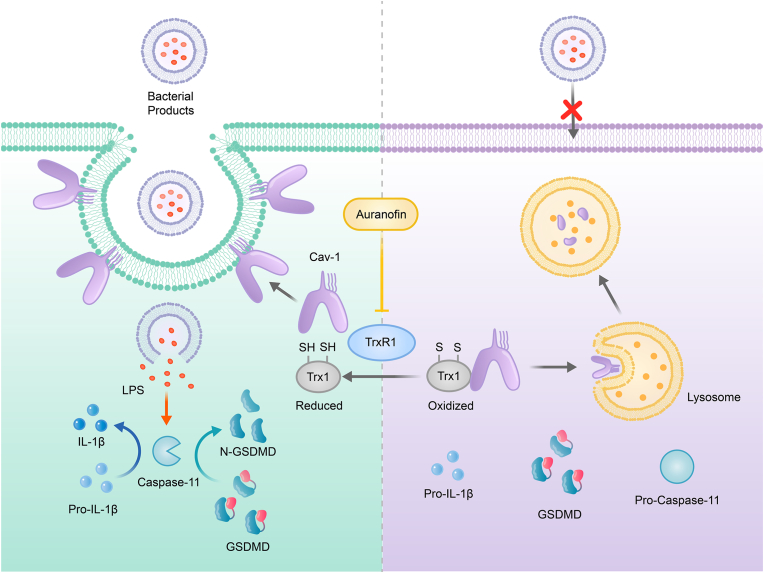
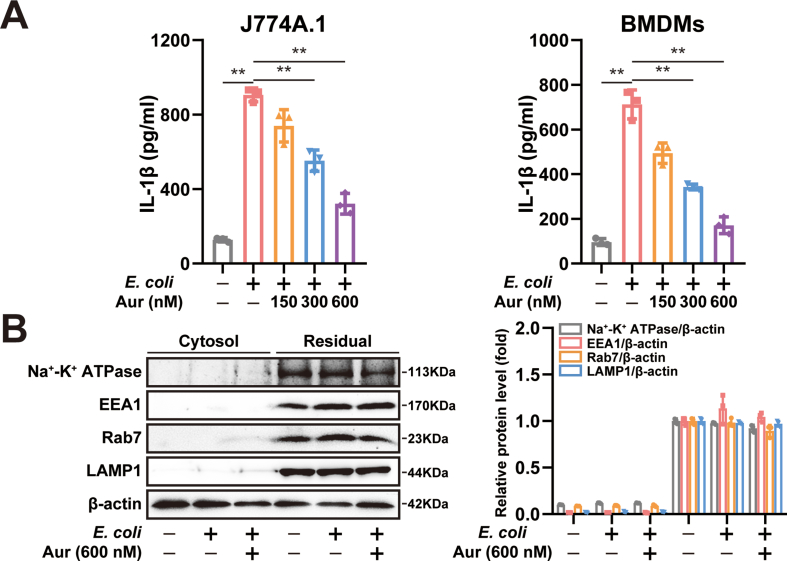
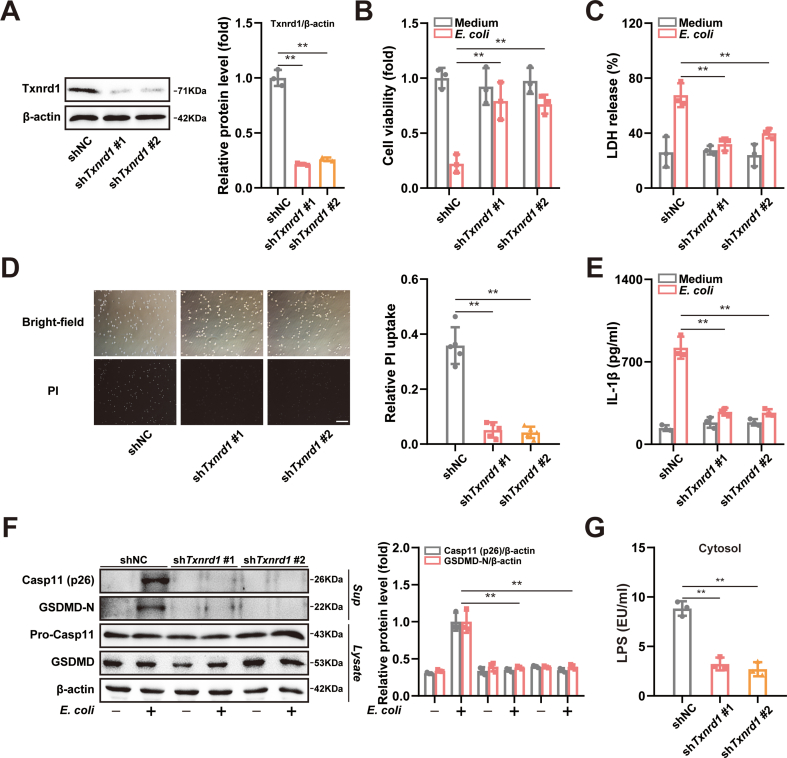
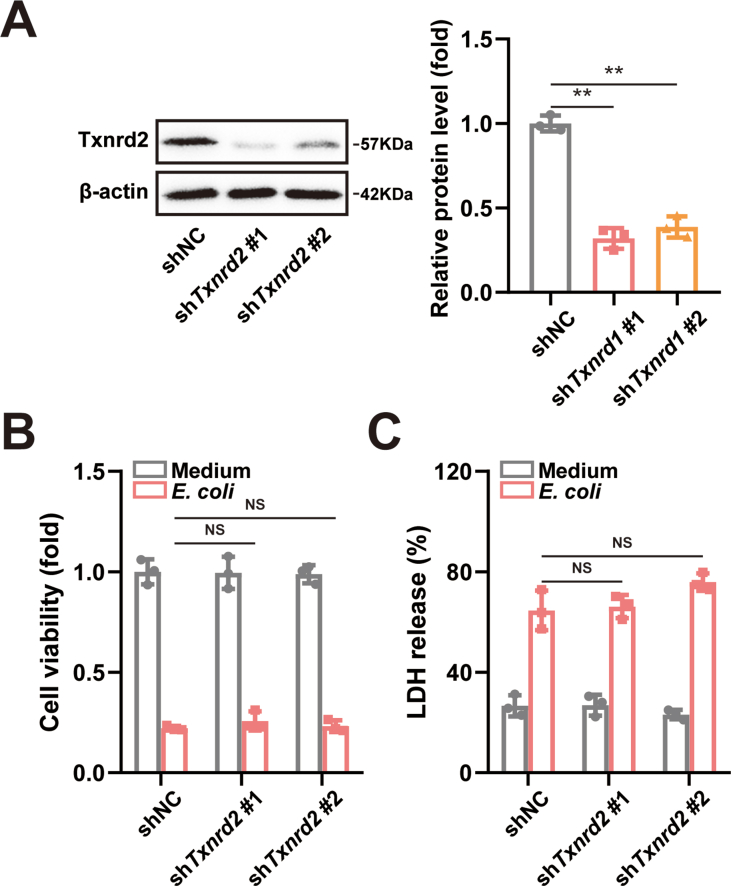
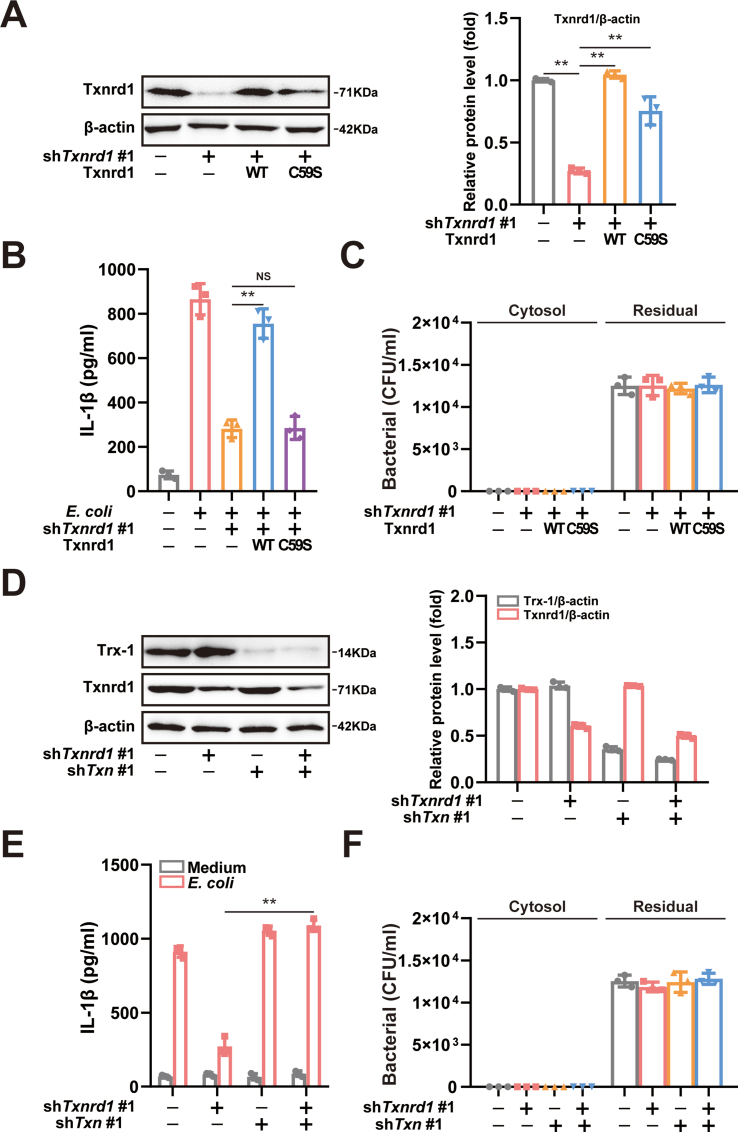
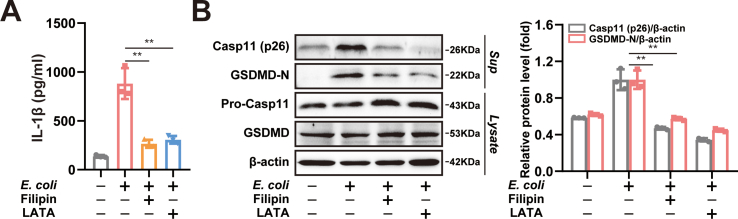
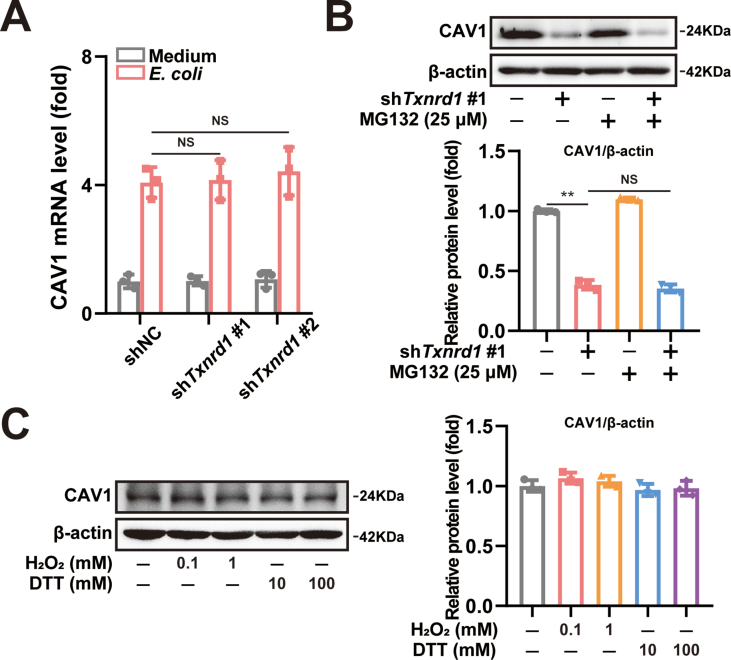
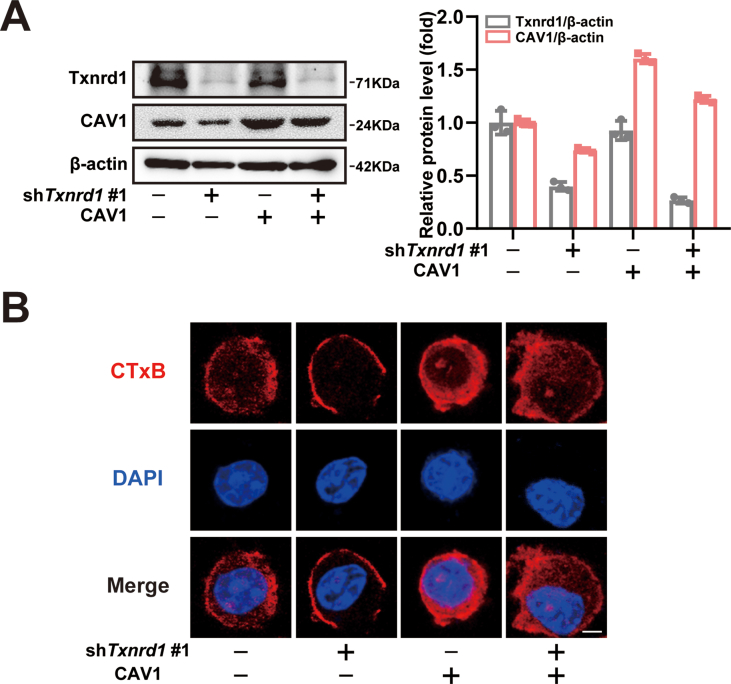
Sepsis is a common complication of infections that significantly impacts the survival of critically patients. Currently, effective pharmacological treatment strategies are lacking. Auranofin, known as an inhibitor of Thioredoxin reductase (TrxR), exhibits anti-inflammatory activity, but its role in sepsis is not well understood. Here, we demonstrate the significant inhibitory effect of Auranofin on sepsis in a cecal ligation and puncture (CLP) mouse model. In vitro, Auranofin inhibits pyroptosis triggered by Caspase-11 activation. Further investigations reveal that inhibiting TrxR1 suppresses macrophage pyroptosis induced by E. coli, while TrxR2 does not exhibit this effect. TrxR1, functioning as a reductase, regulates the oxidative-reductive status of Thioredoxin-1 (Trx-1). Mechanistically, the modulation of Trx-1's reductive activity by TrxR1 may be involved in Caspase-11 activation-induced pyroptosis. Additionally, inhibiting TrxR1 maintains Trx-1 in its oxidized state. The oxidized form of Trx-1 interacts with Caveolin-1 (CAV1), regulating outer membrane vesicle (OMV) internalization. In summary, our study suggests that inhibiting TrxR1 suppresses OMV internalization by maintaining the oxidized form of Trx-1, thereby restricting Caspase-11 activation and alleviating sepsis.

Keywords: Caspase-11; Caveolin-1; Outer membrane vesicle; Thioredoxin-1; TrxR.


Conflict of interest statement

Declaration of competing interest All authors declare that they have no conflict of interest.

Figures

Fig. 1
Fig. 1
Auranofin alleviates CLP-induced sepsis in mice. (A) Analysis of animal survival in mice with or without intraperitoneal administration of Auranofin (5 mg/kg) after CLP-induced sepsis (Kaplan-Meier survival analysis). n = 10 per group. (B) Representative images of H&E stains of liver and lung in mice from indicated group. Scale bars: 50 μm. (C) The ratio of spleen weight to percentage of body weight in mice from indicated group. n = 5 per group. (D) The LDH, BUN and ALT levels in the serum of the indicated group mice. n = 5 per group. (E) Bacteria burden in the blood of the indicated group mice. n = 5 per group. (F) Analysis of serum levels of TNF-α, IL-1β and IL-18 in the indicated group mice. n = 5 per group. (G and H) Western blot analysis of Caspase-11 (Casp11) and GSDMD expression in the liver tissues(G) or lung tissues(H) of the indicated group mice. β-actin served as the loading control. n = 3 per group. The values are expressed as the mean ± SD, *p < 0.05, **p < 0.01.
Fig. 2
Fig. 2
Auranofin inhibits pyroptosis and Caspase-11 inflammasome activation in macrophages. (A) Analysis of cell viability in E. coli-infected J774A.1 or BMDMs treated with different concentrations Auranofin. n = 3 per group. (B) Analysis of LDH release in E. coli-infected J774A.1 or BMDMs treated with different concentrations Auranofin. n = 3 per group. (C) Analysis of PI uptakes in E. coli-infected J774A.1 or BMDMs treated with different concentrations Auranofin. n = 5 per group. (D) Western blot analysis of Caspase-11 and GSDMD expression in supernatants (Sup) and lysate in E. coli-infected J774A.1 or BMDMs, which treated with different concentrations Auranofin. n = 3 per group. (E) Analysis of TrxR1 activity in J774A.1 cells treated with different concentrations Auranofin. n = 5 per group. (F) Agar plating for bacterial counts in the cytosolic and residual fractions of E. coli-infected J774A.1 cells treated with different Auranofin. n = 3 per group. (G) LAL assay for LPS (EU, endotoxin units) in the cytosolic fractions of E. coli-infected J774A.1 cells treated with Auranofin. n = 3 per group. The values are expressed as the mean ± SD, *p < 0.05, **p < 0.01.
Fig. 3
Fig. 3
Trx-1 involves in the regulation of TrxR1 on pyroptosis and Caspase-11 inflammasome activation in macrophages. (A) Analysis of cell viability in E. coli-infected J774A.1 cells expressing Txnrd1 shRNA and Txnrd1 WT or C59S variant cDNA. n = 3 per group. (B) Analysis of LDH release in E. coli-infected J774A.1 cells expressing Txnrd1 shRNA and Txnrd1 WT or C59S variant cDNA. n = 3 per group. (C) LAL assay for LPS (EU, endotoxin units) in the cytosolic fractions of E. coli-infected J774A.1 cells expressing Txnrd1 shRNA and Txnrd1 WT or C59S variant cDNA. n = 3 per group. (D) Western blot analysis of Caspase-11 and GSDMD expression in supernatants (Sup) and lysate in E. coli-infected J774A.1 cells expressing Txnrd1 shRNA and Txnrd1 WT or C59S variant cDNA. n = 3 per group. (E) Analysis of cell viability in E. coli-infected J774A.1 cells expressing Txnrd1 and Txn shRNA. n = 3 per group. (F) Analysis of LDH release in E. coli-infected J774A.1 cells expressing Txnrd1 and Txn shRNA. n = 3 per group. (G) LAL assay for LPS (EU, endotoxin units) in the cytosolic fractions of E. coli-infected J774A.1 cells expressing Txnrd1 and Txn shRNA. n = 3 per group. The values are expressed as the mean ± SD, **p < 0.01.
Fig. 4
Fig. 4
TrxR1 controls pyroptosis and Caspase-11 inflammasome activation by maintaining the Trx-1 reductive activity. (A) Analysis of cell viability in E. coli-infected J774A.1 cells expressing Txnrd1 and Txn shRNA and Txn WT or C32/35S variant cDNA. n = 3 per group. (B) Analysis of LDH release in E. coli-infected J774A.1 cells expressing Txnrd1 and Txn shRNA and Txn WT or C32/35S variant cDNA. n = 3 per group. (C) Analysis of IL-1β in supernatants of E. coli-infected J774A.1 cells expressing Txnrd1 and Txn shRNA and Txn WT or C32/35S variant cDNA. n = 3 per group. (D) Western blot analysis of Caspase-11 and GSDMD expression in supernatants (Sup) and lysate in E. coli-infected J774A.1 cells expressing Txnrd1 and Txn shRNA and Txn WT or C32/35S variant cDNA. n = 3 per group. (E) LAL assay for LPS (EU, endotoxin units) in the cytosolic fractions of E. coli-infected J774A.1 cells expressing Txnrd1 and Txn shRNA and Txn WT or C32/35S variant cDNA. n = 3 per group. (F) Analysis of LDH release in E. coli-infected J774A.1 cells treated with GA, DNCB and H2O2. n = 3 per group. (G) Analysis of LDH release in E. coli-infected J774A.1 cells upon Txn knockdown treated with GA and DNCB. n = 3 per group. The values are expressed as the mean ± SD, *p < 0.05, **p < 0.01.
Fig. 5
Fig. 5
TrxR1 controls the uptake of OMVs. (A) Intracellular distribution of Rab5 and LPS in E. coli-infected J774A.1 cells expressing Txnrd1 shRNA. Scale bars: 10 μm. Pearson’s correlation coefficients for the co-localization of Rab5 with LPS from multiple confocal images. n = 10 per group. (B) Intracellular distribution of Rab7 and LPS in E. coli-infected J774A.1 cells expressing Txnrd1 shRNA. Scale bars: 10 μm. Pearson’s correlation coefficients for the co-localization of Rab5 with LPS from multiple confocal images. n = 10 per group. (C) Intracellular distribution of Rab5 and LPS in E. coli-infected J774A.1 cells treated with Auranofin or CQ. Scale bars: 10 μm. Pearson’s correlation coefficients for the co-localization of Rab5 with LPS from multiple confocal images. n = 10 per group. (D) LAL assay for LPS (EU, endotoxin units) in the cytosolic fractions of E. coli-infected J774A.1 cells treated with Auranofin or CQ. n = 3 per group. (E) The endocytosis of DiO-labeled OMVs in J774A.1 cells upon Txnrd1 knockdown. Scale bars: 10 μm. The average signal density of internalized green fluorescent OMVs. n = 10 per group. (F) The fluorescent of Alexa555-conjugated Cholera Toxin Subunit B (CTxB) in J774A.1 cells expressing Txnrd1 and Txn shRNA and Txn WT or C32/35S variant cDNA. Scale bars: 10 μm. The values are expressed as the mean ± SD, **p < 0.01. (For interpretation of the references to colour in this figure legend, the reader is referred to the Web version of this article.)
Fig. 6
Fig. 6
Oxidized Trx-1 binds to CAV1. (A) Intracellular distribution of Trx-1 and CAV1 in E. coli-infected J774A.1 cells expressing Txnrd1 and Txn shRNA and Txn WT or C59S variant cDNA. Scale bars: 10 μm. Pearson’s correlation coefficients for the co-localization of Trx-1 with CAV1 from multiple confocal images. n = 10 per group. (B) The interaction between Trx-1 and CAV1 in HEK-293T cells. (C) The binding of WT, C32S, C35S or C32/35S Trx-1 to CAV1 in HEK-293T cells. (D) The binding of Trx-1 to CAV1 in J774A.1 cells treated with Auranofin, GA or DNCB. (E) The interaction between Trx-1 and anti-Myc beads treated with the indicated concentrations of oxidants and antioxidants. The flow-through is the unbound fraction after oxidant or antioxidant treatment. (F) The binding of WT or C32/35S Trx-1 to CAV1 in HEK-293T cells treated with Auranofin. (G) Schematic representation of the CAV1 domain (top). The binding of full length or various mutants of CAV1 to Trx-1 in HEK-293T cells (bottom). The values are expressed as the mean ± SD, **p < 0.01.
Fig. 7
Fig. 7
TrxR1 maintains CAV1 cellular membrane localization and protein levels. (A) Intracellular distribution of CAV1 and PM-mAG1 in J774A.1 cells expressing Txnrd1 and Txn shRNA and Txn WT or C32/35S variant cDNA. Scale bars: 10 μm. Pearson’s correlation coefficients for the co-localization of CAV1 with PM-mAG1 from multiple confocal images. n = 10 per group. (B) Western blot analysis of CAV1 expression in E. coli-infected J774A.1 cells upon Txnrd1 knockdown. n = 3 per group. (C) Western blot analysis of CAV1 expression in J774A.1 cells upon Txnrd1 knockdown treated with CQ. n = 3 per group. (D) Western blot analysis of CAV1 expression in J774A.1 cells expressing Txnrd1 and Txn shRNA and Txn WT or C32/35S variant cDNA. n = 3 per group. (E) Western blot analysis of CAV1 expression in J774A.1 cells treated with Auranofin, GA or DNCB. n = 3 per group. (F) Intracellular distribution of LAMP and CAV1 in J774A.1 cells upon Txnrd1 knockdown treated with CQ. Scale bars: 10 μm. Pearson’s correlation coefficients for the co-localization of LAMP with CAV1 from multiple confocal images. n = 10 per group. (G) Analysis of ubiquitination of CAV1 in J774A.1 cells expressing Txnrd1 and Txn shRNA and Txn WT or C59S variant cDNA. The values are expressed as the mean ± SD, **p < 0.01.
Fig. 8
Fig. 8
Overexpression of CAV1 rescued TrxR1-regulated pyroptosis and Caspase-11 inflammasome activation. (A) Analysis of cell viability in E. coli-infected J774A.1 cells expressing Txnrd1 shRNA and CAV1 cDNA. n = 3 per group. (B) Analysis of LDH release in E. coli-infected J774A.1 cells expressing Txnrd1 shRNA and CAV1 cDNA. n = 3 per group. (C) Analysis of IL-1β in supernatants of E. coli-infected J774A.1 cells expressing Txnrd1 shRNA and CAV1 cDNA. n = 3 per group. (D) Western blot analysis of Caspase-11 and GSDMD expression in supernatants (Sup) and lysate in E. coli-infected J774A.1 cells expressing Txnrd1 shRNA and CAV1 cDNA. n = 3 per group. (E) LAL assay for LPS (EU, endotoxin units) in the cytosolic fractions of E. coli-infected J774A.1 cells expressing Txnrd1 shRNA and CAV1 cDNA. n = 3 per group. (F) The endocytosis of DiO-labeled OMVs in J774A.1 cells expressing Txnrd1 shRNA and CAV1 cDNA. Scale bars: 10 μm. The average signal density of internalized green fluorescent OMVs. n = 10 per group.The values are expressed as the mean ± SD, **p < 0.01. (For interpretation of the references to colour in this figure legend, the reader is referred to the Web version of this article.)
Fig. 9
Fig. 9
Role of TrxR1 inhibition by Auranofin in preventing Caspase-11 induced pyroptosis. TrxR1 plays a crucial role in controlling the redox state of Trx-1, thereby affecting pyroptosis. By inhibiting TrxR1, Auranofin keeps Trx-1 in an oxidized state, which influences Caveolin-1 mediated OMV internalization and prevents pyroptosis triggered by Caspase-11 activation.
Fig. S1
Fig. S1
Auranofin inhibits IL-1β levels in E. coli-infected macrophages. (A) Analysis of IL-1β in supernatants of E. coli-infected J774A.1 or BMDMs treated with different concentrations Auranofin. n = 3 per group. (B) Western blot analysis of Na+-K+ ATPase, EEA1, Rab7, LAMP and β-actin in cytosol and residual fractions of E. coli-infected J774A.1 cells treated with Auranofin. n = 3 per group. The values are expressed as the mean ± SD, *p < 0.05, **p < 0.01.
Fig. S2
Fig. S2
Knockdown of Txnrd1 inhibits pyroptosis and Caspase-11 inflammasome activation in macrophages. (A) Western blot analysis of TrxR1 expression in J774A.1 cells upon Txnrd1 knockdown. n = 3 per group. (B) Analysis of cell viability in E. coli-infected J774A.1 cells upon Txnrd1 knockdown. n = 3 per group. (C) Analysis of LDH release in E. coli-infected J774A.1 cells upon Txnrd1 knockdown. n = 3 per group. (D) Analysis of PI uptakes in E. coli-infected J774A.1 cells upon Txnrd1 knockdown. n = 5 per group. (E) Analysis of IL-1β in supernatants of E. coli-infected J774A.1 cells upon Txnrd1 knockdown. n = 3 per group. (F) Western blot analysis of Caspase-11 and GSDMD expression in supernatants (Sup) and lysate in E. coli-infected J774A.1 cells upon Txnrd1 knockdown. n = 3 per group. (G) LAL assay for LPS (EU, endotoxin units) in the cytosolic fractions of E. coli-infected J774A.1 cells upon Txnrd1 knockdown. n = 3 per group. The values are expressed as the mean ± SD, *p < 0.05, **p < 0.01.
Fig. S3
Fig. S3
TrxR2 does not regulate E. coli infection-induced pyroptosis. (A) Western blot analysis of TrxR2 expression in J774A.1 cells upon Txnrd2 knockdown. n = 3 per group. (B) Analysis of cell viability in E. coli-infected J774A.1 cells upon Txnrd2 knockdown. n = 3 per group. (C) Analysis of LDH release in E. coli-infected J774A.1 cells upon Txnrd2 knockdown. n = 3 per group. The values are expressed as the mean ± SD, *p < 0.05, **p < 0.01.
Fig. S4
Fig. S4
TrxR1 regulates pyroptosis through Trx-1 but does not impact E. coli adherence in macrophages. (A) Western blot analysis of TrxR1 expression in J774A.1 cells expressing Txnrd1 shRNA and Txnrd1 WT or C59S variant cDNA. n = 3 per group. (B) Analysis of IL-1β in supernatants of E. coli-infected J774A.1 cells expressing Txnrd1 shRNA and Txnrd1 WT or C59S variant cDNA. n = 3 per group. (C) Agar plating for bacterial counts in the cytosolic and residual fractions of E. coli-infected J774A.1 cells expressing Txnrd1 shRNA and Txnrd1 WT or C59S variant cDNA. n = 3 per group. (D) Western blot analysis of Trx-1 and TrxR1 expression in J774A.1 cells expressing Txnrd1 and Txn shRNA. n = 3 per group. (E) Analysis of IL-1β in supernatants of E. coli-infected J774A.1 cells expressing Txnrd1 and Txn shRNA. n = 3 per group. (F) Agar plating for bacterial counts in the cytosolic and residual fractions of E. coli-infected J774A.1 cells expressing expressing Txnrd1 and Txn shRNA. n = 3 per group. The values are expressed as the mean ± SD, *p < 0.05, **p < 0.01.
Fig. S5
Fig. S5
Caveolin-endocytosis inhibitors suppress Caspase-11 inflammasome activation in macrophages. (A) Analysis of IL-1β in supernatants of E. coli-infected J774A.1 cells treated with Filipin or LATA. n = 3 per group. (B) Western blot analysis of Caspase-11 and GSDMD expression in supernatants (Sup) and lysate in E. coli-infected J774A.1 cells treated with Filipin or LATA. n = 3 per group. The values are expressed as the mean ± SD, *p < 0.05, **p < 0.01.
Fig. S6
Fig. S6
TrxR1 plays a role in maintaining the protein levels of CAV1. (A) qPCR analysis of CAV1 mRNA levels in E. coli-infected J774A.1 cells upon Txnrd1 knockdown. n = 3 per group. (B) Western blot analysis of CAV1 expression in J774A.1 cells upon Txnrd1 knockdown treated with MG132. n = 3 per group. (C) Western blot analysis of CAV1 expression in J774A.1 cells treated with H2O2 or DTT. n = 3 per group. The values are expressed as the mean ± SD, *p < 0.05, **p < 0.01.
Fig. S7
Fig. S7
CAV1 involves in the regulation of CTxB internalization by TrxR1. (A) Western blot analysis of TrxR1 and CAV1 expression in J774A.1 cells expressing Txnrd1 shRNA and CAV1 cDNA. n = 3 per group. (B) The fluorescent of Alexa555-conjugated Cholera Toxin Subunit B (CTxB) in J774A.1 cells expressing Txnrd1 shRNA and CAV1 cDNA. Scale bars: 10 μm.

Similar articles

Cited by

References

    1. Opal S.M. Endotoxins and other sepsis triggers. Contrib. Nephrol. 2010;167:14–24. - PubMed
    1. Rallis D., Lithoxopoulou M., Pervana S., Karagianni P., Hatziioannidis I., Soubasi V., et al. Clinical chorioamnionitis and histologic placental inflammation: association with early-neonatal sepsis. J. Matern. Fetal Neonatal Med. 2022;35(25):8090–8096. - PubMed
    1. Lakshmikanth C.L., Jacob S.P., Chaithra V.H., de Castro-Faria-Neto H.C., Marathe G.K. Sepsis: in search of cure. Inflamm. Res. 2016;65(8):587–602. - PubMed
    1. Yang R., Zhang X. A potential new pathway for heparin treatment of sepsis-induced lung injury: inhibition of pulmonary endothelial cell pyroptosis by blocking hMGB1-LPS-induced caspase-11 activation. Front. Cell. Infect. Microbiol. 2022;12 - PMC - PubMed
    1. Kiczak L., Paslawska U., Gozdzik W., Adamik B., Zielinska M., Zielinski S., et al. Effect of low-dose hydrocortisone and inhaled nitric oxide on inflammatory mediators and local pulmonary metalloproteinases activity in LPS-induced sepsis in piglets. Sci. Rep. 2023;13(1) - PMC - PubMed

LinkOut - more resources