Multicenter Study
. 2024 Aug:106:105257.
doi: 10.1016/j.ebiom.2024.105257. Epub 2024 Jul 25.

Blood pressure response index and clinical outcomes in patients with septic shock: a multicenter cohort study

Affiliations
Multicenter Study

Blood pressure response index and clinical outcomes in patients with septic shock: a multicenter cohort study

Yujie Chen et al. EBioMedicine. 2024 Aug.

Abstract

Background: Sepsis is a leading cause of mortality in intensive care units and vasoactive drugs are widely used in septic patients. The cardiovascular response of septic shock patients during resuscitation therapies and the relationship of the cardiovascular response and clinical outcome has not been clearly described.

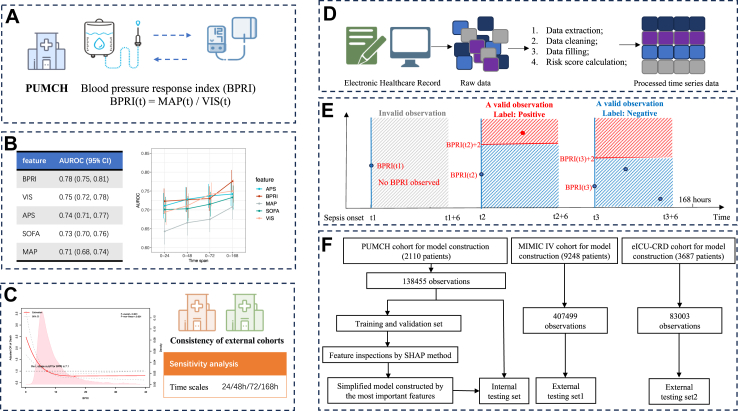
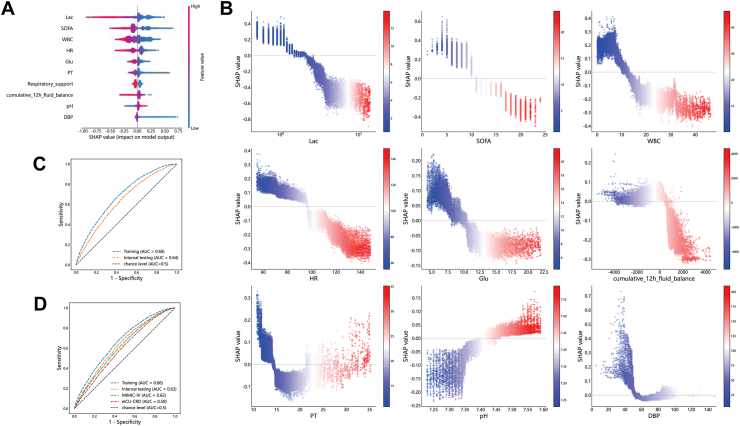
Methods: We included adult patients admitted to the ICU with sepsis from Peking Union Medical College Hospital (internal), Medical Information Mart for Intensive Care IV (MIMIC-IV) and eICU Collaborative Research Database (eICU-CRD). The Blood Pressure Response Index (BPRI) was defined as the ratio between the mean arterial pressure and the vasoactive-inotropic score. BRRI was compared with existing risk scores on predicting in-hospital death. The relationship between BPRI and in-hospital mortality was calculated. A XGBoost's machine learning model identified the features that influence short-term changes in BPRI.

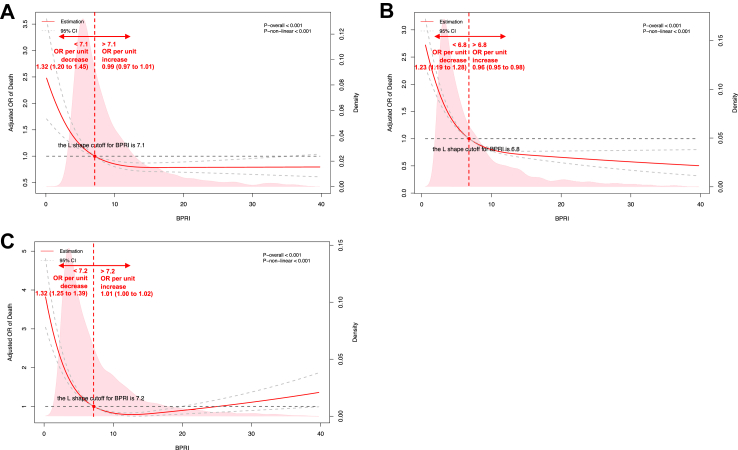
Findings: There were 2139, 9455, and 4202 patients in the internal, MIMIC-IV and eICU-CRD cohorts, respectively. BPRI had a better AUROC for predicting in-hospital mortality than SOFA (0.78 vs. 0.73, p = 0.01) and APS (0.78 vs. 0.74, p = 0.03) in the internal cohort. The estimated odds ratio for death per unit decrease in BPRI was 1.32 (95% CI 1.20-1.45) when BPRI was below 7.1 vs. 0.99 (95% CI 0.97-1.01) when BPRI was above 7.1 in the internal cohort; similar relationships were found in MIMIC-IV and eICU-CRD. Respiratory support and latest cumulative 12-h fluid balance were intervention-related features influencing BPRI.

Interpretation: BPRI is an easy, rapid, precise indicator of the response of patients with septic shock to vasoactive drugs. It is a comparable and even better predictor of prognosis than SOFA and APS in sepsis and it is simpler and more convenient in use. The application of BPRI could help clinicians identify potentially at-risk patients and provide clues for treatment.

Funding: Fundings for the Beijing Municipal Natural Science Foundation; the National High Level Hospital Clinical Research Funding; the CAMS Innovation Fund for Medical Sciences (CIFMS) from Chinese Academy of Medical Sciences and the National Key R&D Program of China, Ministry of Science and Technology of the People's Republic of China.

Keywords: Dynamic risk model; Machine learning; Mortality; Septic shock; Vascular reactivity.


Conflict of interest statement

Declaration of interests All authors disclosed no potential conflict of interest.

Figures

Fig. 1
Fig. 1
Overview of the study design and workflow. A: Blood pressure response index (BPRI) proposed. B: Comparison of AUROCs for predicting in-hospital mortality between BPRI and other variables for different time spans. C: Relationship between BPRI and risk of in-hospital mortality. D: Dynamic risk model of BPRI change: data extraction procedure. E: Dynamic risk model of BPRI change: dataset construction and outcome definition. F: Dynamic risk model of BPRI change: flowchart of the study design.
Fig. 2
Fig. 2
Comparison of AUROCs for predicting in-hospital mortality between BPRI, MAP, VIS, SOFA score, and APS within different time spans. A: internal (PUMCH) cohort: The BPRI had a superior ability to predict in-hospital mortality compared to other indices within the first 24 h, 48 h and 168 h following sepsis diagnosis. B: MIMIC-IV cohort: The BPRI outperformed the APS across all time windows and was equivalent to the SOFA score within the first 168 h following sepsis diagnosis in predicting in-hospital mortality. C: eICU-CRD cohort: The BPRI had a superior or equal performance in predicting in-hospital mortality compared to the SOFA score across all time spans. APS, Acute Physiology Score; BPRI, blood pressure response index; MAP, mean arterial pressure; SOFA, Sequential Organ Failure Assessment; VIS, vasoactive-inotropic score.
Fig. 3
Fig. 3
The restricted cubic spline for the relationships between BPRI (the minimum value within 168 h after sepsis diagnosis) and in-hospital mortality in three cohorts. Similar L-shaped relationship curves and cut-off values were observed in the three cohorts: when BPRI was below the cut-off value, the risk of in-hospital mortality increased rapidly with decreasing BPRI; when BPRI was above the cut-off value, the risk of in-hospital mortality changed slightly with increasing BPRI. A: internal (PUMCH) cohort (cutoff value is 7.1). B: MIMIC-IV cohort (cutoff value is 6.8). C: eICU-CRD cohort (cutoff value is 7.2). Estimates adjusted for age, gender, SOFA score, and group of calendar year. OR, odds ratio. The solid red line represented the estimated ORs and the dashed grey lines represented corresponding 95% confidence intervals. The horizontal dashed grey line and the red dot indicated the reference value. Solid pink curves show the fraction of the population with different level of BPRI. The p value for overall association <0.05 manifested a significant association, whatever the shape of the relationship curve was. The p value for non-linear association <0.05 indicated a nonmonotonic dose–response curve, otherwise, a monotonic relationship was suggested.
Fig. 4
Fig. 4
Feature inspection and model evaluation. A: SHAP summary plot for the top 10 features of the dynamic risk model (full model). B: SHAP dependence plot for the top 10 continuous features of the dynamic risk model (full model). The x-axis represents the actual values and the y-axis represents the SHAP values. Each dot represents an observation. Colorbar scale represents the actual values of feature, the greater the value, the redder the color. SHAP values for specific features that exceeding zero represents an increased probability of the increase in BPRI. C: ROC curves for dynamic risk model of the training, internal testing cohort (full model). D: ROC curves for simplified dynamic risk model of the training, internal testing, MIMIC-IV, and eICU-CRD cohort. Abbreviations: Lac, lactate level; SOFA, sequential organ failure assessment; WBC, white blood cell count; HR, heart rate; Glu, glucose; PT, prothrombin time; DBP, diastolic blood pressure.

References

    1. Pudjiadi A.H., Pramesti D.L., Pardede S.O., Djer M.M., Rohsiswatmo R., Kaswandani N. Validation of the vasoactive-inotropic score in predicting pediatric septic shock mortality: a retrospective cohort study. Int J Crit Illn Inj Sci. 2021;11(3):117–122. - PMC - PubMed
    1. Demirhan S., Topcuoglu S., Karadag N., Ozalkaya E., Karatekin G. Vasoactive inotropic score as a predictor of mortality in neonatal septic shock. J Trop Pediatr. 2022;68(6) - PubMed
    1. Kallekkattu D., Rameshkumar R., Chidambaram M., Krishnamurthy K., Selvan T., Mahadevan S. Threshold of inotropic score and vasoactive-inotropic score for predicting mortality in pediatric septic shock. Indian J Pediatr. 2022;89(5):432–437. - PMC - PubMed
    1. Song J., Cho H., Park D.W., et al. Vasoactive-inotropic score as an early predictor of mortality in adult patients with sepsis. J Clin Med. 2021;10(3):495. - PMC - PubMed
    1. Kelly R.P., Ting C.T., Yang T.M., et al. Effective arterial elastance as index of arterial vascular load in humans. Circulation. 1992;86(2):513–521. - PubMed

Publication types

LinkOut - more resources