. 2024 Sep 5;187(18):4981-4995.e14.
doi: 10.1016/j.cell.2024.06.037. Epub 2024 Jul 25.

Natural malaria infection elicits rare but potent neutralizing antibodies to the blood-stage antigen RH5

Affiliations

Natural malaria infection elicits rare but potent neutralizing antibodies to the blood-stage antigen RH5

Lawrence T Wang et al. Cell. .

Abstract

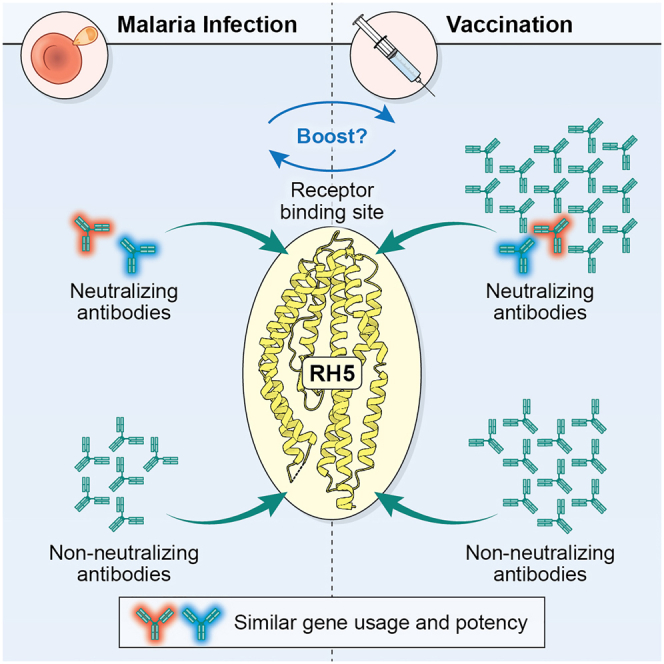
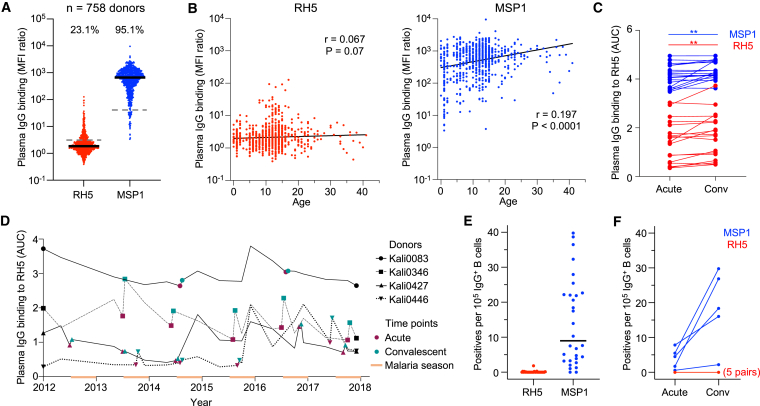
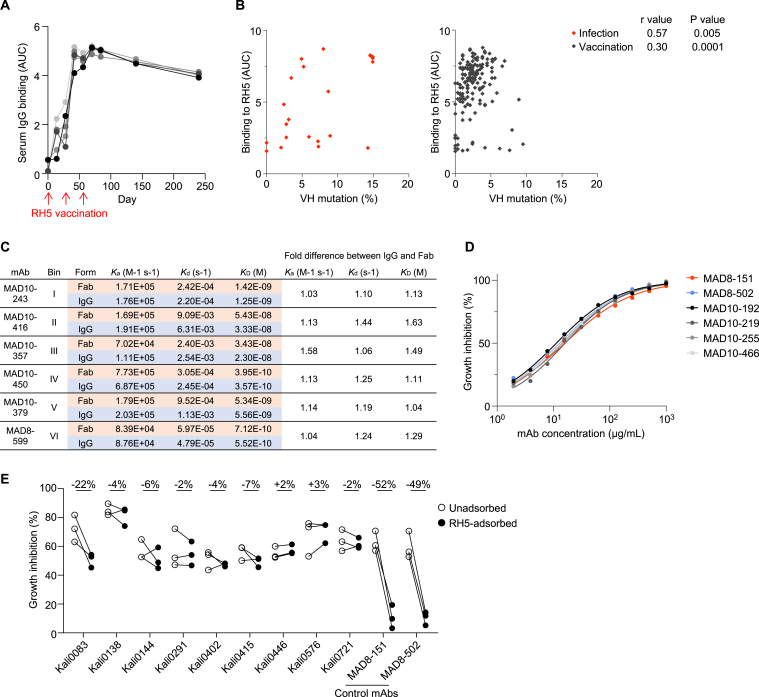
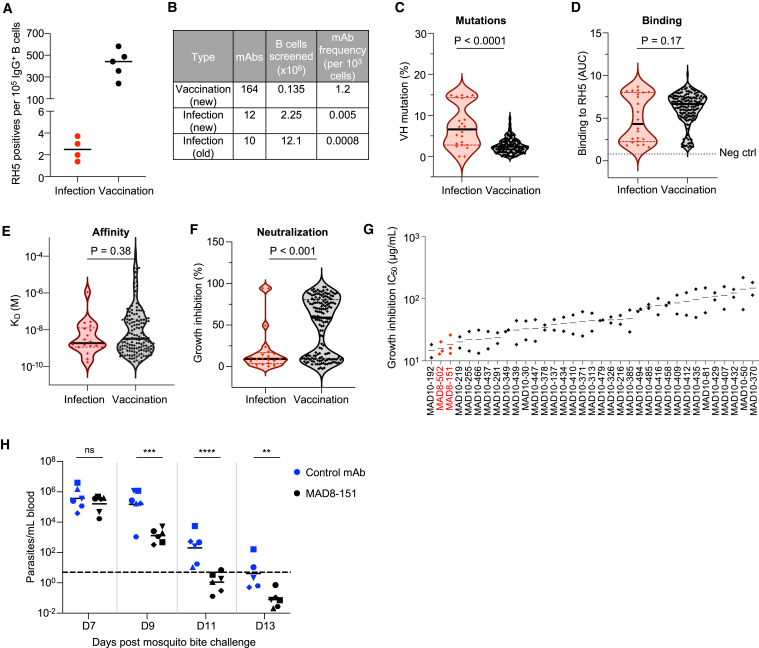
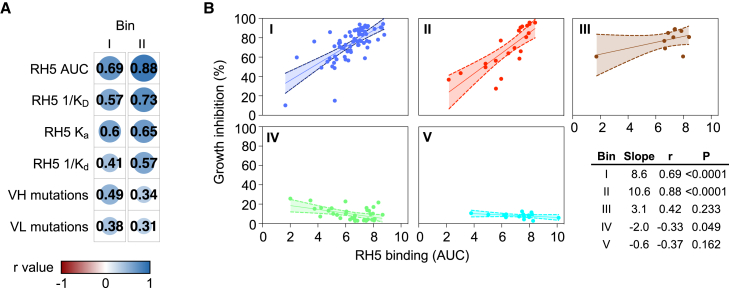
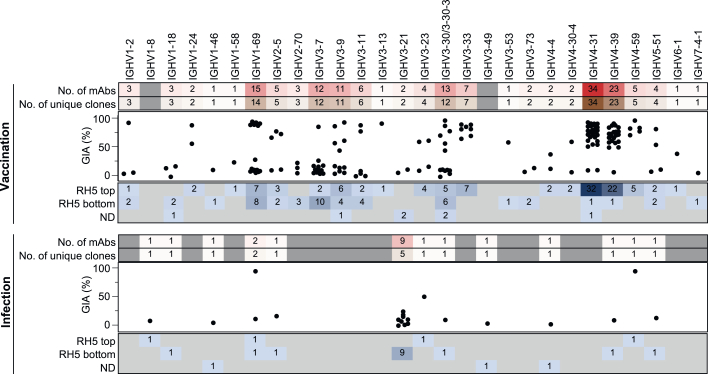
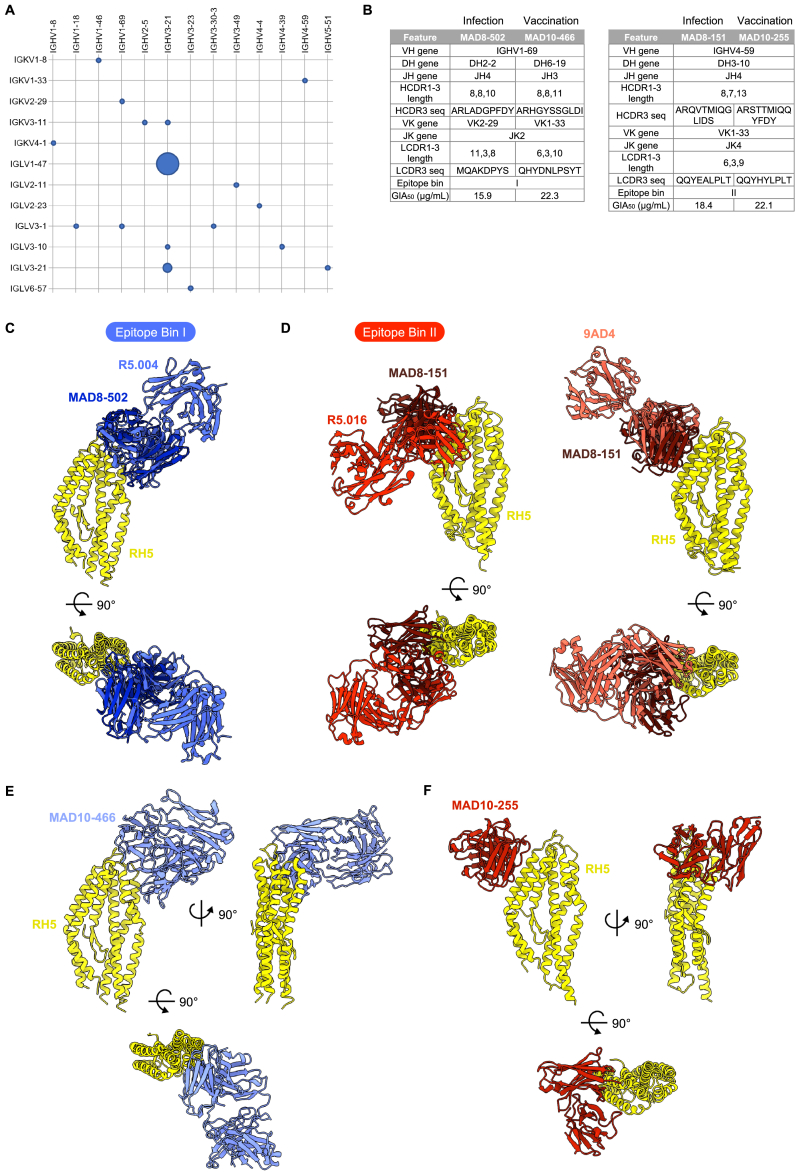
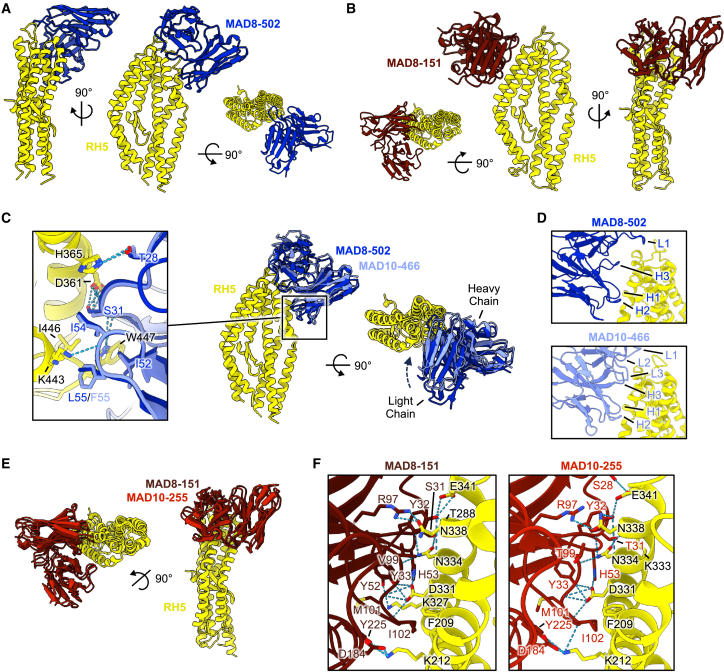
Plasmodium falciparum reticulocyte-binding protein homolog 5 (RH5) is the most advanced blood-stage malaria vaccine candidate and is being evaluated for efficacy in endemic regions, emphasizing the need to study the underlying antibody response to RH5 during natural infection, which could augment or counteract responses to vaccination. Here, we found that RH5-reactive B cells were rare, and circulating immunoglobulin G (IgG) responses to RH5 were short-lived in malaria-exposed Malian individuals, despite repeated infections over multiple years. RH5-specific monoclonal antibodies isolated from eight malaria-exposed individuals mostly targeted non-neutralizing epitopes, in contrast to antibodies isolated from five RH5-vaccinated, malaria-naive UK individuals. However, MAD8-151 and MAD8-502, isolated from two malaria-exposed Malian individuals, were among the most potent neutralizers out of 186 antibodies from both cohorts and targeted the same epitopes as the most potent vaccine-induced antibodies. These results suggest that natural malaria infection may boost RH5-vaccine-induced responses and provide a clear strategy for the development of next-generation RH5 vaccines.

Keywords: Plasmodium falciparum; RH5; malaria; monoclonal antibodies; natural infection; vaccine design.


Conflict of interest statement

Declaration of interests J.T., L.T.W., and A.J.R.C. are co-inventors on a provisional patent filed on the mAbs described in this study. J.R.B., K.M., M.K.H., and S.J.D. are inventors on patent applications relating to RH5 malaria vaccines and/or antibodies. A.M.M. has an immediate family member who is an inventor on patent applications relating to RH5 malaria vaccines and antibodies. The content of this publication does not necessarily reflect the views or policies of the DHHS or of the institutions and companies with which the authors are affiliated.

Figures

None
Graphical abstract
Figure 1
Figure 1
Malaria-exposed individuals have weak B cell responses to RH5 despite repeated infection (A) IgG binding to RH5 and MSP1 of plasma from individuals living in Kalifabougou, Mali (n = 758 donors). Median fluorescence intensity (MFI) values shown are after division with values for the negative control antigen, CD4. Bars show median values. Dashed lines show average IgG binding of plasma from 42 US donors. The numbers above each group show the percentage of individuals with plasma binding above this negative control average. (B) Cross-sectional analysis of relationship between plasma IgG binding to RH5 and MSP1 with age. Correlation r and p values were determined using Spearman correlation. (C) Plasma IgG binding to RH5 of samples from paired acute and convalescent time points. Acute samples were collected upon diagnosis of clinical malaria and convalescent samples were collected ∼1 week after the acute samples. The Wilcoxon sign-rank test was used to analyze changes in binding between the two time points. ∗∗p < 0.01. (D) RH5-specific IgG levels in plasma of four Malian donors from whom we isolated RH5-specific mAbs over a period of 6 years. The orange bars denote the malaria season, which occurs in the latter half of each year. (E) Frequency of RH5- or MSP1-positive wells of cultured IgG+ B cells from 30 analyzed donors. Two runs where B cells from different donors were pooled into the same wells were excluded from this analysis. Bars show median values. (F) Frequency of RH5- or MSP1-positive wells of cultured IgG+ B cells from five pairs of acute and convalescent samples. Two pairs are from the same donor (Kali0346) but were taken from different malaria seasons. For RH5, the five pairs are completely overlapping. See also Figure S1.
Figure S1
Figure S1
Infection- and vaccination-induced antibody responses to RH5, related to Figures 1 and 2 (A) Serum IgG reactivity to RH5 after three doses of the RH5/AS01 vaccine in five malaria-naive individuals. (B) Association between RH5 binding and VH mutations of RH5-specific mAbs from natural infection (red) and vaccination (black). p and r values were calculated based on Spearman correlation. (C) Binding kinetics of RH5-specific IgG (targeting bins I–VI) and corresponding Fabs to RH5. Equimolar binding arms of each form (4.2 nM Fab and 2.1 nM IgG) were compared. Ka, association rate constant; Kd, dissociation rate constant; KD, equilibrium dissociation constant. (D) Growth inhibition titration curves of the six most potent RH5-specific mAbs. Data are shown from a representative experiment out of n = 2–3 experiments. MAD8–151 and MAD8–502 were isolated from infected donors while MAD10–192, MAD10–219, MAD10–255, and MAD10–466 were isolated from vaccinated donors. (E) Growth inhibition mediated by polyclonal IgG from naturally infected donors in an antigen-reversal assay, where samples are tested for activity with and without adsorption of RH5-specific antibodies with soluble antigen. Each pair of points represents an independent experiment. MAD8–151 and MAD8–502 are control RH5-specific mAbs. Kali0083 is the source donor of MAD8–502 and Kali0446 is the source donor of MAD8–151. The percentages at the top of the figure refer to the mean difference between the RH5-adsorbed and -unadsorbed inhibition values.
Figure 2
Figure 2
Malaria exposure elicits rare but potent neutralizing antibodies targeting RH5 (A) Frequency of RH5-positive wells of cultured IgG+ B cells from infected versus vaccinated donors. Bars show median values. (B) Number of mAbs isolated from infected versus vaccinated donors. The “new” method refers to the more sensitive but labor-intensive B cell screening approach while the “old” method refers to the original approach used to investigate B cells in Figure 1. (C) Heavy chain variable (VH) mutation frequencies of mAbs isolated from infected versus vaccinated donors. Bars show median values and dashed lines show quartiles. p value was calculated using the Mann-Whitney U test. (D) RH5 binding of mAbs isolated from infected versus vaccinated donors. Bars show median values and dashed lines show quartiles. The dotted line shows the binding of a negative control mAb, VRC01-LS. p value was calculated using the Mann-Whitney U test. (E) Binding affinity of mAbs isolated from infected versus vaccinated donors, as measured by the equilibrium dissociation constant (KD). Bars show median values and dashed lines show quartiles. p value was calculated using the Mann-Whitney U test. Stars indicate mAbs with a dissociation rate at the limit of detection (1 × 10−5 s−1), which was the value used to calculate the KD in this graph. Data were obtained for 18/22 infection-derived mAbs and 151/164 vaccination-derived mAbs; the remaining mAbs had insufficient binding signal or were acid-denatured during the workflow. (F) Growth inhibition of mAbs isolated from infected versus vaccinated donors. All mAbs were tested at 1 mg/mL. MAD8–486 and MAD10–44 are not shown due to poor expression yields, which precluded testing at a 1 mg/mL concentration. Bars show median values and dashed lines show quartiles. p value was calculated using the Mann-Whitney U test. (G) Growth inhibition half maximal inhibitory concentration (IC50) values from titrations of the 35 most potent mAbs. Each point represents an independent experiment. Bars show the mean value. (H) Parasitemia in FRG HuHep mice challenged by infectious mosquito bite (carrying P. falciparum NF54 sporozoites) and administered 625 μg/mL of either MAD8–151 or a negative control mAb 1245 (Scally et al.30). The dashed line shows the limit of detection of parasite quantification by reverse-transcriptase quantitative PCR (RT-qPCR). Each symbol denotes an individual mouse. Bars show geometric mean values. One mouse in the control group was euthanized after day 11 due to poor health. Differences between mouse groups were analyzed by mixed-effect analysis with Šídák’s multiple comparisons test. ns, non-significant. p < 0.05, ∗∗p < 0.01, ∗∗∗p < 0.001, ∗∗∗∗p < 0.0001. See also Figure S1.
Figure S2
Figure S2
Detailed epitope binning analysis based on mAb competition profiles, related to Figure 3 (A) Hierarchical clustering of mAbs using the McQuitty method (Epitope software), based on SPR-based mAb competition. Epitope bins were derived from mAb clustering and competition profiles and are shown in different colors. Bins Ia–Vb were identified based on the hierarchical tree, with two mAbs in Ic clustered into a separate bin due to limited overlap with group Ia mAbs and extensive competition with group III mAbs (see Figure S2C, top left). Bin VI was identified based on competition with the anchor mAb R5.007, which targets the RH5 intrinsic loop. (B) Epitope bins of RH5-specific mAbs shown in a two-dimensional (2D) representation, clustered based on competition profiles. Solid lines indicate two-way competition, dashed lines indicate one-way competition. Circular nodes represent mAbs analyzed as both ligand and analyte; square nodes represent mAbs analyzed as ligand or analyte only. The layout.auto display (Epitope software) was used to generate this plot. (C) Heatmap showing competition of mAbs targeting RH5. Red squares signify competition between the corresponding analyte and ligand mAb, while cream squares indicate no competition. The colors at the side and top are those of the 13 individual bins. 13/22 infection-derived mAbs and 153/164 vaccine-derived mAbs were mappable in this assay; the remaining mAbs were incompatible with the workflow, e.g., due to acid sensitivity during the regeneration step.
Figure 3
Figure 3
mAbs from natural infection primarily target non-neutralizing RH5 epitopes (A) Heatmap showing competition of mAbs targeting RH5. Red squares signify competition between the corresponding analyte and ligand mAb, while cream squares indicate no competition. The colors at the edges are those of the combined bins I–VII (e.g., bin I is formed from Ia–Ic). 13/22 infection-derived mAbs and 153/164 vaccine-derived mAbs were mappable in this assay; the remaining mAbs were incompatible with the workflow, e.g., due to acid sensitivity. (B) Crystal structure of RH5 (yellow) bound to the scFv of R5.008 (brown), each shown in cartoon. R5.008 competes with the binding of basigin (transparent white surface, PDB: 4U0Q) to RH5. (C) Neutralizing and non-neutralizing antibodies target the top and bottom of RH5, respectively. Representative antibody structures for each bin (I = R5.004, PDB: 6RCU; II = R5.016, PDB: 6RCV; III = R5.008; IV = R5.011, PDB: 6RCV; V = R5.015, PDB: 7PHU) are shown in surface representation on RH5 in cartoon. R5.008 is modeled as a Fab fragment for illustrative purposes. The binding locations of basigin (PDB: 4U0Q) and CyRPA (PDB: 8CDD) are shown as transparent surfaces in the top and side views, respectively, and the black dot indicates the location of the internal disordered loop of RH5. The approximate locations of bin VI (based on binding to the intrinsic loop) and bin VII (based on partial overlap with bins II and V) are shown by arrows. (D) Growth inhibition of mAbs, subdivided by major epitope bin. Bars show mean values. Infection-derived mAbs are shown as diamonds. (E) Epitope bins of 35 most potent RH5-specific mAbs, as determined by GIA titration. (F) Frequency of infection- and vaccination-derived mAbs in each RH5 epitope bin. The dotted lines separate bins at the top and bottom of RH5. (G) mAbs scored by binding proximity to the top of RH5, based on binding to RH5 with bins I–III pre-blocked versus bins IV–VI pre-blocked. Data points are geometric means from two independent experiments. Points are color-coded by GIA score at 1 mg/mL. See also Figures S2–S4.
Figure S3
Figure S3
Discrete RH5 epitope communities correlate with antibody GIA score, related to Figure 3 (A) GIA-coded epitope bins of RH5-specific mAbs. Nodes are color-coded by GIA percentage at 1 mg/mL. Negative scores were set to zero. Reference mAbs and the antigen CyRPA, which were not analyzed by GIA, are colored gray. Solid lines indicate two-way competition, dashed lines indicate one-way competition. Circular nodes represent mAbs analyzed as both ligand and analyte; square nodes represent mAbs analyzed as ligand or analyte only. (B) SPR sensorgram showing binding of RH5 to bin IV mAb MAD8–323 on the chip surface, followed by binding of bin I, II, and III mAbs to the bound RH5. (C–E) Representative FACS plots from a multiplex bead-based assay to determine epitope localization of RH5-specific mAbs. Bead populations 1–3 display RH5 that was pre-blocked at top epitopes, bottom epitopes, or both. Bead population 4 displays unblocked RH5. Bead population 5 was not coated with RH5. Fluorescently labeled anti-IgG secondary antibody was used to determine the level of binding of each mAb. Results from a representative top-binding mAb (C), bottom-binding mAb (D), and no mAb negative control (E) are shown.
Figure S4
Figure S4
RH5-specific mAbs do not show Fc effector function in a phagocytosis- and complement-based assay, related to Figure 3 (A) Percentage of THP-1 monocyte cells with intracellular merozoites after opsonization of merozoites with various anti-RH5 mAbs. The anti-MSP1 mAb 42D6 (Patel et al.62) was used as a positive control. (B) Growth inhibition of 3D7 parasites with anti-RH5 mAbs in the presence of serum that was either non-heat inactivated or heat inactivated to eliminate complement activity. MAD8–502 and MAD8–151 were tested at 50 μg/mL, while the other 4 mAbs were tested at 200 μg/mL.
Figure 4
Figure 4
Binding strength of mAbs targeting bins I and II of RH5 is strongly correlated with neutralization potency (A) Spearman correlation between growth inhibition (% at 1 mg/mL) and several binding and sequence parameters for mAbs from bins I and II. The size of the circles and color intensity are proportional to the correlation r value. KD, equilibrium dissociation constant; Ka, association rate constant; Kd, dissociation rate constant. KD and Kd were inverted to allow a direct comparison of positive correlations. Only mAbs from major bins I and II that had measurable values for all 6 parameters were included in this analysis. (B) Correlation between growth inhibition and RH5 binding based on AUC for mAbs, subdivided by bin. p and r values were derived from Spearman correlation. Bands show 95% confidence intervals. All mAbs from epitope bins (I–V) with measurable AUC values were considered in this analysis. Bins VI and VII were not included due to the few mAbs (≤5) in each bin.
Figure 5
Figure 5
Potent RH5-specific mAbs use diverse VH genes and are clonally dispersed VH gene usage of mAbs derived from infection and vaccination. Numbers in the bottom panel represent the number of mAbs binding to the top or bottom of RH5 based on the bead competition assay. Bin VII middle binders, along with mAbs that could not be mapped, were classified as ND. MAD10–44 and MAD8–486 were excluded from the GIA plot as their expression levels were insufficient for testing at 1 mg/mL. See also Figure S5.
Figure S5
Figure S5
Genetic and structural features of RH5-specific antibodies from infection and vaccination, related to Figures 5 and 6 (A) Heavy (x axis) and light (y axis) chain V gene usage of RH5-specific mAbs from natural infection. The diameters of the circles are proportional to the number of mAbs using the corresponding heavy and light chain pair. The five mAbs using IGHV3-21/IGLV1-47 are clonally related, while the two mAbs using IGHV3-21/IGLV3-21 are not related and were isolated from different donors. (B) Genetic, binding, and functional features of MAD8–502 in comparison with MAD10–466, and MAD8–151 in comparison with MAD10–255. (C) Structural alignments of MAD8–502 scFv (dark blue) and R5.004 Fab (blue, PDB: 6RCU) bound to RH5 (yellow), showing that MAD8-502 belongs to epitope bin I. Complexes are shown as side and top views. (D) Structural alignments of MAD8–151 scFv (dark red) and R5.016 Fab (red, PDB: 6RCV) or 9AD4 Fab (pink, PDB: 4U0R) bound to RH5 (yellow), showing that MAD8-151 belongs to epitope bin II and shares an angle of approach to RH5 more similar to 9AD4 than R5.016. (E) Top and side views of the crystal structure of MAD10–466 Fab fragment (light blue) bound to RH5 (yellow). (F) Top and side views of the crystal structure of MAD10–255 scFv (red) bound to RH5 (yellow).
Figure 6
Figure 6
Crystal structures of naturally acquired RH5-targeting mAbs and vaccination-derived counterparts (A) Structure of MAD8–502 scFv (dark blue) bound to RH5 (yellow) from several views, shown in cartoon representation. (B) Structure of MAD8–151 scFv (dark red) bound to RH5 (yellow), as in (A). (C) Overlay of naturally acquired MAD8–502 (dark blue) and vaccine-derived MAD10–466 (light blue) bound to RH5 (yellow) illustrating similar binding modes. Only the variable domain of the MAD10–466 Fab fragment is shown for simplification. Shared intermolecular contacts made by CDRs H1 and H2 of each mAb are shown in the expanded panel inset, with residues shown as sticks and hydrogen bonds with dashed lines. (D) Comparison of the binding interfaces between MAD8–502 and MAD10–466 to RH5 demonstrating shared use of CDRs H1 and H2 to interact with RH5 but variable use of CDRs H3, L1, L2, and L3. (E) Overlay of doppelgangers MAD8–151 scFv (naturally acquired, dark red) and MAD10–255 (vaccination-derived, red) bound to RH5 (yellow). (F) View of the almost identical binding interface between MAD8–151 and MAD10–255 with RH5. Residues taking part in the binding interface are labeled and shown as sticks, while hydrogen bonds are shown as dashed lines. In the MAD8–151 panel, RH5 residues are numbered as in wild-type RH5 to allow for comparison with MAD10–255, while the deposited structure uses numbering of the RH5ΔNL construct (Table S2). See also Figure S5 and Tables S1 and S2.

Similar articles

Cited by

References

    1. World Health Organization . 2023. World malaria report 2023.
    1. Kayentao K., Ongoiba A., Preston A.C., Healy S.A., Doumbo S., Doumtabe D., Traore A., Traore H., Djiguiba A., Li S., et al. Safety and efficacy of a monoclonal antibody against malaria in Mali. N. Engl. J. Med. 2022;387:1833–1842. doi: 10.1056/NEJMoa2206966. - DOI - PMC - PubMed
    1. Wu R.L., Idris A.H., Berkowitz N.M., Happe M., Gaudinski M.R., Buettner C., Strom L., Awan S.F., Holman L.A., Mendoza F., et al. Low-dose subcutaneous or intravenous monoclonal antibody to prevent malaria. N. Engl. J. Med. 2022;387:397–407. doi: 10.1056/NEJMoa2203067. - DOI - PMC - PubMed
    1. Datoo M.S., Natama H.M., Somé A., Bellamy D., Traoré O., Rouamba T., Tahita M.C., Ido N.F.A., Yameogo P., Valia D., et al. Efficacy and immunogenicity of R21/Matrix-M vaccine against clinical malaria after 2 years' follow-up in children in Burkina Faso: a phase 1/2b randomised controlled trial. Lancet Infect. Dis. 2022;22:1728–1736. doi: 10.1016/S1473-3099(22)00442-X. - DOI - PubMed
    1. Mwakingwe-Omari A., Healy S.A., Lane J., Cook D.M., Kalhori S., Wyatt C., Kolluri A., Marte-Salcedo O., Imeru A., Nason M., et al. Two chemoattenuated PfSPZ malaria vaccines induce sterile hepatic immunity. Nature. 2021;595:289–294. doi: 10.1038/s41586-021-03684-z. - DOI - PMC - PubMed

MeSH terms