. 2024 Aug 20;5(8):101660.
doi: 10.1016/j.xcrm.2024.101660. Epub 2024 Jul 25.

Longitudinal integrative cell-free DNA analysis in gestational diabetes mellitus

Affiliations

Longitudinal integrative cell-free DNA analysis in gestational diabetes mellitus

Zhuangyuan Tang et al. Cell Rep Med. .

Abstract

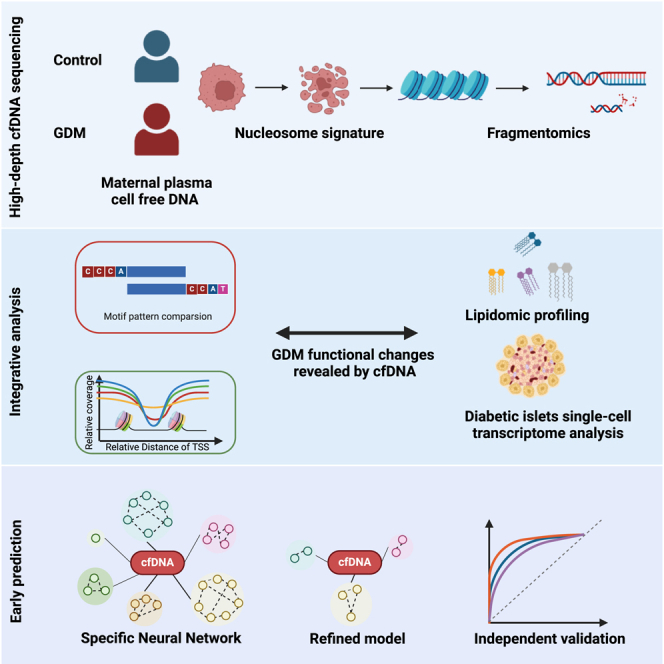
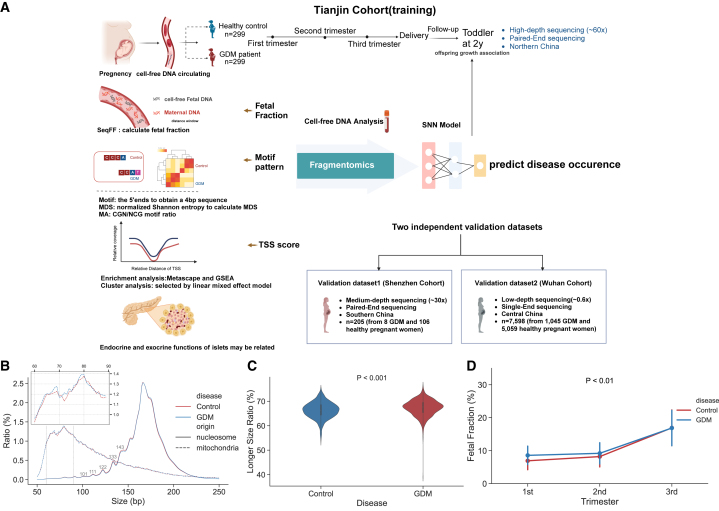
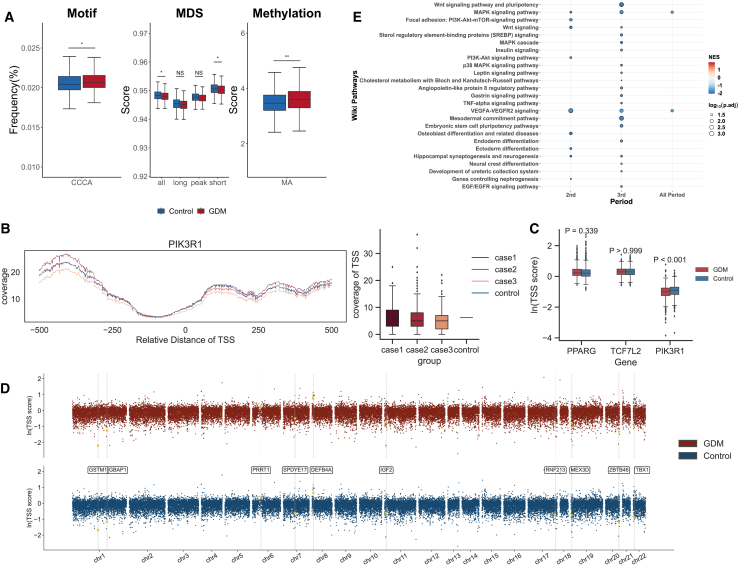
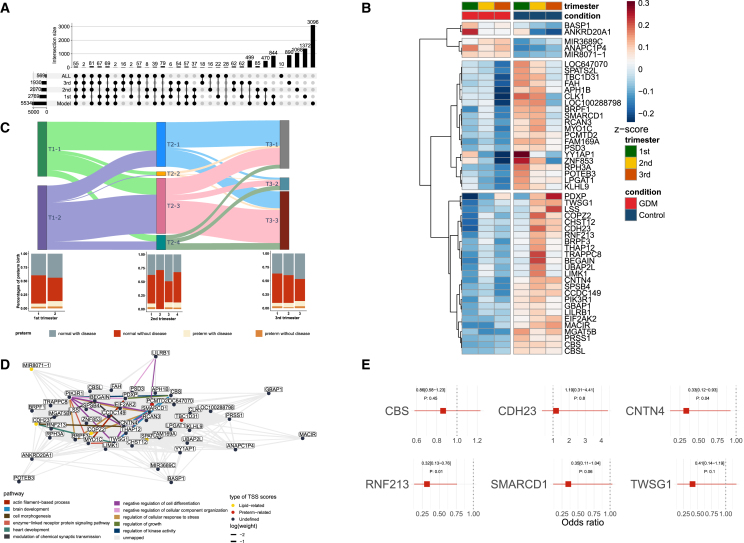
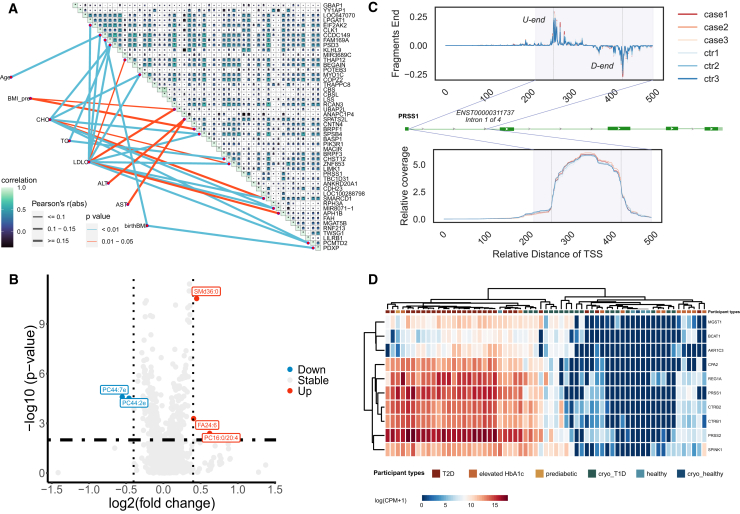
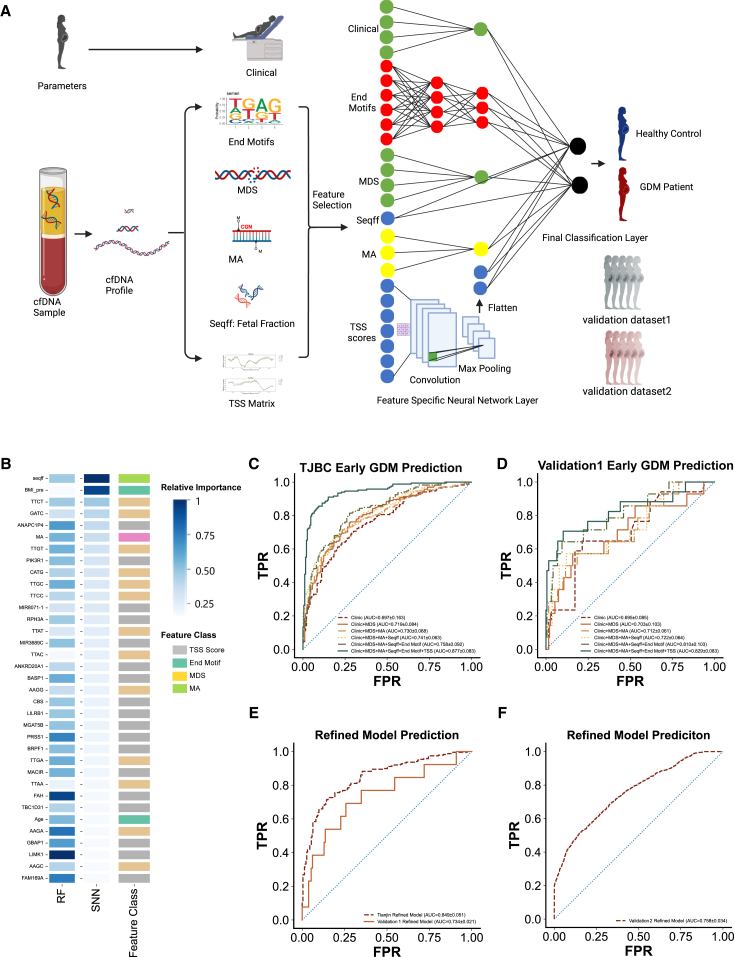
Gestational diabetes mellitus (GDM) presents varied manifestations throughout pregnancy and poses a complex clinical challenge. High-depth cell-free DNA (cfDNA) sequencing analysis holds promise in advancing our understanding of GDM pathogenesis and prediction. In 299 women with GDM and 299 matched healthy pregnant women, distinct cfDNA fragment characteristics associated with GDM are identified throughout pregnancy. Integrating cfDNA profiles with lipidomic and single-cell transcriptomic data elucidates functional changes linked to altered lipid metabolism processes in GDM. Transcription start site (TSS) scores in 50 feature genes are used as the cfDNA signature to distinguish GDM cases from controls effectively. Notably, differential coverage of the islet acinar marker gene PRSS1 emerges as a valuable biomarker for GDM. A specialized neural network model is developed, predicting GDM occurrence and validated across two independent cohorts. This research underscores the high-depth cfDNA early prediction and characterization of GDM, offering insights into its molecular underpinnings and potential clinical applications.

Keywords: PRSS1; cell-free DNA; gestational diabetes mellitus; pregnancy dynamics.


Conflict of interest statement

Declaration of interests The authors declare no competing interests.

Figures

None
Graphical abstract
Figure 1
Figure 1
High-depth cfDNA sequencing captures fragmentation changes in GDM patient plasma vs. control plasma samples (A) Study design showing how samples were collected and analyzed (created with BioRender.com). (B) Size profile distributions varied across different groups; solid and dashed lines represent nucleosome-derived and mitochondria-derived cfDNA fragments, respectively. (C) Longer cfDNA fragment ratios across GDM patient and control plasma samples. A longer size ratio was defined as the proportion of the number of reads from 160 to 300 bp (p < 0.001, Wilcoxon rank-sum test). (D) Longitudinal variations between GDM and controls. The fetal fraction differed significantly between GDM and controls (p < 0.01, LMM). The mean is represented by the central point and the error bars indicate the standard deviation from the mean.
Figure 2
Figure 2
CfDNA physical property differences between GDM and controls (A) Comparing cfDNA physical properties between GDM and controls. Signatures differed in motif frequency (CCCA = representative sequence), MDS (four subgroup sizes, (1) all: all fragments, (2) short: ≤150 bp, (3) peak: 160–170 bp, and (4) long: ≥250 bp), and MA (methylation-associated value). The center line in the boxplot represents the median, and lower, upper whiskers, and outliers correspond to the 1.5× interquartile range and outliers outside that range, respectively. p values for disease effects were calculated from the LMM. (B) Left: relative PIK3R1 coverage revealed differences between GDM and controls across different trimesters. Right: TSS PIK3R1 coverage revealed differences between GDM and controls across different trimesters (case1, case2, and case3 represent 1st, 2nd, and 3rd trimester of GDM, respectively.). (C) TSS scores after a log transformation calculated for previously identified GDM-associated genes. Wilcoxon rank-sum tests were used to calculate p values. (D) TSS scores at various locations on multiple chromosomes. The x axis represents chromosome locations, while the y axis represents mean TSS scores after a log transformation was applied. Yellow dots on the graph indicate the 10 most significant TSS score differences between GDM and controls. (E) Top enriched gene set enrichment analysis terms in Wikipathways. Colors represent normalized enrichment scores and point size represents log10(p adj) values.
Figure 3
Figure 3
CfDNA signatures between GDM and controls (A) Upset diagram shows selected TSS score signatures. (B) Heatmap shows TSS score signatures. Differential TSS scores separate GDM and control samples despite dynamic changes in trimesters. Four clusters show different temporal patterns. (C) Sankey diagram shows temporal cluster changes. Rectangle width corresponds to sample numbers in each trimester, and connections between rectangles represent subject flow between trimesters (T referred to trimester). The three bar charts below show preterm birth percentages in each trimester. (D) A correlation network of 50 TSS scores. Line color represents pathways and line size represents log(weight) values. (E) The odds ratios of six growth and development-related TSS scores. Data are presented as odds ratios with 95% confidence intervals.
Figure 4
Figure 4
Lipid profile associations (A) TSS score associations with different laboratory measurements. The upper section of the plot shows Pearson correlation analysis on multiple TSS scores. Line segment thickness corresponds to the magnitude of Pearson correlation coefficients, indicating relationship strength. Line color represents p values, which show statistical significance in observed correlations (Age, age of mother pregnancy; BMI_pre, BMI of the mother before pregnancy; CHO, plasma total cholesterol; TG, plasma triglycerides; LDLC, low-density lipoprotein cholesterol; ALT, alanine aminotransferase; AST, aspartate aminotransferase; birthBMI, BMI of the child at birth). (B) Lipid differences between women with GDM and controls. |log2(FC)| < 0.4 and −log10(p value) > 2 threshold values are applied. Blue and red dots represent significantly down-regulated and up-regulated lipids in GDM, respectively. Wilcoxon rank-sum tests were used to calculate p values. (C) Up: the fragment end counts and PRSS1’s TSS downstream 500 bp. Middle: a schematic showing the PRSS1 gene structure. Down: the coverage of the corresponding region. The gray-purple area represents introns 1–4 in ENST00000311737. Gray dotted lines indicate the positions of two end peaks situated in the intronic region (case1, case2, and case3 represent 1st, 2nd, and 3rd trimester of GDM, respectively. ctr1, ctr2, and ctr3 represent 1st, 2nd, and 3rd trimester of control, respectively). (D) Heatmap shows PRSS1 and other acinar-specific gene expression levels in different women from single-cell data from Camunas-Soler et al.
Figure 5
Figure 5
Neural network model (A) SNN structure (created with BioRender.com). (B) Feature importance plot showing different machine learning algorithms. The dark blue feature represents more importance when compared with the light blue, indicating boost in AUC when adding the feature. Right color bar signifies the feature class. (C and D) Classifier performance as quantified by a receiver operator characteristic curve to predict GDM using early gestation samples from TJBC (C) and validation dataset1 (D). The numerical values in parentheses denote the mean AUC value accompanied by its 95% confidence interval. (E and F) Performance of the refined model predicting GDM in TJBC, validation dataset1 (E), and validation dataset2 (F).

Similar articles

References

    1. Federation I. tenth Edition. International Diabetes; 2021. IDF Diabetes Atlas.
    1. Moon J.H., Jang H.C. Gestational Diabetes Mellitus: Diagnostic Approaches and Maternal-Offspring Complications. Diabetes Metab. J. 2022;46:3–14. doi: 10.4093/dmj.2021.0335. - DOI - PMC - PubMed
    1. Alejandro E.U., Mamerto T.P., Chung G., Villavieja A., Gaus N.L., Morgan E., Pineda-Cortel M.R.B. Gestational Diabetes Mellitus: A Harbinger of the Vicious Cycle of Diabetes. Int. J. Mol. Sci. 2020;21 doi: 10.3390/ijms21145003. - DOI - PMC - PubMed
    1. Brand J.S., West J., Tuffnell D., Bird P.K., Wright J., Tilling K., Lawlor D.A. Gestational diabetes and ultrasound-assessed fetal growth in South Asian and White European women: findings from a prospective pregnancy cohort. BMC Med. 2018;16:203. doi: 10.1186/s12916-018-1191-7. - DOI - PMC - PubMed
    1. Billionnet C., Mitanchez D., Weill A., Nizard J., Alla F., Hartemann A., Jacqueminet S. Gestational diabetes and adverse perinatal outcomes from 716,152 births in France in 2012. Diabetologia. 2017;60:636–644. doi: 10.1007/s00125-017-4206-6. - DOI - PMC - PubMed

LinkOut - more resources