. 2024 Aug 20;5(8):101661.
doi: 10.1016/j.xcrm.2024.101661. Epub 2024 Jul 25.

Discovery and validation of a 10-gene predictive signature for response to adjuvant chemotherapy in stage II and III colon cancer

Affiliations

Discovery and validation of a 10-gene predictive signature for response to adjuvant chemotherapy in stage II and III colon cancer

Chaohan Xu et al. Cell Rep Med. .

Abstract

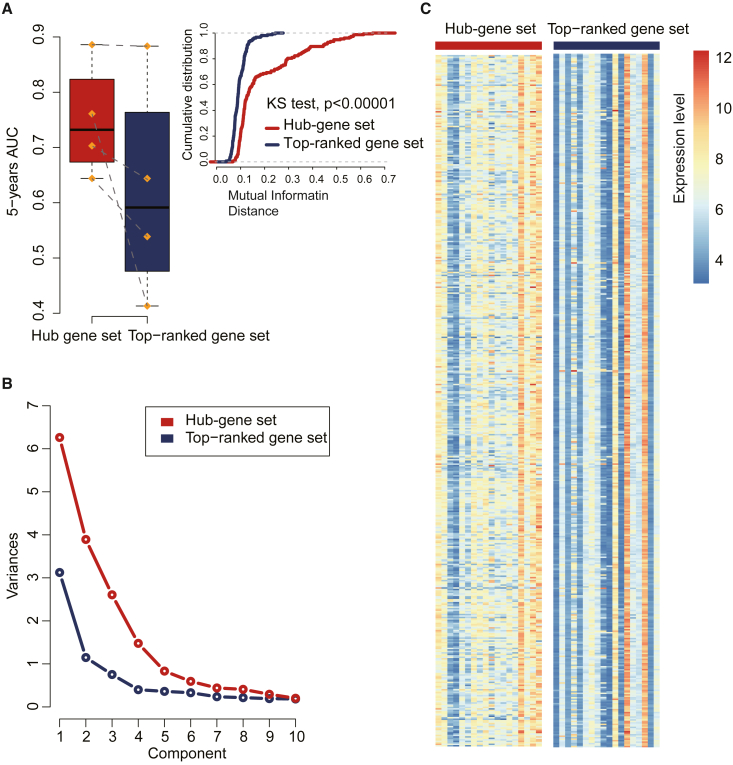
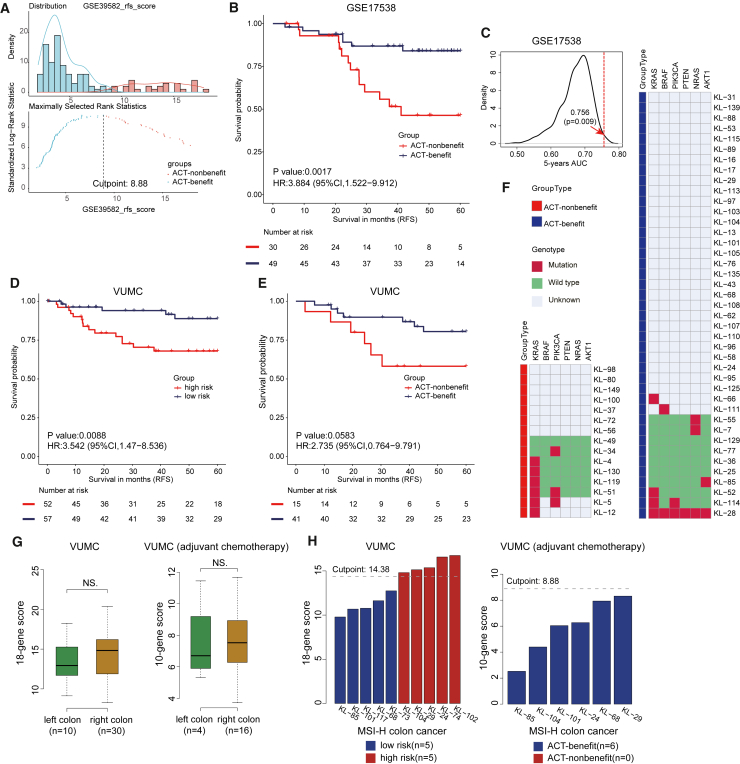
Identifying patients with stage II and III colon cancer who will benefit from 5-fluorouracil (5-FU)-based adjuvant chemotherapy is crucial for the advancement of personalized cancer therapy. We employ a semi-supervised machine learning approach to analyze a large dataset with 933 stage II and III colon cancer samples. Our analysis leverages gene regulatory networks to discover an 18-gene prognostic signature and to explore a 10-gene signature that potentially predicts chemotherapy benefits. The 10-gene signature demonstrates strong prognostic power and shows promising potential to predict chemotherapy benefits. We establish a robust clinical assay on the NanoString nCounter platform, validated in a retrospective formalin-fixed paraffin-embedded (FFPE) cohort, which represents an important step toward clinical application. Our study lays the groundwork for improving adjuvant chemotherapy and potentially expanding into immunotherapy decision-making in colon cancer. Future prospective studies are needed to validate and establish the clinical utility of the 10-gene signature in clinical settings.

Keywords: adjuvant therapy; biomarkers; chemotherapy; colon cancer; gene expression; immune checkpoint blockade; machine learning; prediction; prognosis.


Conflict of interest statement

Declaration of interests The authors declare no competing interests.

Figures

None
Graphical abstract
Figure 1
Figure 1
The workflow chart Schematic of the study design for (A) the development and validation of the 18-hub-gene prognosis signature; and (B) the development and validation of the 10-gene chemotherapy-benefit signature.
Figure 2
Figure 2
Identification of the 18-hub-gene signature and validation of the Random Survival Forests (RSF) prognosis model (A) The topology of the constructed survival-related gene network in colon cancer. A total of 504 genes (nodes) with at least 11 connections with other genes were identified as hub genes and labeled in enlarging. (B) Composition of the 18 survival-associated hub genes. Degree refers to the number of genes that the hub gene has a direct connection with based on the constructed gene network in Figure A. GISTIC (http://portals.broadinstitute.org/tcga/home) records the information of somatic copy-number variation: “+” indicates the genes with significant amplification and “−” indicates significant deletion in CRC. MethHC (http://methhc.mbc.nctu.edu.tw/php/index.php) records the information on DNA methylation: “+” indicates the genes with significant hypermethylation and “−” indicates significant hypomethylation in CRC. DisGeNET (https://www.disgenet.org/home/) records the information on human gene-disease associations (GDAs): “+” indicates the genes related to CRC. The gene symbols of the ten genes with more than two pieces of evidence that occurred in CRC were highlighted in red. (C) Maximally selected log rank statistics were applied to the in-bag predicted value of the RSF prognosis model. The optimal cutoff point was determined as 14.38. (D–G) Validation of the 18-hub-gene signature in 4 independent datasets, including GSE17538, GSE33113, GSE37892, and GSE38832. The high- and low-risk groups were defined based on the 18-hub-gene signature, which was derived from the GSE39582 cohort. The optimal cutoff point, which was determined by the maximally selected rank statistics (maxstat), was used to divide the patients into high- and low-risk groups. Red and dark blue lines indicate predicted high- and low-relapse risk groups. HR compares the RFS of the low- and high-relapse risk groups. p values were obtained by the log rank test.
Figure 3
Figure 3
Comparison of the 18-hub-gene set and 18-most-significant gene set (A) Boxplot of median AUC for predicting 5-year RFS in four GEO testing datasets (GSE17538, GSE33113, GSE37892, and GSE38832), and pairwise mutual information distance based on expression values in the GSE39582 dataset. (B) Expression variation across the samples in the GSE39582 dataset based on the principal component analysis. (C) Gene expression patterns of the two gene sets in the GSE39582 dataset.
Figure 4
Figure 4
Validation of the RSF chemotherapy-benefit model (A) Maximally selected log rank statistics were applied to the in-bag predicted value of the RSF chemotherapy-benefit model. The optimal cutoff point was determined as 8.88. (B) Validation of the 10-gene chemotherapy-benefit signature in another independent dataset, GSE17538, which contains only samples with 5-FU-based ACT. The ACT-benefit and non-benefit groups were defined based on the 10-gene chemotherapy-benefit signature, which was derived from samples with 5-FU-based ACT in the GSE39582 cohort. The optimal cutpoint, which was determined by the maximally selected rank statistics (maxstat), was used to divide the patients into the ACT-benefit and non-benefit groups. Dark blue and red lines indicate predicted ACT-benefit and non-benefit groups. HR compares the RFS of the ACT-benefit and non-benefit group. p values were obtained by the log rank test. (C) The density plot illustrated the AUC values of 1,000 randomly selected gene sets for predicting 5-year RFS. The red dotted line represents an AUC of 0.756 for the 10-gene set in predicting 5-year RFS. (D and E) The predictive performance evaluation of the prognosis model and chemotherapy-benefit model in the VUMC data. The 18-gene prognosis model divided high- and low-relapse risk groups in stage II to III patients in (D), and the 10-gene chemotherapy-benefit model divided ACT-responsive and non-responsive groups in stage II to III patients in (E). (F) The mutation pattern of KRAS, BRAF, PIK3CA, PTEN, NRAS, and AKT1 between VUMC ACT-benefit and non-benefit patients. (G) The boxplot of the 18-gene score and 10-gene score between the different locations of lesions in the VUMC cohort. (H) The bar plot of the 18-gene and 10-gene groupings according to the patients with MSI-H in the VUMC cohort.
Figure 5
Figure 5
The performance of the 10-gene chemotherapy-benefit signature set for predicting 5-FU resistance for 60 cancer cell lines from the NCI-60 data (A) The heatmap plot of NCI-60 cell lines, which were clustered into 22 resistant and 38 sensitive groups based on the drug activity Z scores of the 10-gene chemotherapy-benefit signature. (B) The violin plot of −log10(GI 50) values between resistant and sensitive groups. Abbreviations are as follows: BR, breast; CNS, central nervous system; CO, colon; LC, non-small cell lung; LE, leukemia; ME, melanoma; OV, ovarian; PR, prostate; and RE, renal.
Figure 6
Figure 6
Association of the 10-gene chemotherapy-benefit signature with TIDE score The Pearson correlation between the TIDE score and the 10-gene chemotherapy-benefit score in the merged four datasets (A), GSE17538 (B), GSE33113 (C), GSE37892 (D), and GSE38832 (E).

References

    1. Dekker E., Tanis P.J., Vleugels J.L.A., Kasi P.M., Wallace M.B. Colorectal cancer. Lancet. 2019;394:1467–1480. doi: 10.1016/S0140-6736(19)32319-0. - DOI - PubMed
    1. O'Connell J.B., Maggard M.A., Ko C.Y. Colon cancer survival rates with the new American Joint Committee on Cancer sixth edition staging. J. Natl. Cancer Inst. 2004;96:1420–1425. doi: 10.1093/jnci/djh275. - DOI - PubMed
    1. White A., Joseph D., Rim S.H., Johnson C.J., Coleman M.P., Allemani C. Colon cancer survival in the United States by race and stage (2001-2009): Findings from the CONCORD-2 study. Cancer. 2017;123:5014–5036. doi: 10.1002/cncr.31076. - DOI - PMC - PubMed
    1. Meyerhardt J.A., Shi Q., Fuchs C.S., Meyer J., Niedzwiecki D., Zemla T., Kumthekar P., Guthrie K.A., Couture F., Kuebler P., et al. Effect of Celecoxib vs Placebo Added to Standard Adjuvant Therapy on Disease-Free Survival Among Patients With Stage III Colon Cancer: The CALGB/SWOG 80702 (Alliance) Randomized Clinical Trial. JAMA. 2021;325:1277–1286. doi: 10.1001/jama.2021.2454. - DOI - PMC - PubMed
    1. Iveson T.J., Sobrero A.F., Yoshino T., Souglakos I., Ou F.S., Meyers J.P., Shi Q., Grothey A., Saunders M.P., Labianca R., et al. Duration of Adjuvant Doublet Chemotherapy (3 or 6 months) in Patients With High-Risk Stage II Colorectal Cancer. J. Clin. Oncol. 2021;39:631–641. doi: 10.1200/JCO.20.01330. - DOI - PMC - PubMed

Publication types

LinkOut - more resources