. 2024 Jul 26;7(10):e202402736.
doi: 10.26508/lsa.202402736. Print 2024 Oct.

Gene expression and chromatin conformation of microglia in virally suppressed people with HIV

Affiliations

Gene expression and chromatin conformation of microglia in virally suppressed people with HIV

Johannes Cm Schlachetzki et al. Life Sci Alliance. .

Erratum in

Abstract

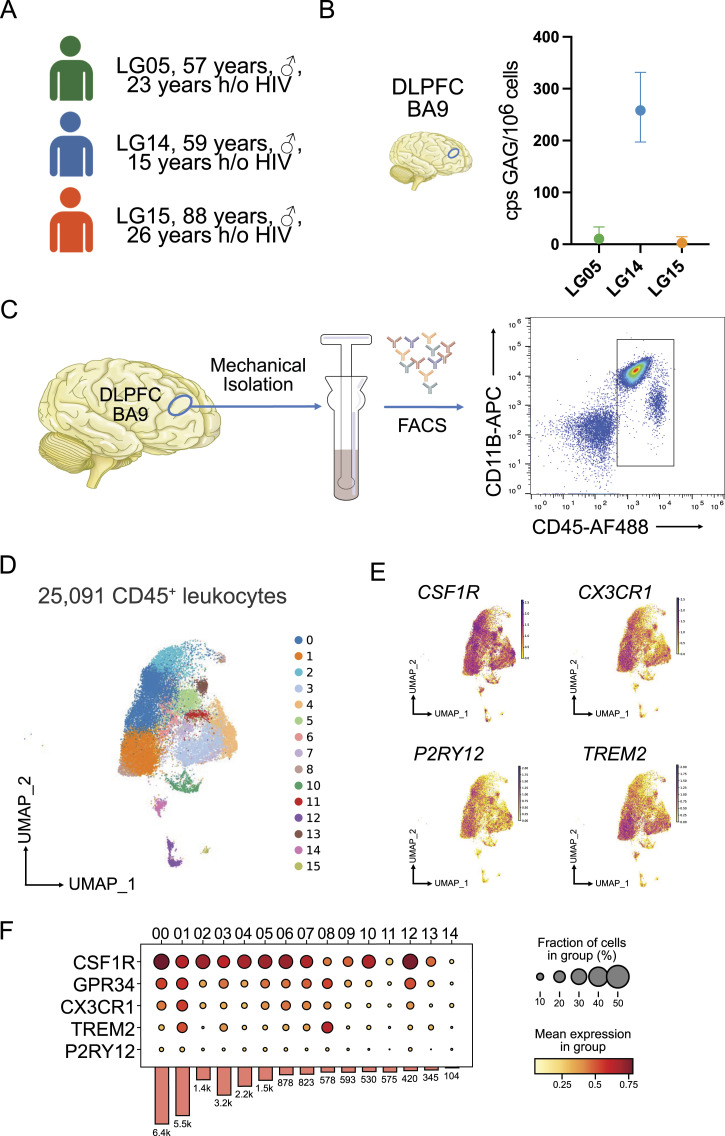
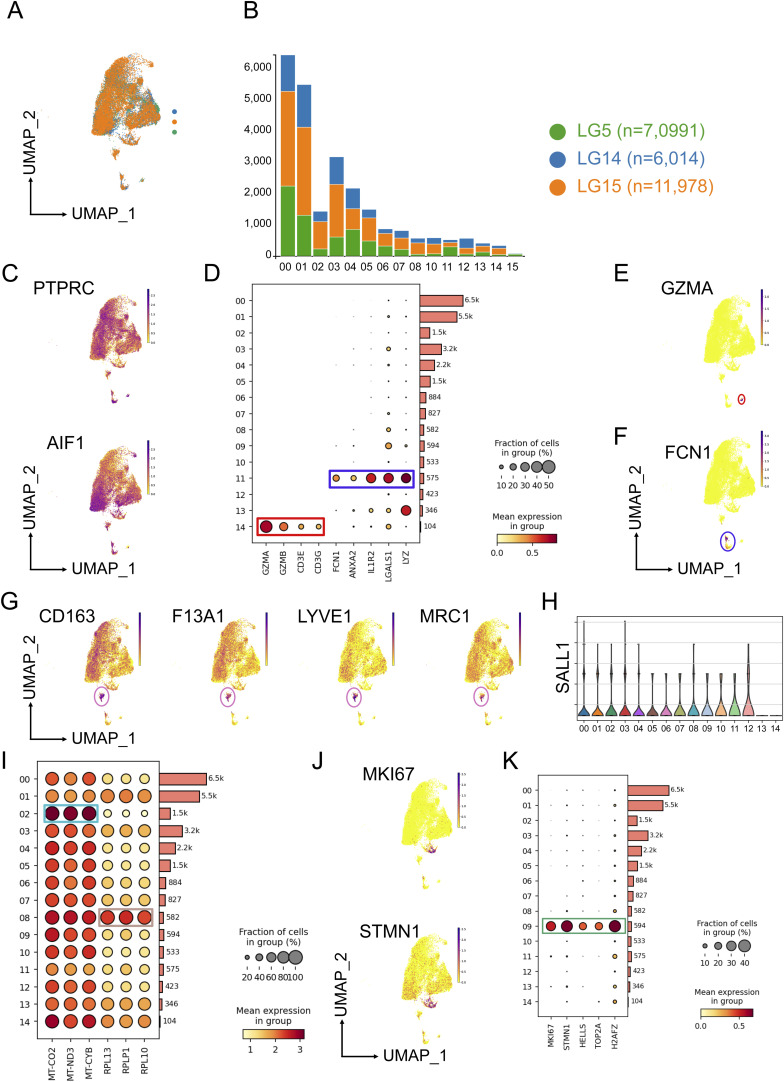
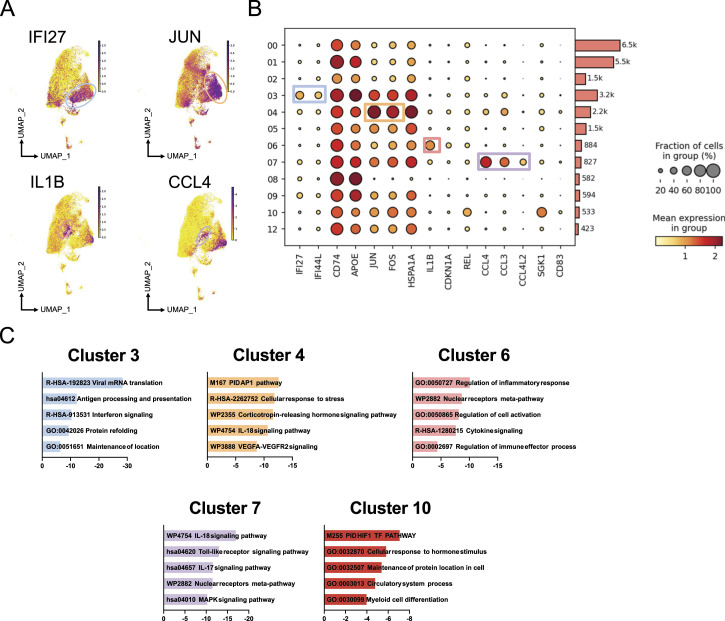
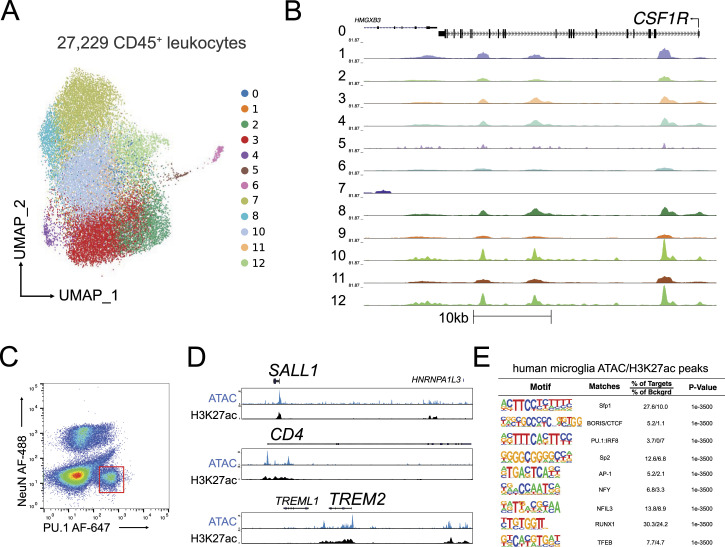
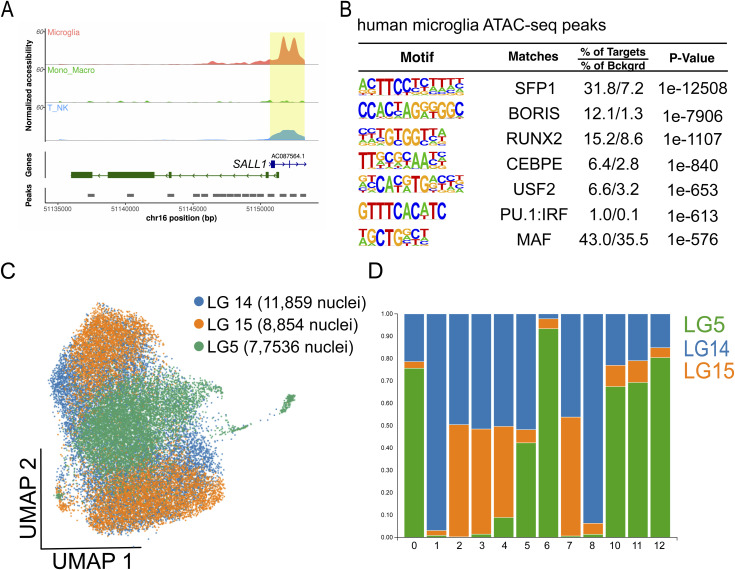
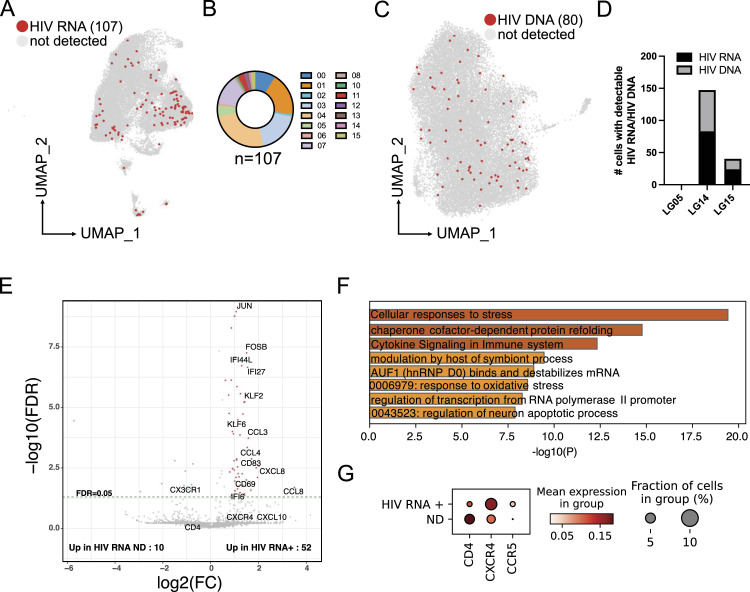
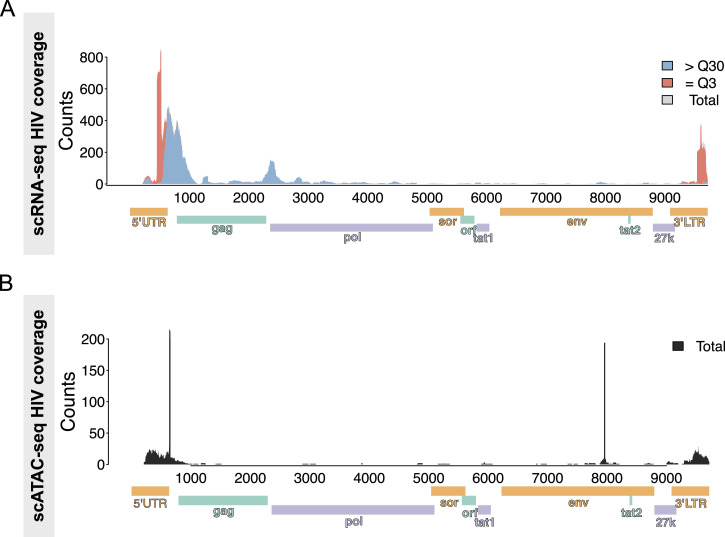
The presence of HIV in sequestered reservoirs is a central impediment to a functional cure, allowing HIV to persist despite life-long antiretroviral therapy (ART), and driving a variety of comorbid conditions. Our understanding of the latent HIV reservoir in the central nervous system is incomplete, because of difficulties in accessing human central nervous system tissues. Microglia contribute to HIV reservoirs, but the molecular phenotype of HIV-infected microglia is poorly understood. We leveraged the unique "Last Gift" rapid autopsy program, in which people with HIV are closely followed until days or even hours before death. Microglial populations were heterogeneous regarding their gene expression profiles but showed similar chromatin accessibility landscapes. Despite ART, we detected occasional microglia containing cell-associated HIV RNA and HIV DNA integrated into open regions of the host's genome (∼0.005%). Microglia with detectable HIV RNA showed an inflammatory phenotype. These results demonstrate a distinct myeloid cell reservoir in the brains of people with HIV despite suppressive ART. Strategies for curing HIV and neurocognitive impairment will need to consider the myeloid compartment to be successful.


Conflict of interest statement

The authors declare that they have no conflict of interest.

Figures

Figure 1.
Figure 1.. Experimental design and single-cell transcriptomics of CD45+ cells isolated from the cortex of individuals with HIV under antiretroviral therapy.
(A) Clinical cohort. (B) Measured GAG copies per million cells from three replicates with the dorsolateral prefrontal cortex using droplet digital PCR. (C) Diagrammatic representation of the experimental design. The dorsolateral prefrontal cortex tissue was homogenized followed by gentle mechanical dissociation. After antibody staining, CD45+ cells were sorted and processed for downstream applications. (D) Uniform Manifold Approximation and Projection for Dimension Reduction of 25,091 profiled CD45+ cells isolated from three male Last Gift study participants that passed quality selection criteria. (E) Feature plots showing the expression of microglial genes CX3CR1, P2RY12, CSF1R, and TREM2. (F) Stacked violin plot of homeostatic microglial genes. The color scale depicts the mean expression level. Source data are available for this figure.
Figure S1.
Figure S1.. Gating strategy for isolation of CD45+ cells from the cortex.
Sorting of CD45+ cells obtained from the dorsolateral prefrontal cortex Last Gift participants LG05, LG14, and LG15. Duplets were excluded, and CD45+ live cells were identified as DAPI-negative.
Figure S2.
Figure S2.. Single-cell RNA-seq of CD45+ cells.
(A) Uniform Manifold Approximation and Projection plot of 25,091 CD45+ cells depicting the proportion of sequenced cells for LG5, LG14, and LG15. (B) Stacked bar plot showing the number of CD45+ cells per Last Gift participant related to clusters. (C) Feature plots showing the expression of PTPRC encoding CD45 and AIF1 encoding IBA1. (D) Dot plot highlighting marker genes for lymphocytes (Cluster 14) and peripheral myeloid cells (Cluster 11). The size of the circles shows the fraction of cells expressing the genes, and the color scale provides the mean expression level per group. (E, F) Feature plots showing the expression of GZMA and FCN1 for clusters 14 and 11, respectively. (G) Feature plots depicting marker genes (CD163, F13A1, LYVE1, and MRC1) for perivascular macrophages. (H) Violin showing the gene expression of SALL1 with no detectable expression of SALL1 in the perivascular macrophage Cluster 13. (I) Dot plot showing the expression of mitochondrial genes. (J, K) Feature plots depicting marker genes of Cluster 09 (MKI67, STMN1) and dot plots of genes associated with proliferation.
Figure 2.
Figure 2.. Microglial phenotypes based on gene expression in the cortex of individuals with HIV under antiretroviral therapy.
(A) Feature plots highlighting the expression of IFI27 (Cluster 3), JUN (Cluster 4), IL1B (Cluster 6), and CCL4 (Cluster 7). (B) Dot plot depicting marker genes for each cluster. The size of the circles shows the fraction of cells expressing the genes, and the color scale provides the mean expression level per group. (C) Gene ontology enrichment analysis of marker genes for clusters 3, 4, 6, 7, and 11 using Metascape. Source data are available for this figure.
Figure 3.
Figure 3.. Chromatin accessibility landscape of microglia isolated from the cortex of people with HIV under antiretroviral therapy identified by single-cell ATAC-seq.
(A) Uniform Manifold Approximation and Projection for Dimension Reduction of 27,229 CD45+ cells isolated from three male Last Gift study participants that passed quality selection criteria. (B) Genome browser track of all clusters at the CSF1R locus. (C) Sorting of PU.1+ nuclei from the frozen brain tissue using fluorescence-activated nuclear sorting. (D) Genome browser track of ATAC-seq and H3K27ac at the SALL1, CD4, and TREM2 loci. (E) De novo motif analysis of H3K27ac ChIP-seq peaks anchored in ATAC-seq peaks.
Figure S3.
Figure S3.. Single-cell ATAC-seq of CD45+ cells.
(A) Pseudobulk genome browser track at the SALL1 locus depicting the promoter region in yellow. (B) Enriched motifs of differential distal chromatin regions using the GC-matched genomic background in microglia. (C) Uniform Manifold Approximation and Projection plot of 27,229 CD45+ cells depicting the proportion of sequenced cells for LG5, LG14, and LG15. (D) Stacked bar plot showing the proportion of cells per Last Gift participant contributing to the identified clusters.
Figure 4.
Figure 4.. Differential gene expression of HIV-infected microglial cells.
(A) Uniform Manifold Approximation and Projection for Dimension Reduction presentation of the single-cell RNA-seq dataset highlights cells with detected HIV RNA. (B) Pie chart showing the number of cells with detectable HIV RNA per cluster. (C) Uniform Manifold Approximation and Projection of single-cell ATAC-seq depicting cells with detectable integrated HIV DNA into the host’s genome in regions of open chromatin. (D) Number of cells with detectable HIV RNA and HIV DNA per Last Gift participant. (E) Volcano plot showing differential gene expression between HIV RNA+ cells and random cells with no detectable HIV transcripts. (F) Gene ontology analysis of expression of genes up-regulated in microglia with detectable HIV RNA. (G) Dot plot depicting the fraction of cells expressing the genes and the mean expression level in cells with detectable (HIV RNA+) and non-detectable (ND) HIV RNA. Source data are available for this figure.
Figure 5.
Figure 5.. Alignment track of HIV transcripts across the annotated HXB2 consensus sequence.
(A, B) Integrative Genomics Viewer plots of (A) HIV RNA and (B) HIV DNA in chromatin accessible regions. Read coverage is displayed as a histogram in the top panel.

References

    1. Angelovich TA, Cochrane CR, Zhou J, Tumpach C, Byrnes SJ, Jamal Eddine J, Waring E, Busman-Sahay K, Deleage C, Jenkins TA, et al. (2023) Regional analysis of intact and defective HIV proviruses in the brain of viremic and virally suppressed people with HIV. Ann Neurol 94: 798–802. 10.1002/ana.26750 - DOI - PMC - PubMed
    1. Barclay RA, Schwab A, DeMarino C, Akpamagbo Y, Lepene B, Kassaye S, Iordanskiy S, Kashanchi F (2017) Exosomes from uninfected cells activate transcription of latent HIV-1. J Biol Chem 292: 14764. 10.1074/jbc.A117.793521 - DOI - PMC - PubMed
    1. Chaillon A, Gianella S, Dellicour S, Rawlings SA, Schlub TE, De Oliveira MF, Ignacio C, Porrachia M, Vrancken B, Smith DM (2020) HIV persists throughout deep tissues with repopulation from multiple anatomical sources. J Clin Invest 130: 1699–1712. 10.1172/JCI134815 - DOI - PMC - PubMed
    1. Churchill MJ, Gorry PR, Cowley D, Lal L, Sonza S, Purcell DF, Thompson KA, Gabuzda D, McArthur JC, Pardo CA, et al. (2006) Use of laser capture microdissection to detect integrated HIV-1 DNA in macrophages and astrocytes from autopsy brain tissues. J Neurovirol 12: 146–152. 10.1080/13550280600748946 - DOI - PubMed
    1. Clark IC, Mudvari P, Thaploo S, Smith S, Abu-Laban M, Hamouda M, Theberge M, Shah S, Ko SH, Perez L, et al. (2023) HIV silencing and cell survival signatures in infected t cell reservoirs. Nature 614: 318–325. 10.1038/s41586-022-05556-6 - DOI - PMC - PubMed

MeSH terms