. 2024 Jul 26;15(1):6307.
doi: 10.1038/s41467-024-50527-2.

Single cell transcriptomic profiling identifies tumor-acquired and therapy-resistant cell states in pediatric rhabdomyosarcoma

Affiliations

Single cell transcriptomic profiling identifies tumor-acquired and therapy-resistant cell states in pediatric rhabdomyosarcoma

Sara G Danielli et al. Nat Commun. .

Abstract

Rhabdomyosarcoma (RMS) is a pediatric tumor that resembles undifferentiated muscle cells; yet the extent to which cell state heterogeneity is shared with human development has not been described. Using single-cell/nucleus RNA sequencing from patient tumors, patient-derived xenografts, primary in vitro cultures, and cell lines, we identify four dominant muscle-lineage cell states: progenitor, proliferative, differentiated, and ground cells. We stratify these RMS cells/nuclei along the continuum of human muscle development and show that they share expression patterns with fetal/embryonal myogenic precursors rather than postnatal satellite cells. Fusion-negative RMS (FN-RMS) have a discrete stem cell hierarchy that recapitulates fetal muscle development and contain therapy-resistant FN-RMS progenitors that share transcriptomic similarity with bipotent skeletal mesenchymal cells. Fusion-positive RMS have tumor-acquired cells states, including a neuronal cell state, that are not found in myogenic development. This work identifies previously underappreciated cell state heterogeneity including unique treatment-resistant and tumor-acquired cell states that differ across RMS subtypes.


Conflict of interest statement

The authors declare no competing interests.

Figures
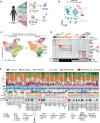
Fig. 1
Fig. 1. Integrated analysis of single cell and single nuclei sequencing identifies dominant cell states in human RMS.
A Schematic of approach and RMS models profiled by single-cell analysis, created with BioRender.com. B UMAP plot of tumor cells/nuclei (n = 72 datasets) colored by model of origin,,. C UMAP plot of integrated tumor cells/nuclei using reciprocal PCA (RPCA) projection. Cells/nuclei are colored by Louvain cluster (left) or assigned cell states (right). D Heatmap of the genes (x axis) enriched in Louvain clusters (y axis) across the integrated RMS dataset (FC > 0.25; n = 400 representative cells/nuclei shown with exception of cluster 11 that contained n = 101 cells/nuclei). The percentage of cycling cells within each cluster is shown in the bar plot below. E Summary of the cell state composition of each RMS dataset (n = 72) with clinical information included as an oncoplot below. FN-RMS, fusion-negative RMS; FP-RMS, fusion-positive RMS; PDC, PDX-derived primary culture; CL, cell line; PDX, patient-derived xenograft; snRNAseq, single-nuclei RNA sequencing; scRNAseq, single-cell RNA sequencing; NA, not available; TR-progenitor, transiting-progenitor; TR-differentiated, transiting-differentiated. Gene lists used for generating panels D and E are shown in Supplementary Data 2.
Fig. 2
Fig. 2. A tripartite cell state landscape of RMS tumors and identification of cell state RMS metaprograms.
A UMAP plots of integrated tumor cells/nuclei (n = 107,523 cells) scored for the metaprograms identified in the original publications. Number of genes within each metaprogram noted. B Comparison of published cell state metaprograms and those defined by our Louvain clustering approach. Top: Venn diagrams showing overlap of gene markers across the three original publications and our new analysis (“RMS atlas”). Bottom: UMAP plots of integrated tumor cells/nuclei (n = 107,523 cells) showing expression of the newly defined, high confidence cell state gene signatures. Number of genes within each metaprogram noted. Icons created with BioRender.com. C Pearson correlation coefficients for the metaprograms identified in the three original publications and the new metaprogram signatures defined by our work.
Fig. 3
Fig. 3. RMS cells lie in a continuum of gene expression defined by three dominant cell states including progenitor, proliferative, and differentiated cell states.
A Graphical analysis showing “muscle lineage score” defined as the difference between the differentiated and progenitor signature scores, and proliferation score of all RMS cells/nuclei. Subtypes are denoted by purple (FN-RMS) and blue (FP-RMS). B Average muscle lineage and proliferation scores calculated with pseudo-bulk data for each of the 72 RMS samples. C Violin plots showing individual cell expression of proliferative (left) and muscle lineage score (right) across FP-RMS (n = 40,526 cells/nuclei) and FN-RMS (n = 69,997 cells/nuclei) cells. Boxplots denote Tukey’s whiskers (25–75 percentile represented by minima-maxima; statistical median as center). Two-sided student’s t test with p values noted in the figure. D Violin plots showing cell expression of the muscle-lineage score across each of the 72 RMS samples. Boxplots denote Tukey’s whiskers (25–75 percentile represented by minima-maxima; statistical median as center). The UMAP plots of two representative samples for each subtype are shown, with n = 1500 cells/nuclei for each individual sample. The number of cells/nuclei analyzed for each sample are reported in Supplementary Data 1.
Fig. 4
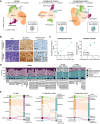
Fig. 4. Subtype analysis reveals shared RMS cell heterogeneity with human skeletal muscle development and tumor-derived cells states.
A UMAP plots of FN-RMS, PAX7::FOXO1, and PAX3::FOXO1 FP-RMS. Cells/nuclei were integrated independently and colored based on cell state. The number of samples having ≥1% neuronal cells are shown in the pie charts at the bottom right of each graph. B Immunohistochemistry staining of O-PDX samples stained for myogenin (MYOG, marker of the muscle differentiated subpopulation) and synaptophysin (SYP, marker of the neuronal subpopulation). Staining is representative of n = 4 tested samples for myogenin and n = 5 tested samples for synaptophysin. C Correlation between the proportion of neuronal or differentiated cells identified by sc/snRNA-seq and immunohistochemistry for synaptophysin and myogenin, respectively (n = 5 or n = 4 FP-RMS PDXs, respectively). The coefficients of determination (R2) and P values of the linear regressions are shown. Source data are provided as a Source Data file. D Comparison of RMS cell state heterogeneity with cell types found in human skeletal muscle development as defined by Xi et al. 2020. Cell types from human skeletal muscle development were projected onto RMS cells using an unbiased cell-type prediction analysis. E Sankey plots showing the proportion of tumor cells classified according to their most similar human developmental equivalent from Xi et al. 2020 based on unbiased cell-type prediction analysis.
Fig. 5
Fig. 5. Identification of therapy-resistant RMS metaprograms and cells states in RMS.
Metaprogram scores assigned across all cells/nuclei derived from a matched patient sample collected before (SJRHB000026_R2) and during (SJRHB000026_R3) treatment (A) or from PDXs derived from those patient samples (B). Boxplots denote Tukey’s whiskers (25–75 percentile represented by minima-maxima; statistical median as center). Two-sided student’s t test with p values noted in the figure. C Paired samples obtained from patients who underwent a pre-treatment biopsy and a delayed resection amidst therapy were processed using bulk RNA-sequencing. Created with BioRender.com. D Violin plots showing metaprogram scores calculated using the RMS-atlas signature gene sets for 7 matched pairs of FN-RMS samples. Two-sided student’s t test with p values noted in the figure. E Longitudinal biopsies from mice bearing a FP-RMS orthotopic PDX, SJRHB013759_X14, which were treated with vehicle or vincristine+irinotecan (VCR + IRN). Five longitudinal samples were obtained from each mouse, and samples underwent bulk RNA-sequencing. Created with BioRender.com. F Metaprogram scores of control treated mouse or those treated with VCR + IRN. Scores were calculated using signature gene sets from PAX3::FOXO1 FP-RMS (Supplementary Data 5). Source data are provided as a Source Data file.
Fig. 6
Fig. 6. Graphical summary.
Proposed model of persister cells during treatment that contribute to relapse in FN-RMS (top) and FP-RMS (bottom). Asterisks denote tumor acquired cells states. Image created with BioRender.com.

References

    1. Kashi, V. P., Hatley, M. E. & Galindo, R. L. Probing for a deeper understanding of rhabdomyosarcoma: insights from complementary model systems. Nat. Rev. Cancer15, 426–439 (2015). 10.1038/nrc3961 - DOI - PMC - PubMed
    1. Skapek, S. X. et al. Rhabdomyosarcoma. Nat. Rev. Dis. Primers5, 1 (2019). 10.1038/s41572-018-0051-2 - DOI - PMC - PubMed
    1. Dasgupta, R., Fuchs, J. & Rodeberg, D. Rhabdomyosarcoma. Semin. Pediatr. Surg.25, 276–283 (2016). 10.1053/j.sempedsurg.2016.09.011 - DOI - PubMed
    1. Davicioni, E. et al. Identification of a PAX-FKHR gene expression signature that defines molecular classes and determines the prognosis of alveolar rhabdomyosarcomas. Cancer Res.66, 6936–6946 (2006). 10.1158/0008-5472.CAN-05-4578 - DOI - PubMed
    1. Davicioni, E. et al. Molecular classification of rhabdomyosarcoma-genotypic and phenotypic determinants of diagnosis: a report from the Children’s Oncology Group. Am. J. Pathol.174, 550–564 (2009). 10.2353/ajpath.2009.080631 - DOI - PMC - PubMed