. 2024 Jul 26;15(1):6295.
doi: 10.1038/s41467-024-50546-z.

Functional architecture of intracellular oscillations in hippocampal dendrites

Affiliations

Functional architecture of intracellular oscillations in hippocampal dendrites

Zhenrui Liao et al. Nat Commun. .

Abstract

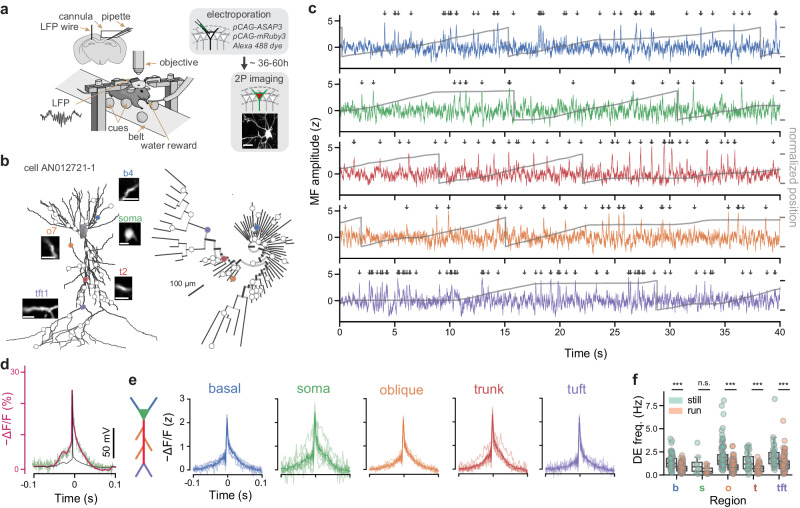
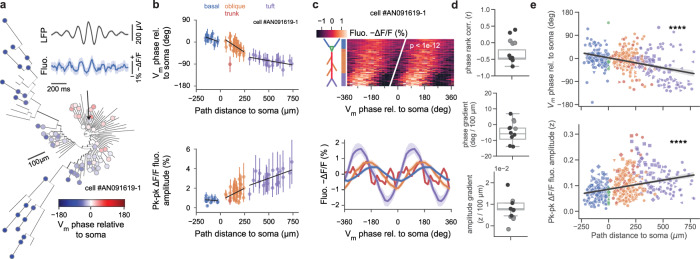
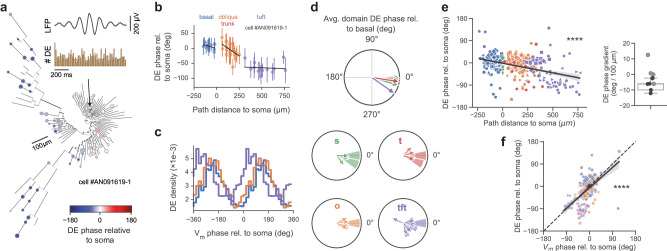
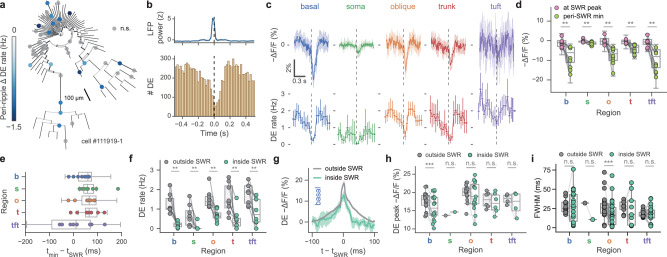
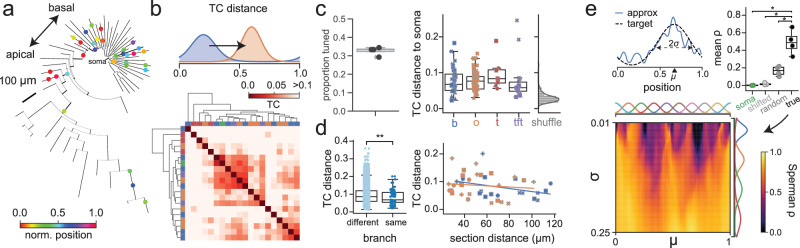
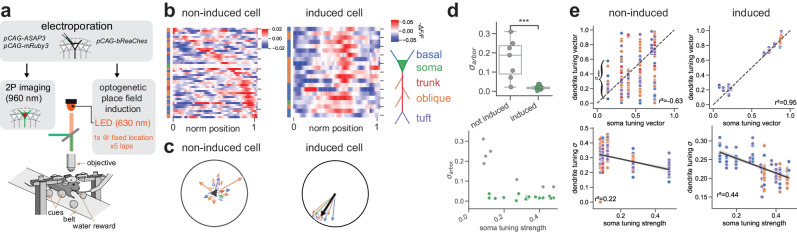
Fast electrical signaling in dendrites is central to neural computations that support adaptive behaviors. Conventional techniques lack temporal and spatial resolution and the ability to track underlying membrane potential dynamics present across the complex three-dimensional dendritic arbor in vivo. Here, we perform fast two-photon imaging of dendritic and somatic membrane potential dynamics in single pyramidal cells in the CA1 region of the mouse hippocampus during awake behavior. We study the dynamics of subthreshold membrane potential and suprathreshold dendritic events throughout the dendritic arbor in vivo by combining voltage imaging with simultaneous local field potential recording, post hoc morphological reconstruction, and a spatial navigation task. We systematically quantify the modulation of local event rates by locomotion in distinct dendritic regions, report an advancing gradient of dendritic theta phase along the basal-tuft axis, and describe a predominant hyperpolarization of the dendritic arbor during sharp-wave ripples. Finally, we find that spatial tuning of dendritic representations dynamically reorganizes following place field formation. Our data reveal how the organization of electrical signaling in dendrites maps onto the anatomy of the dendritic tree across behavior, oscillatory network, and functional cell states.


Conflict of interest statement

The authors declare no competing interests.

Figures

Fig. 1
Fig. 1. Detection and organization of depolarizing events (DEs) across the dendritic arbor and behavioral states.
a Experimental setup. Electroporation-imaging cannula window was implanted above the right dorsal hippocampal area CA1. A tungsten wire LFP electrode was inserted contralaterally, within or in proximity to the CA1 cell body layer. Mice were habituated using water rewards to run on a cued belt treadmill. ASAP3 and mRuby3 plasmids were single-cell electroporated (SCE) in CA1 pyramidal cells under two-photon microscopy guidance. Two-photon fluorescence measurements were obtained after approx. 36 hours post SCE from several tens of dendritic regions of interest (ROIs) across the whole dendritic tree. Scale bar 25 μm. b Morphological reconstruction and identification of recording locations. Left: two-photon microscopy stacks were acquired in vivo following each imaging session and neuronal morphologies were reconstructed (example cell AN012721-1). Inset scans show the extent of dendritic (basal: b4, trunk: t2, oblique: o7, tuft: tft1) and somatic imaging regions (scale bars 10μm). Right: phylogram representation of the same cell’s branching morphology, with radial distance from soma representing path distance to each recording location. Circles indicate imaging locations. c Example optical measurements of sequentially recorded dendritic electrical activity from cell shown in (b) during bouts of locomotion and rest. Optical signals were sampled at 440 Hz, stabilized against movement artifacts during locomotion epochs, match-filtered (MF) and thresholded for depolarizing event (DE) detection (arrows) (see Methods). Note that ASAP3 fluorescence is plotted as  − ΔF/F to reflect the direction of change in the membrane potential. Gray traces: animal position during the recording. d Electrophysiological calibration: A somatically recorded CA1PC action potential (black) was played through voltage-clamped ASAP3-expressing HEK293 cells at 37 °C and the corresponding ASAP3 fluorescence response (green) was recorded. Magenta: Markov model predicted ASAP3 response. For a detailed analysis of the Markov model, see Fig. S3. e Average z-scored DE waveforms for isolated events pooled from different dendritic domains with a fluorescence baseline SNR>10 (calibrated against a shot-noise baseline) during locomotion and immobility behavior states (N = 13 cells from 9 mice, colored curves). f DE frequency is reduced during locomotion states compared to immobility across all dendritic domains for fluorescence baseline SNR>10 (basal: p = 10−10, oblique: p = 2 × 10−15, soma: p = 0.03, trunk: p = 2 × 10−6, tuft: p = 4 × 10−5, Wilcoxon paired test; 587 dendrites from 13 cells). Two-way ANOVA for frequency: p = 3 × 10−11, main effect of region; p = 1 × 10−41, main effect of locomotion; F(4, 770) = 2.24, p = 0.06 region × locomotion interaction. Box: Q1, Q2, Q3; whiskers: range (excluding outliers). Points represent individual dendrites. α = 0.01 indicates significance for post hoc tests at the per-region level using Bonferroni’s correction.
Fig. 2
Fig. 2. Theta oscillation is organized across the dendritic tree as a traveling wave.
a Phylogram of fluorescence phase at recording locations, relative to estimated somatic phase (all regions showed significant sinusoidal phase modulation at p < 0.05 under a modified one-sided Z-test without multiple comparisons correction). Inset, top: Contralaterally-recorded extracellular theta-band-filtered (5–10 Hz) local-field potential (mean with 95% CI); Bottom: Cycle-averaged fluorescence oscillation of a basal dendritic segment (arrow, mean with 95% CI). b Dendritic tree gradients in theta oscillation phase, amplitude and DE phase for example cell in (a) during locomotion epochs. Top: Membrane potential oscillation phase advances along the basal-tuft axis relative to somatic phase (zero phase corresponds to a trough in somatic membrane potential oscillation). Region linear regression fits: phase dependence: basal (n = 20 segments, r2 = 0.27, p = 0.04), oblique (n = 46 segments, r2 = 0.39, p < 0.01), tuft (n = 20 segments, r2 = 0.32, p = 0.01); overall (r = − 0.89, p < 6 × 10−27). Bottom: Membrane potential oscillation amplitude increases along the basal-tuft axis. Region fits (same n as above): basal (r2 = 0.02, p = 0.62), oblique (r2 = 0.13, p = 0.02), tuft (r2 = 0.30, p = 0.01); overall (r = 0.84, p < 2 × 10−21). Data are presented as mean values ± SEM. c Subthreshold theta-band membrane potential oscillation is a traveling wave across the basal-tuft dendritic tree axis. Top: Heatmap of mean phase-binned fluorescence vs soma path-distance rank along basal-tuft axis for example cell in a (two cycles shown) with rank-regression line (Pearson’s r = − 0.70, p < 10−12). Vertical axis colored by cell region. Bottom: Cycle-averaged mean fluorescence (±bootstrapped 95% c.i.) of example cell as a function of theta phase relative to somatic phase. d Top: Correlation coefficients from rank-regression shown in c (top) of path-distance to soma vs phase bin of minimum. 8/11 cells recorded exhibit a significant phase gradient along the basal-tuft axis (black dots: significant cells; gray dots: nonsignificant cells), with 6/8 having a negative (advancing) gradient. Middle: Phase gradients from least-squares fit as in e calculated per-cell. 8/11 cells recorded show a significant phase gradient along the basal-tuft axis, with 7/8 having a negative (advancing) gradient. Bottom: Z-score amplitude gradients from least-squares fit as in (e) calculated per cell. 5/11 cells recorded exhibit a significant increasing gradient along the basal-tuft axis. e Population summary of theta-band membrane potential oscillation phase and amplitude gradients by recording segment during locomotion epochs. (colors: regions, markers: N = 11 unique cells). Top: Theta-band membrane potential oscillation phase advances with distance from basal to tuft regions (slope  = − 7. 9°/100μm, Pearson’s r: r = − 0.41, p = 1 × 10−19, Spearman’s rho: ρ = − 0.35, p = 2 × 10−14). Bottom: Theta-band membrane potential oscillation z-score amplitude increases with distance from basal to tuft regions. (slope  = 0.7%z/100 μm, Pearson’s r: r = 0.32, p = 8−13, Spearman’s rho: ρ = 0.37, p = 1 × 10−16). Regression line is shown with a 95% bootstrapped confidence interval.
Fig. 3
Fig. 3. Depolarizing events are organized across the dendritic tree by local theta oscillations.
a Phylogram of depolarizing event (DE) phase at recording locations, relative to estimated somatic phase (all regions showed significant phase modulation at p < 0.05 under a modified one-sided Z-test without multiple comparisons correction). Inset, top: Same contralaterally-recorded extracellular theta-band-filtered (5–10 Hz) local-field potential as in Fig. 2 (mean with 95% CI); Bottom: DE histogram, with DEs occurring preferentially at the peak of intracellular theta oscillation. b Dendritic tree gradient in DE phase for example cell in (a) during locomotion epochs. DE preferred phase advances along the basal-tuft axis relative to somatic DE phase. Region linear regression fits: basal (n = 20 segments, r2 = 0.18, p = 0.2), oblique (n = 46 segments, r2 = 0.2, p = 0.02), tuft (n = 20 segments, r2 = 0.01, p = 0.79); overall (r = − 0.81, p = 4 × 10−13). Data are presented as mean values +/- SEM. c Histogram of DE densities for the same example cell vs theta phase in the basal, oblique, trunk, and tuft domains relative to somatic membrane potential oscillation phase (two cycles shown, zero phase corresponds to estimated trough of somatic theta). DE density was defined as the DE rate (events / second) in each phase bin. d Resultant phase of DEs (relative to basal mean phase) also changed gradually along the basal-tuft axis. ROI preferred phases (histograms) and cell means (arrows) by region. e Left: Theta-band DE phase preference gradient across the basal-tuft axis relative to soma (slope  = − 7. 8°/100 μm, r = − 0.41, p = 10−14). Regression line shown with 95% bootstrapped confidence interval. Right: Strength of DE phase gradient by cell (significant cells in black, 5/10; boxplot significant only). f Dendritic DEs preferentially occur close to the peak of local theta-band dendritic membrane potential oscillations. Linear regression of DE resultant phase vs theta-band membrane potential oscillation phase, by recording segment (slope  = 0.91 ± 0.07 (mean  ± s.e.m.), (0.77, 1.04) 95% CI, r = 0.59, p = 10−30; colors: regions; markers: cells). Unless otherwise specified, all box-and-whisker plots show Q1, Q2, Q3, and range excluding outliers; points represent individual cells; r values are Pearson’s r; using Bonferroni correction α = 0.01 for post hoc tests performed on the per-region level, α = 0.05 for all other tests.
Fig. 4
Fig. 4. Sharp-wave ripple-associated modulation of dendritic electrical signaling.
a Example phylogram of a reconstructed cell (cell #111919-1) with significantly SWR-modulated recording locations colored by DE rate change inside minus outside of ripple epoch (gray: p > 0.05, two-tailed Poisson rate test). Significantly modulated recording locations show a suppression of DE rate during SWRs. b Top: Mean z-scored LFP power in ripple band. Bottom: Peri-SWR spike time histogram (all regions, N = 8 cells). c SWR-associated changes in fluorescence show hyperpolarization of membrane potential (top) and reduction in DE rate across the soma and dendritic arbor (bottom); average of N = 8 cells with 95% CI. Note trough of membrane potential hyperpolarization is visibly delayed with respect to SWR LFP peak power (dashed vertical lines) in most cellular compartments. Due to high background levels of internal membrane-bound ASAP3 in the somatic compartment, absolute fluorescence changes recorded from the soma are smaller compared to dendrites. d SWR-associated hyperpolarization from c (top). Mean amplitudes ( − ΔF/F) at peak of ripple power (pink), vs minimum in expanded SWR window (ripple peak  ± 100 ms; light green). Two-way ANOVA for membrane potential: p = 5 × 10−5, main effect of region; p = 2 × 10−13, main effect of SWR modulation; F(4, 69) = 5.55, p = 6 × 10−4 interaction of SWR × region. Maximal voltage hyperpolarization lags ripple power (p = 0.008 for all regions, Wilcoxon paired test). e Mean time of maximal membrane potential hyperpolarization of d with regard to SWR LFP peak power. f SWR-associated DE rate suppression from c (bottom). (p = 0.008 in all, Wilcoxon paired test). Two-way ANOVA for DE rate: p = 9 × 10−6, main effect of region; p = 7 × 10−12, main effect of SWR modulation; F(4, 69) = 0.72, p = 0.58 interaction of SWR × region. g Average DE waveforms are significantly decreased in the basal domain inside SWRs (green) compared to outside SWRs (gray). Waveforms with 95% CI were filtered with a 5-point moving average. h DE peak amplitudes are slightly decreased in the basal domain inside SWRs (p = 0.006) but not significantly modulated in soma or apical domains (oblique: p = 0.42, soma: p = 1.0, trunk: p = 0.44, tuft: p = 0.63, all Wilcoxon paired test). Two-way ANOVA for DE amplitude: p = 1 × 10−23, main effect of region; p = 0.0007, main effect of SWR modulation; F(4, 69) = 3.34, p = 0.01 interaction of SWR × region. i Full-width at half-max (FWHM) of regional average DE waveforms (as in g) shows significantly narrower peaks in the oblique domain (p = 0.0004, Wilcoxon paired test). Other regions were not significantly modulated (p = 1.0 for basal, soma, tuft, p = 0.57 for trunk). Two-way ANOVA for DE FWHM: p = 0.02, main effect of region; p = 0.058, main effect of SWR modulation; F(4, 158) = 1.25, p = 0.29 interaction of SWR × region. Unless otherwise specified, all box-and-whisker plots show segment-level Q1, Q2, Q3, and range excluding outliers; points represent individual cells (n = 8 cells throughout unless otherwise noted); using Bonferroni correction α = 0.01 for two-sided post hoc tests performed on the per-region level, α = 0.05 for all other tests.
Fig. 5
Fig. 5. Spatial tuning in non-place pyramidal cell dendrites.
a Example phylogram of reconstructed cell (AN061420-1), with recording locations colored by tuning curve centroid. b Example tuning curve distance (TCD, i.e. Wasserstein distance) matrix. Many segments exhibit high distance from soma. Top: Schematic of TCD calculation. TCD is normalized such that d = 1 corresponds to point masses on opposite sides of the belt. c Left: Proportion of tuned dendrites by cell, where tuning is defined as having a p-value below the 5th percentile of a random shuffle. Right: Cotuning of tuned dendrites with their respective soma. Black: N = 89 tuned dendrites from 4 cells; gray: TC distance 95th percentile from shuffle performed on each dendrite. Basal: p = 2 × 10−5, oblique: p = 8 × 10−9, trunk: p = 0.008, tuft: p = 0.02, Mann–Whitney U test. d Dendrites operate as compartments on the single-branch level. Left: Pairs of segments recorded on the same branch (n = 96 pairs) are significantly more co-tuned than pairs on different branches (n = 6568 pairs) (p = 0.0009, Mann-Whitney U test). e Arbitrary somatic tuning curves can be realized as sparse nonnegative combinations of tuned dendrites in non-place cells (n = 4 cells). Top left: Example tuning curve and approximation as weighted sum of dendrites. Top right: Mean realizability (Spearman’s ρ) of tuning curves in (bottom) using somatic tuning curve alone, somatic tuning curve with local shifts, and random tuning curves (true vs soma-only: p = 0.018, true vs soma/shifted: p = 0.007, true vs random: p = 0.006, paired t-test). Bottom: Realizability of theoretical Gaussian tuning curves parameterized by location and width as nonnegative least-squares fit from tuned dendrites. Unless otherwise specified, all box-and-whisker plots show Q1, Q2, Q3, and range excluding outliers. All statistical tests performed in a two-sided manner where relevant unless otherwise specified.
Fig. 6
Fig. 6. Spatial tuning in pyramidal cells dendrites following place field induction.
a Experimental setup. ASAP3, mRuby3 and bReaChes plasmids were single-cell electroporated in CA1 pyramidal cells. Place fields were optogenetically induced with 1s-long LED photostimulation of bReaChes at randomly chosen, fixed location on the treadmill belt for five consecutive laps. b Example tuning maps of dendrites from a non-induced (non-place) and an induced (place) cell, sorted by tuning curve maximum. c Mean normalized DE tuning vectors from an example non-induced (non-place) and an induced ('place') cell. Each arrow represents a single dendrite. d Tuning diversity across the dendritic arbor (σarbor) in induced (N = 15) and non-induced (N = 7) cells. Top: The dendritic arbor of induced cells exhibit significantly less tuning diversity σarbor, defined as the circular standard deviation of tuning peaks in the arbor, compared to the dendrites of induced cells (two-sided Mann–Whitney U test, p = 8 × 10−5). Bottom: Relationship between arbor tuning diversity and strength of somatic tuning. The arbors of induced cells exhibit low diversity at all somatic tuning strengths, while a significant inverse relationship exists between tuning diversity and soma tuning strength in non-induced cells (r2 = 0.74, p = 0.006). Box: Q1, Q2, Q3; whiskers: range excluding outliers. e Relationship between tuning parameters (tuning peak, tuning strength) at the level of individual soma-dendrite pairs in non-induced (N = 7) and induced (N = 15) cells. Top row: Dendrite peak locations are tightly coupled to their corresponding soma peak location (r2 = 0.95 for the line y = x, black dashed line; N = 123 dendrites from 15 non-induced cells) in induced cells but much less coherent (r2 = −0.63, N = 217 dendrites from 7 cells) in non-induced cells. Bottom row: More strongly tuned somas tend to have dendrites with more spatially coherent firing in both non-induced (r2 = −0.22) and induced (r2 = 0.44) cells, with a higher magnitude correlation for induced compared to non-induced cells. Regression fit line is shown with bootstrapped 95% CI.

Update of

References

    1. Buzsaki, G. & Draguhn, A. Neuronal oscillations in cortical networks. Science304, 1926–9 (2004). - PubMed
    1. Salinas, E. & Sejnowski, T. J. Correlated neuronal activity and the flow of neural information. Nat. Rev. Neurosci.2, 539–50 (2001). - PMC - PubMed
    1. Fries, P. Rhythms for cognition: communication through coherence. Neuron88, 220–35 (2015). - PMC - PubMed
    1. Singer, W. Neuronal synchrony: a versatile code for the definition of relations? Neuron24, 49–65, 111–25 (1999). - PubMed
    1. Buzsaki, G. & Moser, E. I. Memory, navigation and theta rhythm in the hippocampal-entorhinal system. Nat. Neurosci.16, 130–8 (2013). - PMC - PubMed

LinkOut - more resources