. 2024 Jul 26;15(1):6305.
doi: 10.1038/s41467-024-50619-z.

AGILE platform: a deep learning powered approach to accelerate LNP development for mRNA delivery

Affiliations

AGILE platform: a deep learning powered approach to accelerate LNP development for mRNA delivery

Yue Xu et al. Nat Commun. .

Abstract

Ionizable lipid nanoparticles (LNPs) are seeing widespread use in mRNA delivery, notably in SARS-CoV-2 mRNA vaccines. However, the expansion of mRNA therapies beyond COVID-19 is impeded by the absence of LNPs tailored for diverse cell types. In this study, we present the AI-Guided Ionizable Lipid Engineering (AGILE) platform, a synergistic combination of deep learning and combinatorial chemistry. AGILE streamlines ionizable lipid development with efficient library design, in silico lipid screening via deep neural networks, and adaptability to diverse cell lines. Using AGILE, we rapidly design, synthesize, and evaluate ionizable lipids for mRNA delivery, selecting from a vast library. Intriguingly, AGILE reveals cell-specific preferences for ionizable lipids, indicating tailoring for optimal delivery to varying cell types. These highlight AGILE's potential in expediting the development of customized LNPs, addressing the complex needs of mRNA delivery in clinical practice, thereby broadening the scope and efficacy of mRNA therapies.


Conflict of interest statement

Y.X., J.C., and B.L. have filed a provisional patent for the development of the described lipids. The remaining authors declare no competing interests.

Figures

Fig. 1
Fig. 1. Overview of the platform design pipeline.
a Illustration of the 3-stage workflow of the platform. Stage 1: construction of a virtual library and self-supervised pre-training of the model. Stage 2: synthesis of an experimental library for the fine-tuning of the model in a supervised manner. Stage 3: deployment of the fine-tuned model for predictive analysis on a candidate library, followed by ranking for final candidate selection (GNN graph neural network). b Depiction of virtual library design through the application of 3-CR (three components reaction) Ugi combinatorial chemistry. c Schematic representation of the rational selection process for lipid candidates, with three listed filtering criteria. d A comprehensive breakdown of the ranking procedure and the selection methodology for final candidates. The figure was created with BioRender.com and released under a Creative Commons Attribution-NonCommercial-NoDerivs 4.0 International license.
Fig. 2
Fig. 2. High-throughput lipids synthesis and screening platform.
a A schematic to illustrate the high-throughput synthesis method for the toolbox of lipids (1200). b The combinatorial lipids library consists of three components structure (amine headgroups, aldehyde tails, and isocyanide tails). c A schematic diagram shows the lipid nanoparticles (LNPs) components for mRNA encapsulating. d Lipid synthesis, LNPs formulation, and luciferase assay are automated by a liquid handling robot. e The data used for the fine-tuning are depicted in a balloon plot, which involved 1200 lipids for Fluc mRNA (mFLuc) delivery and measuring the relative luciferase expression in HeLa cells. f The loss value on the training set and validation set against fine-tuning steps. g The precision matrix computed on the experimental library of 1200 lipids. The mRNA transfection potency (mTP) is divided into six equal percentiles, which are predicted and compared to the actual results. h Uniform Manifold Approximation and Projection (UMAP) plot of the experimental library, colored by the mTP. Panels (c, d) were created with BioRender.com and released under a Creative Commons Attribution-NonCommercial-NoDerivs 4.0 International license.
Fig. 3
Fig. 3. Model prediction and the validation of the gene editing potential with top-performing mRNA LNPs.
a The Uniform Manifold Approximation and Projection (UMAP) plot of the predicted mRNA transfection potency for lipids. b Headgroups distribution and c tail combinations distribution in HeLa. d Transfection test of 15 lipid candidates selected by AI-Guided Ionizable Lipid Engineering (AGILE) platform in HeLa cells (n = 2). e Illustration of in vivo transfection study: mRNA transfection potency (mFluc) LNPs were intramuscularly injected into the mice followed by IVIS imaging at 6 h post-injection. f IVIS imaging of injection sites and livers collected from mice after intramuscular injection of mFluc LNPs, containing H9, MC3, and ALC-0315 were injected intramuscularly into mice respectively (n = 3 biologically independent mice/group, 0.5 mg kg−1 mFLuc per mouse). g Quantification of luminescent intensity at the intramuscular injection site in mice (n = 3 biologically independent mice/group). h Quantification of luminescent intensity in mouse livers (n = 3 biologically independent mice/group). i Illustration of the mTmG (membrane-Tomato/membrane-Green) mouse model: in the absence of Cre recombinase, tdTomato (tandem dimer Tomato) reporter is expressed; the presence of Cre recombinase deletes STOP cassettes and results in the expression of green fluorescent protein (GFP) reporter in mice. j Representative confocal microscopy images and quantification of tdTomato and GFP expression in histological muscle and liver sections of mTmG mice post-injection of Cre mRNA loaded LNPs by intramuscular injection. Scale bar: 50 µm. Sections from 3 mice (n = 5). Red represents tdTomato, Green represents GFP, and blue represents the nucleus (DAPI). Statistical significance was analyzed by a two-way analysis of variance (ANOVA) with t-test. Source data are provided as a Source Data file. Panels (e, i) were created with BioRender.com and released under a Creative Commons Attribution-NonCommercial-NoDerivs 4.0 International license.
Fig. 4
Fig. 4. Accelerating screening of lipids for eGFP-mRNA delivery in macrophage through the platform.
a The UMAP plot of the predicted mRNA transfection potency (mTP) for lipids. b Top five headgroups distribution and c top three and bottom two tail combinations distribution in RAW 264.7. d Validation of 15 lipid candidates in RAW 264.7 cells (n = 2). e Comparison of the mTP of H9, MC3, and R6 LNPs in RAW 264.7 cells and HeLa cells (n = 6). f Confocal images of RAW 264.7 cells transfected by GFP-mRNA LNPs (n = 3). Scale bar: 20 µm. Green represents GFP and blue represents the nucleus (DAPI). g Percentage of GFP positive cells on RAW 264.7 after treatment with MC3, ALC-0315, H9, and R6 LNPs. Statistical significance was analyzed by a two-way analysis of variance (ANOVA) with t-test. **** Represented p < 0.0001. Source data are provided as a Source Data file.
Fig. 5
Fig. 5. Model feature explanation and finding.
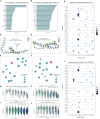
a, b This model has identified the top 20 most important molecular descriptors, which have been fine-tuned for HeLa and RAW 264.7. c, d Three-dimensional visualizations of the H9 and R6 structures, with the important regions highlighted for easy identification. e, f The top 15 lipid candidates in HeLa and RAW 264.7 cells have been organized into similarity networks, with each candidate being connected to its four closest neighbors. g The violin plot shows how the predicted potencies are distributed among Tail 1 with varied carbons for the RAW 264.7 cells, using lipids with the most effective headgroup A5 (n = 9, 18, 27, 45, 54, 53, 35, 39, 45, 36, 27, 27, 40, 21, and 27, respectively). h A similar violin plot as in (g) but focusing on lipids of the entire candidate set (n = 198, 396, 594, 990, 1188, 1226, 830, 948, 990, 792, 594, 594, 910, 552, and 594, respectively). i A similar violin plot as in (h) but focusing on the length of Tail 2 (n = 1364, 1188, 1364, 1188, 1364, 1188, 2552, and 1188, respectively). j A similar violin plot as in (h) but focusing on the lipids of the entire candidate set for the HeLa cell (n = 198, 196, 594, 990, 1188, 1226, 830, 948, 990, 792, 594, 594, 910, 552, and 594, respectively). The box denotes the interquartile range of predicted potency change. The mean is marked by the central dot within each box. The error bars represent the 95% confidence interval in (gj). k, l Top two most important molecular descriptors identified by this model fine-tuned for HeLa and RAW 264.7 cells, respectively, for each headgroup. Source data are provided as a Source Data file.

References

    1. Qin, S. et al. mRNA-based therapeutics: powerful and versatile tools to combat diseases. Signal Transduct. Target. Ther.7, 166 (2022). 10.1038/s41392-022-01007-w - DOI - PMC - PubMed
    1. Hou, X., Zaks, T., Langer, R. & Dong, Y. Lipid nanoparticles for mRNA delivery. Nat. Rev. Mater.6, 1078–1094 (2021). 10.1038/s41578-021-00358-0 - DOI - PMC - PubMed
    1. Kim, Y.-K. RNA therapy: rich history, various applications and unlimited future prospects. Exp. Mol. Med.54, 455–465 (2022). 10.1038/s12276-022-00757-5 - DOI - PMC - PubMed
    1. Mendes, B. B. et al. Nanodelivery of nucleic acids. Nat. Rev. Methods Prim.2, 24 (2022).10.1038/s43586-022-00104-y - DOI - PMC - PubMed
    1. Mitchell, M. J. et al. Engineering precision nanoparticles for drug delivery. Nat. Rev. Drug Discov.20, 101–124 (2021). 10.1038/s41573-020-0090-8 - DOI - PMC - PubMed