. 2024 Jul 27;14(1):17256.
doi: 10.1038/s41598-024-67901-1.

Role of mucosal-associated invariant T cells dynamics in pathogenesis of Sjögren syndrome

Affiliations

Role of mucosal-associated invariant T cells dynamics in pathogenesis of Sjögren syndrome

Jeanne Chauffier et al. Sci Rep. .

Abstract

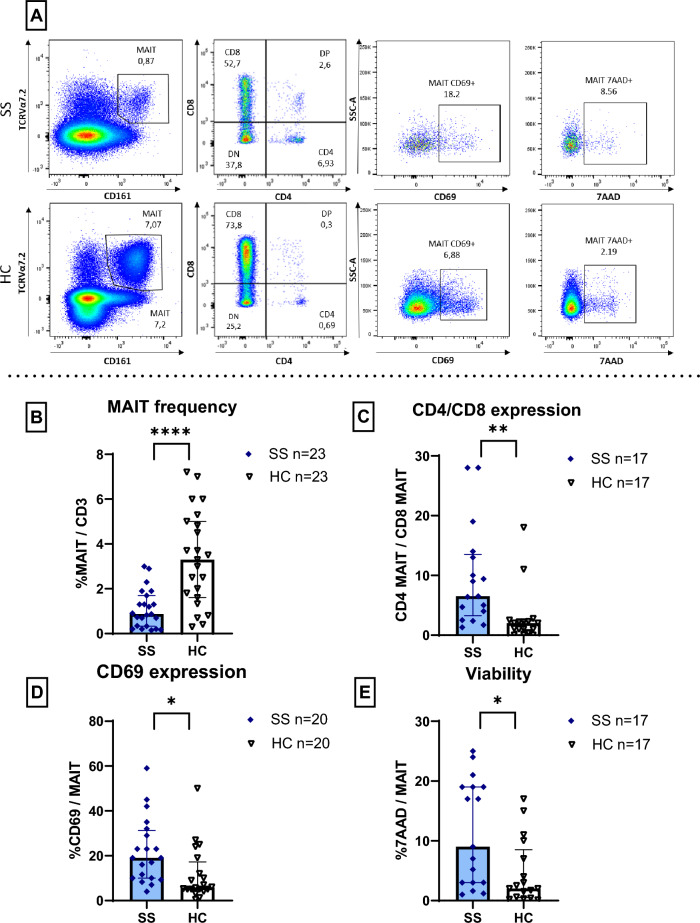
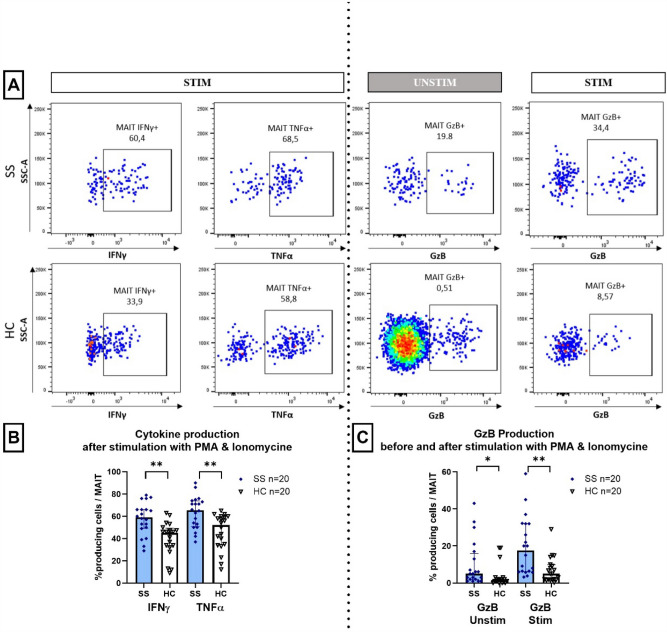
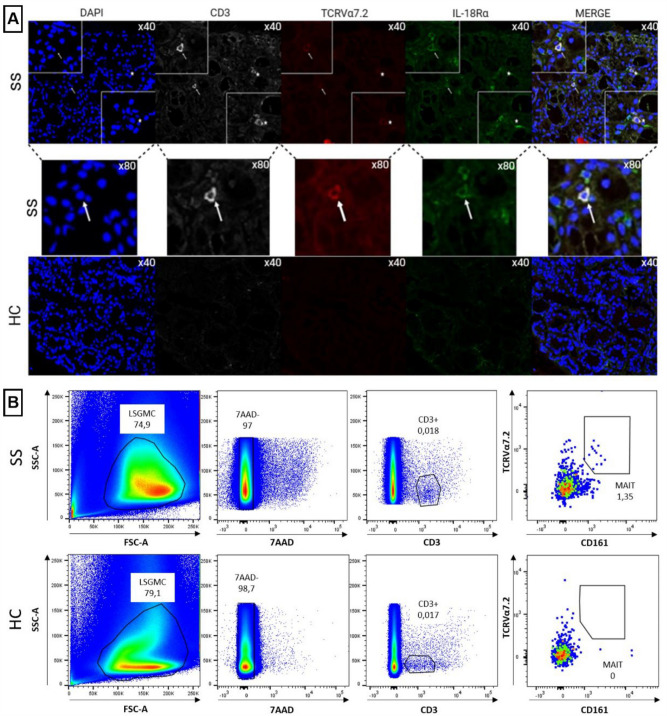
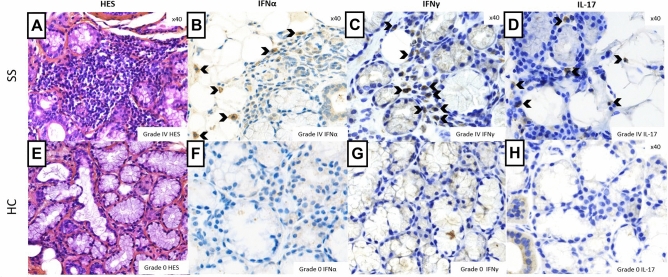
Sjögren syndrome (SS) is an autoimmune disease characterized by chronic inflammatory infiltrates in the salivary and lacrimal glands. Mucosal-associated invariant T (MAIT) cells are a subset of innate-like T-cells, predominantly found in mucosal tissues with crucial role in epithelial homeostasis. Thus, MAIT cells may be implicated in mucosal alterations of SS patients. Activation markers, inflammatory and cytotoxic cytokines were examined in 23 SS patients and compared to 23 healthy controls (HC). Tissular MAIT cells in salivary gland (SG) biopsies were also analyzed. Circulating MAIT cells were decreased in SS patients with a higher expression of CD69 and a higher CD4/CD8 ratio of MAIT cells. MAIT cells showed a higher production of IFNγ, TNFα and GzB in SS compare to HC. Tissular MAIT cells were present within inflamed SG of SS patients, while they were absent in SG of HC. Overall, circulating MAIT cells are decreased in the peripheral blood of SS albeit producing higher amounts of IFNγ, TNFα, and GzB. Tissular MAIT cells are detected in salivary glands from SS with a proinflammatory tissular cytokine environment. MAIT cells with abnormal phenotype, functions and tissular homeostasis may contribute to epithelial damage in SS.


Conflict of interest statement

The authors declare no competing interests.

Figures

Figure 1
Figure 1
Comparison of MAIT circulating blood cells frequency and phenotypes from SS patients and HC subjects. (A) Representative gating strategy and flow cytometry plots of MAIT cells in PBMC from an SS patient and a control as determined by flow cytometry. (B) Representative flow cytometry plots of peripheral blood mononuclear cells (PBMCs) from an SS patient and a HC, displayed from left to right: total MAIT cells as a percentage of CD3+ cells, CD4+ and CD8+ cell percentages among MAIT cells, CD69+ cell percentage among MAIT cells, and 7-AAD+ cell percentage among MAIT cells without initially excluding apoptotic cells. (C) Representative dot plot of MAIT cell subsets defined by TCRVα7.2 expression in combination with CD161high, CD3+ are shown as percentages of the CD3+ T cell population in SS and HC. (D) Representative dot plot of CD4/CD8 staining of all MAIT cells in SS and HC. (E) Representative dot plot of activation marker CD69+ staining of all MAIT cells in SS and HC. (F) Representative dot plot of apoptotic marker 7-AAD+ staining of all MAIT cells in SS and HC without elimination of 7AAD+ cells during the gating strategy. Bar plots show all individuals and median [interquartile range]. HC healthy control, SS Sjögren’s syndrome patients. *p < 0.05, **p < 0.01, ***p < 0.001, ****p < 0.0001 (Mann–Whitney test).
Figure 2
Figure 2
Comparison of MAIT cell cytokine and granzyme B production in peripheral blood between SS patients and healthy control (HC) subjects. (A) Representative flow cytometry plots showing from left to right: IFNγ-producing MAIT cells after PMA and ionomycin stimulation, TNFα-producing MAIT cells after PMA and ionomycin stimulation, granzyme B (GzB)-producing MAIT cells before stimulation, and GzB-producing MAIT cells after PMA and ionomycin stimulation in one SS patient's PBMC and one HCs PBMC. (B) “Representative dot plot showing IFNγ and TNFα staining of all MAIT cells after PMA and ionomycine stimulation in SS patients and HC”. (C) Representative dot plot showing GzB staining of all MAIT cells in SS patients and HC. Bar plots show all individuals and median [interquartile range]. HC healthy control, SS Sjögren’s syndrome patients. *p < 0.05, **p < 0.01 (Mann–Whitney test).
Figure 3
Figure 3
Labial salivary gland MAIT cell frequency in SS patients and HC subjects. (A) Confocal microscopy analysis of MAIT cells in labial salivary gland biopsy (LGSB) sample from SS patient with sialadenitis grade IV according to Chisholm and Mason classification. CD3 is shown in white, TCRVα7.2 in red, IL-18Rα in green, and DAPI depicts nuclei of LSGB cells in blue. The images are magnified at ×40. A higher magnification view (×80) shows the co-localization of the three MAIT-specific markers used. The tertiary panel (HC) shows the results of a staining with the same primary and secondary antibodies on a normal labial salivary gland biopsy. (B) Representative gating strategy and flow cytometry plots of MAIT cells in labial salivary gland mononuclear cells (LSGMC) from an SS patient and a HC, as determined by flow cytometry.
Figure 4
Figure 4
Labial salivary gland (LSG) from SS patient (grade IV according to Chisholm and Mason classification) and HC (normal LSG): Detection of IFNα, IFNy, IL-17 producing cells in labial salivary gland (LSG) tissue from SS patient (AD) grade IV according to Chisholm and Mason classification; and HC (EH) normal LSG. (A,E) Representative images of hematoxylin and eosin (HES) stain of LSG paraffin sections from (A) one SS and (E) one HC. (BD, FH) Representative immunoperoxidase stains of serial sections. Primary antibodies as indicated: (B,F) mouse anti-human IFNα on (B) SS and (F) HC; (C,G) mouse anti-human IFNy on (C) SS and (G) HC; (D,H) mouse anti-human IL-17 on (D) SS and (H) HC. Arrows indicate positive stained cells. The scale is noted in right higher corner of the figure. Data shown are representative of single staining from n = 5 SS and n = 5 HC.
Figure 5
Figure 5
Our data suggest that changes in the abundance and phenotype of MAIT cells within the peripheral blood cell population, with significantly reduced MAIT levels but elevated activation, apoptosis, and expression of cytotoxic and pro-inflammatory molecules indicative of a dysfunctional and exhausted profile, characterize patients with Sjögren syndrome. Significant decreases in circulating MAIT cells could suggest either an increased cell death and/or an enhanced MAIT cells migration into inflamed tissues.

References

    1. Shiboski, C. H. et al. 2016 American College of Rheumatology/European League Against Rheumatism classification criteria for primary Sjögren’s syndrome: A consensus and data-driven methodology involving three international patient cohorts. Ann. Rheum. Dis.76(1), 9–16 (2017). 10.1136/annrheumdis-2016-210571 - DOI - PubMed
    1. Daniels, T. E. et al. Associations between salivary gland histopathologic diagnoses and phenotypic features of Sjögren’s syndrome among 1726 registry participants. Arthritis Rheum.63(7), 2021–2030 (2011). 10.1002/art.30381 - DOI - PMC - PubMed
    1. Flament, H. et al. Outcome of SARS-CoV-2 infection is linked to MAIT cell activation and cytotoxicity. Nat. Immunol.5, 1 (2021). - PubMed
    1. du Halgouet, A. et al. Role of MR1-driven signals and amphiregulin on the recruitment and repair function of MAIT cells during skin wound healing. Immunity56(1), 78-92.e6 (2023). 10.1016/j.immuni.2022.12.004 - DOI - PMC - PubMed
    1. Gnirck, A. C. et al. Mucosal-associated invariant T cells contribute to suppression of inflammatory myeloid cells in immune-mediated kidney disease. Nat. Commun.14(1), 7372 (2023). 10.1038/s41467-023-43269-0 - DOI - PMC - PubMed