. 2024 Sep;31(9):1113-1126.
doi: 10.1038/s41418-024-01348-9. Epub 2024 Jul 26.

Ferroptosis is a targetable detrimental factor in metabolic dysfunction-associated steatotic liver disease

Affiliations

Ferroptosis is a targetable detrimental factor in metabolic dysfunction-associated steatotic liver disease

Cédric Peleman et al. Cell Death Differ. 2024 Sep.

Abstract

There is an unmet clinical need for pharmacologic treatment for metabolic dysfunction-associated steatotic liver disease (MASLD). Hepatocyte cell death is a hallmark of this highly prevalent chronic liver disease, but the dominant type of cell death remains uncertain. Here we report that ferroptosis, an iron-catalyzed mode of regulated cell death, contributes to MASLD. Unsupervised clustering in a cohort of biopsy-proven MASLD patients revealed a subgroup with hepatic ferroptosis signature and lower glutathione peroxidase 4 (GPX4) levels. Likewise, a subgroup with reduced ferroptosis defenses was discerned in public transcriptomics datasets. Four weeks of choline-deficient L-amino acid-defined high-fat diet (CDAHFD) induced MASLD with ferroptosis in mice. Gpx4 overexpression did not affect steatohepatitis, instead CDAHFD protected from morbidity due to hepatocyte-specific Gpx4 knockout. The ferroptosis inhibitor UAMC-3203 attenuated steatosis and alanine aminotransferase in CDAHFD and a second model, i.e., the high-fat high-fructose diet (HFHFD). The effect of monounsaturated and saturated fatty acids supplementation on ferroptosis susceptibility was assessed in human HepG2 cells. Fat-laden HepG2 showed a drop in ferroptosis defenses, increased phosphatidylglycerol with two polyunsaturated fatty acid (PUFA) lipid tails, and sustained ferroptosis sensitivity. In conclusion, this study identified hepatic ferroptosis as a detrimental factor in MASLD patients. Unexpectedly, non-PUFA supplementation to hepatocytes altered lipid bilayer composition to maintain ferroptosis sensitivity. Based on findings in in vivo models, ferroptosis inhibition represents a promising therapeutic target in MASLD.


Conflict of interest statement

TVB and KA own patents related to ferroptosis inhibitors (US9862678, WO2016075330, EP3218357, WO2019154795). All other authors declare that they have no financial or non-financial interests related to this manuscript. Please refer to the accompanying ICMJE disclosure forms for further details.

Figures
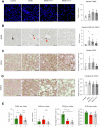
Fig. 1
Fig. 1. Signature of hepatic ferroptosis in subset of MASLD patients.
Ferroptosis markers in liver biopsies from controls (n = 5), MASLD patients with isolated steatosis (MASL, n = 8), metabolic dysfunction-associated steatohepatitis without (MASH F0-1, n = 7) or with significant fibrosis (MASH F2-3, n = 7). A Terminal deoxynucleotidyl transferase dUTP nick end labeling (TUNEL) stain (red) with DAPI (blue). B Immunohistochemistry (IHC) for 4-hydroxynonenal (4HNE). Red arrows indicate aggregates of ferroptosis breakdown products. C, D IHC glutathione peroxidase 4 (GPX4) and acyl-CoA synthetase long-chain family member 4 (ACSL4). Contours of nuclei, cytoplasm and lipid vacuoles annotated. Magnification 400×, scale bar 50 µm. E TUNEL, 4HNE, GPX4 and ACSL4 in clusters 1, 2 and 3 as determined by k-prototypes partitioning clustering. Mean ± standard deviation. *p < 0.05; **p < 0.01; ***p < 0.001; Kruskal–Wallis with Dunn’s test.
Fig. 2
Fig. 2. Public transcriptomics datasets reveal subset of MASLD patients with hepatic ferroptosis susceptibility signature.
Hepatic expression of ferroptosis-related genes studied in three cohorts of MASLD patients and controls. Genes were grouped in gene sets for which each patient received a gene set variation analysis (GSVA) score. Higher GSVA scores for “ferroptosis defenses” and “GSH” indicate upregulated ferroptosis defenses and increased glutathione (GSH) synthesis, respectively. Higher “PUFA” and “Iron” scores indicate drive toward more PUFA in phospholipids for ferroptosis. A GSVA scores for patients in three clusters determined by Gaussian Mixture modeling in GSE130970 (n = 78). Table displaying distribution of histologic groups across different clusters. B, C Patients from GSE135251 (n = 206) and GSE126848 (n = 57) received GSVA scores for four gene sets and cluster membership. Red clusters represent ferroptosis-sensitizing PUFA incorporation together with lowered ferroptosis defenses; green clusters exhibit highly expressed ferroptosis defenses. Violin plots show median and quartiles. *p < 0.05; **p < 0.01; ***p < 0.001; Kruskal–Wallis with Dunn’s test.
Fig. 3
Fig. 3. Detection of ferroptosis markers in CDAHFD.
Markers of hepatic cell death and ferroptosis were measured in groups of mice fed the standard diet (SD) or choline-deficient L-amino acid-defined high-fat diet (CDAHFD) with an emphasis on the 4-week timepoint (n = 6 per group). A Hepatic MDA measured in mice on SD or CDAHFD for 1, 2, 3, 4 and 6 weeks. B Representative images and quantification of the terminal deoxynucleotidyl transferase dUTP nick end labeling (TUNEL) stain (red), with DAPI counterstain (blue), in mice fed SD or CDAHFD for 4 weeks. C, D Representative images of immunohistochemistry (IHC) for 4HNE and Gpx4 in mice on SD or CDAHFD for 4 weeks. To quantify the change in distribution of these epitopes, liver lobules were reconstructed based on the Voronoi principle. The proportion of area positive for 4HNE or Gpx4 is plotted with regards to the relative distance (0–1) within the liver lobule, between the portal triads (value 0) to the centrolobular veins (value 1 on x-axis). Slides for IHC were pooled from two independent experiments. E Hepatic mRNA expression of Gpx4 in mice on SD or CDAHFD on different time points, expressed as calibrated normalized relative quantities (CNRQ). F Western blot to visually inspect the protein level of Gpx4 in mice on SD or CDAHFD for 4 weeks. Results are presented as mean ± standard deviation. Mann–Whitney U test with correction for multiple hypothesis testing; *p < 0.05; **p < 0.01. Magnification 100×, scale bar represents 200 µm.
Fig. 4
Fig. 4. While Gpx4 overexpression has no effect, CDAHFD-induced MASH protects against loss of hepatocyte Gpx4.
Role of glutathione peroxidase 4 (Gpx4) in choline-deficient L-amino acid-defined diet (CDAHFD) was explored using transgenic mice with whole-body GPX4 overexpression (Gpx4Tg/+) or tamoxifen-inducible hepatocyte-specific Gpx4 knockout (Gpx4fl/fl AlbCreERT2Tg/+). A Western blot for hepatic Gpx4 in Gpx4Tg/+ and wild-type littermates (Gpx4+/+) fed CDAHFD or standard diet (SD). B, C Hepatic MDA and reduced glutathione (GSH) normalized for protein content (n = 6 or 8). D Experimental design for hepatocyte-specific Gpx4 knockout (n = 5 or 7). E Kaplan–Meier curves of Gpx4fl/fl AlbCreERT2Tg/+ fed SD or CDAHFD; day 0 equals first day of tamoxifen. F Western blot of hepatic Gpx4 in Gpx4fl/fl AlbCreERT2Tg/+ (brackets) and controls (Gpx4fl/fl AlbCreERT2+/+, without brackets) after tamoxifen. G H&E stain of Gpx4fl/fl AlbCreERT2Tg/+ and controls fed SD or CDAHFD at spontaneous morbidity or experiment termination. Magnification 100×, scale bar 200 µm. H Serum alanine aminotransferase (ALT), aspartate aminotransferase (AST). I Mass spectrometry for hepatic vitamin E, ratios of reduced-on-oxidized glutathione (GSH/GSSG), tetrahydrobiopterin-on-7,8-dihydro-L-biopterin (BH4/BH2) and oxidized-on-reduced nicotinamide adenine dinucleotide (NADH/NAD). Data from two independent experiments, mean ± standard deviation. Scale bar 200 µm. *p < 0.05; **p < 0.01; ***p < 0.001; #p < 0.05 for factor diet; §p < 0.05 for factor genotype. Log-rank test, two-way ANOVA with post-hoc test.
Fig. 5
Fig. 5. Therapeutic ferroptosis inhibition attenuates hepatocyte damage and steatosis in CDAHFD.
A Experimental design of UAMC-3203 (12.35 mg/kg bodyweight) or 0.9% NaCl (vehicle) via subcutaneous osmotic minipumps (n = 12 or 16) in animals fed CDAHFD or SD for 4 weeks. B Hepatic MDA. C Serum ALT, AST. D H&E and Masson’s trichrome. Magnification 100×, scale bar 200 µm. E Liver-on-bodyweight ratio. F Quantification of liver area enveloped by macrovesicular steatosis. G Scoring of steatosis, ballooning, lobular inflammation, NAFLD activity score and fibrosis. Mean ± standard deviation. Data from two independent experiments combined. *p < 0.05; **p < 0.01; ***p < 0.001; #p < 0.05 for factor diet. Two-way ANOVA with post-hoc test. Kruskal–Wallis with post-hoc testing for ordinal histologic scoring.
Fig. 6
Fig. 6. Therapeutic ferroptosis inhibition attenuates steatosis and features of metabolic syndrome in HFHFD.
A Experimental design of therapeutic administration of UAMC-3203 or 0.9% NaCl (vehicle) via subcutaneous osmotic minipumps in animals fed high-fat high-fructose diet (HFHFD) or SD for 24 weeks. B Relative weight change during pharmacologic treatment. Area under curve (AUC) for intraperitoneal glucose tolerance test, adjusted for AUC before pharmacological intervention. Gonadal adipose tissue-on-bodyweight ratio. C Serum alanine aminotransferase (ALT), aspartate aminotransferase (AST), total cholesterol. D H&E and Masson’s trichrome. Magnification 100×, scale bar 200 µm. E Scoring of steatosis, lobular inflammation and NAFLD activity score. F Quantification of liver area enveloped by macrovesicular steatosis. Data from two independent experiments combined (n = 9). *p < 0.05; **p < 0.01; ***p < 0.001; #p < 0.05 for factor diet; §p < 0.05 for factor intervention. Analysis of covariance (ANOVA) with adjustment for relative weight change during pharmacologic intervention with post-hoc test if appropriate. Kruskal–Wallis with post-hoc testing for ordinal histologic scoring.
Fig. 7
Fig. 7. Oleic and palmitic acid supplementation in HepG2 increases PG-PUFA2 leading to ferroptosis susceptibility.
To study the effect of lipid accumulation on ferroptosis sensitivity, HepG2 cells were exposed to glucose, insulin, three cytokines and different species of fatty acids, i.e., oleic and palmitic acid (OA/PA), arachidonic acid (AA 20:4, ω-6 PUFA) or docosahexaenoic acid (DHA 22:6, ω-3 PUFA). A Experimental design of fatty acid incubation and ferroptosis induction with GPX4 inhibitor ML162. B Neutral lipids measured with AdipoRed. C Percentage of cell death (with SytoxGreen) at increasing ML162 concentrations. After fitting non-linear regressions per condition, best-fit half maximal effective concentration (EC50) values were compared using Aikake Information Coefficient and one-way ANOVA with post-hoc testing. D Representative images of C11-BODIPY (581/591) dye in HepG2. Oxidized dye (green) indicates lipid radical oxygen species 2 h after ML162, as opposed to the normal reduced form (red). E Gene set enrichment analysis (GSEA) plots for gene sets “ferroptosis defenses” and “GSH” in HepG2 treated with OA/PA compared to solvent control (Control), with normalized enrichment score (NES) (n = 6). F Percentage of phosphatidylglycerol (PG) esterified with one or two polyunsaturated fatty acids, i.e., PG-PUFA and PG-PUFA2. Percentage of phosphatidylcholine and phosphatidylethanolamine with two PUFA, i.e., PC-PUFA2 and PE-PUFA2, respectively (n = 3). Data pooled from three independent experiments, performed in triplicate, except for C11-BODIPY (581/591). *p < 0.05; **p < 0.01; ***p < 0.001. One-way ANOVA with post-hoc test.

References

    1. Marchesini G, Day CP, Dufour JF, Canbay A, Nobili V, Ratziu V, et al. EASL-EASD-EASO Clinical Practice Guidelines for the management of non-alcoholic fatty liver disease. J Hepatol. 2016;64:1388–402. 10.1016/j.jhep.2015.11.004 - DOI - PubMed
    1. Younossi ZM, Golabi P, Paik JM, Henry A, Van Dongen C, Henry L. The global epidemiology of nonalcoholic fatty liver disease (NAFLD) and nonalcoholic steatohepatitis (NASH): a systematic review. Hepatology. 2023;77:1335–47. 10.1097/HEP.0000000000000004 - DOI - PMC - PubMed
    1. Younossi ZM, Stepanova M, Ong J, Trimble G, Alqahtani S, Younossi I, et al. Nonalcoholic steatohepatitis is the most rapidly increasing indication for liver transplantation in the United States. Clin Gastroenterol Hepatol. 2021;19:580–9.e5. 10.1016/j.cgh.2020.05.064 - DOI - PubMed
    1. Francque SM, van der Graaff D, Kwanten WJ. Non-alcoholic fatty liver disease and cardiovascular risk: pathophysiological mechanisms and implications. J Hepatol. 2016;65:425–43. 10.1016/j.jhep.2016.04.005 - DOI - PubMed
    1. Ratziu V, Francque S, Sanyal A. Breakthroughs in therapies for NASH and remaining challenges. J Hepatol. 2022;76:1263–78. 10.1016/j.jhep.2022.04.002 - DOI - PubMed

Substances