. 2024 Jul 25;148(1):11.
doi: 10.1007/s00401-024-02770-6.

High throughput spatial immune mapping reveals an innate immune scar in post-COVID-19 brains

Affiliations

High throughput spatial immune mapping reveals an innate immune scar in post-COVID-19 brains

Marius Schwabenland et al. Acta Neuropathol. .

Abstract

The underlying pathogenesis of neurological sequelae in post-COVID-19 patients remains unclear. Here, we used multidimensional spatial immune phenotyping and machine learning methods on brains from initial COVID-19 survivors to identify the biological correlate associated with previous SARS-CoV-2 challenge. Compared to healthy controls, individuals with post-COVID-19 revealed a high percentage of TMEM119+P2RY12+CD68+Iba1+HLA-DR+CD11c+SCAMP2+ microglia assembled in prototypical cellular nodules. In contrast to acute SARS-CoV-2 cases, the frequency of CD8+ parenchymal T cells was reduced, suggesting an immune shift toward innate immune activation that may contribute to neurological alterations in post-COVID-19 patients.

Keywords: COVID-19; Imaging mass cytometry; Long-COVID; Microglia; Neuro-long-COVID-19; PACS; PCC; Post-COVID condition; Post-acute COVID syndrome; SARS-CoV-2.


Conflict of interest statement

The authors declare no competing interests.

Figures
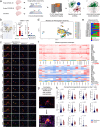
Fig. 1
Fig. 1
Innate rather than adaptive immune activation in defined compartments of post-COVID-19 brains. a Experimental workflow. Autopsy tissue slices from the upper medulla of 15 initial COVID-19 survivors with SARS-CoV-2-unrelated causes of death (post-COVID-19), 11 acute COVID-19 and 4 SARS-CoV-2 naïve control patients were analyzed by comprehensive neuropathological analyses. CyTOF cytometry by time of flight. b Left: representative immunohistochemistry for CD8a (brown) in the upper medulla oblongata of controls, acute COVID-19 patients (cells are highlighted by arrow heads) and post-COVID-19 patients. Counterstaining with haematoxylin. Scale bar: 100 µm. Middle: quantification thereof. Each symbol represents one patient. Bars represent means ± SEM. P values were determined using Brown-Forsythe and Welsh ANOVA test with Dunnett’s T3 multiple comparisons test. Right: T-cell numbers over different time points post-infection. Acute COVID-19 patients and controls are shown at 0 months post-infection. Each symbol represents one patient. Green line indicates the mean of controls. c Representative images depicting imaging mass cytometry of the medulla oblongata of three post-COVID-19 patients and one age-matched control. Scale bar: 100 µm. d UMAP visualization shows Phenograph clustering of myeloid cells in post-COVID-19 brains. Myeloid cells from both the frontal cortex and the upper medulla oblongata were analyzed. e Mosaic plot representing the contribution of identified myeloid cell clusters to each control, acute COVID-19, and post-COVID-19 brain samples. Myeloid cells from the frontal cortex and the upper medulla oblongata were analyzed. f Heatmaps visualizing the protein expression profiles of the different myeloid clusters. One column represents the normalized expression of one cell in the upper panel. In the lower panel, the mean expression per cluster is shown. g Representative visualization of the microglia nodule index calculated based on Iba1 signal across a 15 µm radius. A threshold of 0.5 was applied for the compartmentalization into parenchymal and nodule-associated myeloid cells. h Violin plots depicting the normalized expression of the indicated markers on Iba1+ myeloid cells in the parenchymal (blue) and subtissular nodule compartment (red) in the medulla of post-COVID-19 individuals. Student’s t test was applied. P values are indicated. Each symbol represents one cell
Fig. 2
Fig. 2
Persistent activation of microglia characterizes the CNS of post-COVID-19 patients. a Representative immunohistochemistry for Iba1 (brown) depicting typical microglial nodules (asterisks) in various medulla oblongata samples from post-COVID-19 and control brain samples. Counterstaining with haematoxylin (blue). Scale bars: 100 µm. b Left: quantification of microglia nodules in the medulla of controls, acute COVID-19 and post-COVID-19 patients. P values were determined using Brown–Forsythe and Welsh ANOVA test with Dunnett’s T3 multiple comparisons test. Bars represent means ± SEM. Each symbol represents one patient. Right: quantification thereof. Acute COVID-19 patients and controls are plotted at the 0 month time point. Green line indicates the mean of controls. c Left: illustrative picture of amyloid precursor protein (APP, brown) immunohistochemistry for axonal damage in the upper medulla. Counterstaining with haematoxylin. Scale bar: 100 µm. Arrows indicate APP+ deposits. Right: quantification of APP deposition. Each symbol represents one patient. Bars represent means ± SEM. Brown–Forsythe and Welsh ANOVA test with Dunnett’s T3 multiple comparisons test were performed. P values are shown. d Left: typical immunohistochemistry for alpha-synuclein (brown) in the brain stems of controls, Parkinson’s disease patients (used as control), and post-COVID-19 patients. Scale bar: 100 µm. Arrows indicate alpha-synuclein deposits. Right: quantification thereof. Each symbol represents one patient. Bars represent means ± SEM. Ordinary one-way ANOVA with Tukey’s multiple comparisons test was applied. P values are shown. e Protein levels of soluble YKL-40, TREM2, CD14, and neurofilament light chain (NF-light) measures by enzyme-linked immunosorbent assay (ELISA) in cerebrospinal fluid samples of Neuro-Long-COVID-19 patients and Post-COVID controls are shown. Each symbol represents one patient. Linear regression lines for each group are depicted. f Heatmap depicting CSF metabolites measured by targeted metabolomics. Colors indicate Spearman correlations of cerebrospinal fluid metabolites. Significance levels are indicated by asterisks (*P < 0.05, **P < 0.01, ***P < 0.001). Boxes show an adjusted FDR < 0.05

References

    1. Boettler T, Csernalabics B, Salie H, Luxenburger H, Wischer L, Salimi Alizei E et al (2022) SARS-CoV-2 vaccination can elicit a CD8 T-cell dominant hepatitis. J Hepatol 77:653–659. 10.1016/j.jhep.2022.03.040 10.1016/j.jhep.2022.03.040 - DOI - PMC - PubMed
    1. Bowe B, Xie Y, Al-Aly Z (2023) Postacute sequelae of COVID-19 at 2 years. Nat Med 29:2347–2357. 10.1038/s41591-023-02521-2 10.1038/s41591-023-02521-2 - DOI - PMC - PubMed
    1. Cervia-Hasler C, Bruningk SC, Hoch T, Fan B, Muzio G, Thompson RC et al (2024) Persistent complement dysregulation with signs of thromboinflammation in active Long Covid. Science 383:eadg7942. 10.1126/science.adg7942 10.1126/science.adg7942 - DOI - PubMed
    1. Davis HE, Assaf GS, McCorkell L, Wei H, Low RJ, Re’em Y et al (2021) Characterizing long COVID in an international cohort: 7 months of symptoms and their impact. EClinicalMedicine 38:101019. 10.1016/j.eclinm.2021.101019 10.1016/j.eclinm.2021.101019 - DOI - PMC - PubMed
    1. Douaud G, Lee S, Alfaro-Almagro F, Arthofer C, Wang C, McCarthy P et al (2022) SARS-CoV-2 is associated with changes in brain structure in UK Biobank. Nature 604:697–707. 10.1038/s41586-022-04569-5 10.1038/s41586-022-04569-5 - DOI - PMC - PubMed

Publication types