. 2024 Sep;25(9):1678-1691.
doi: 10.1038/s41590-024-01902-0. Epub 2024 Jul 26.

A TNIP1-driven systemic autoimmune disorder with elevated IgG4

Affiliations

A TNIP1-driven systemic autoimmune disorder with elevated IgG4

Arti Medhavy et al. Nat Immunol. 2024 Sep.

Abstract

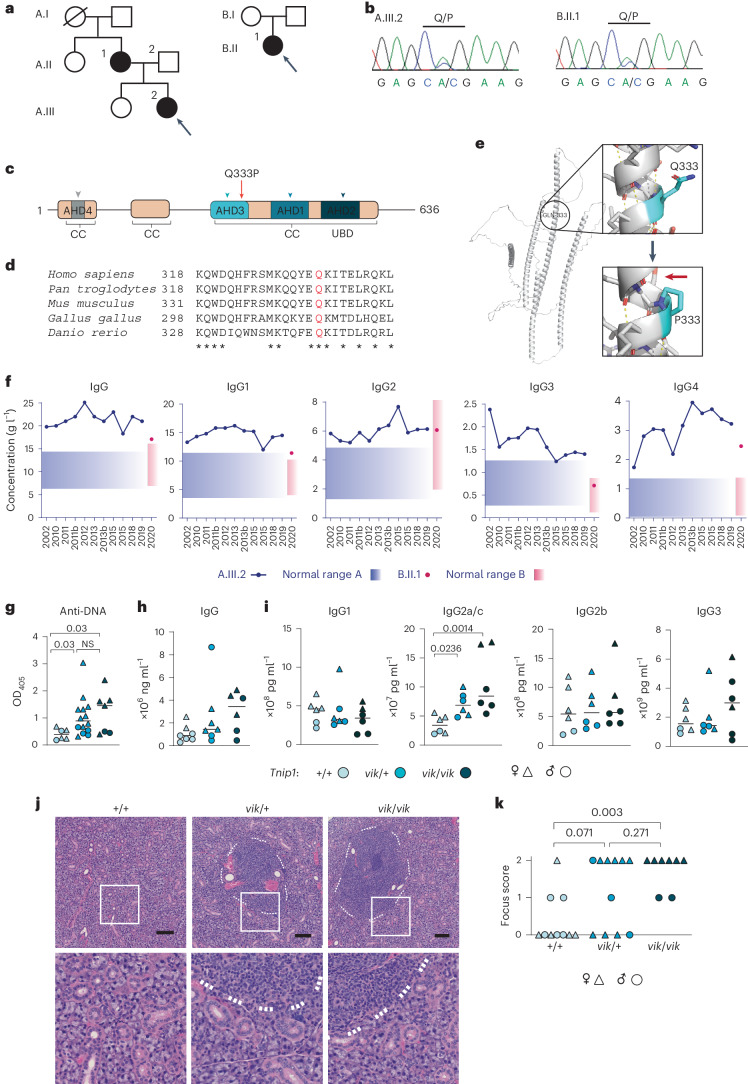
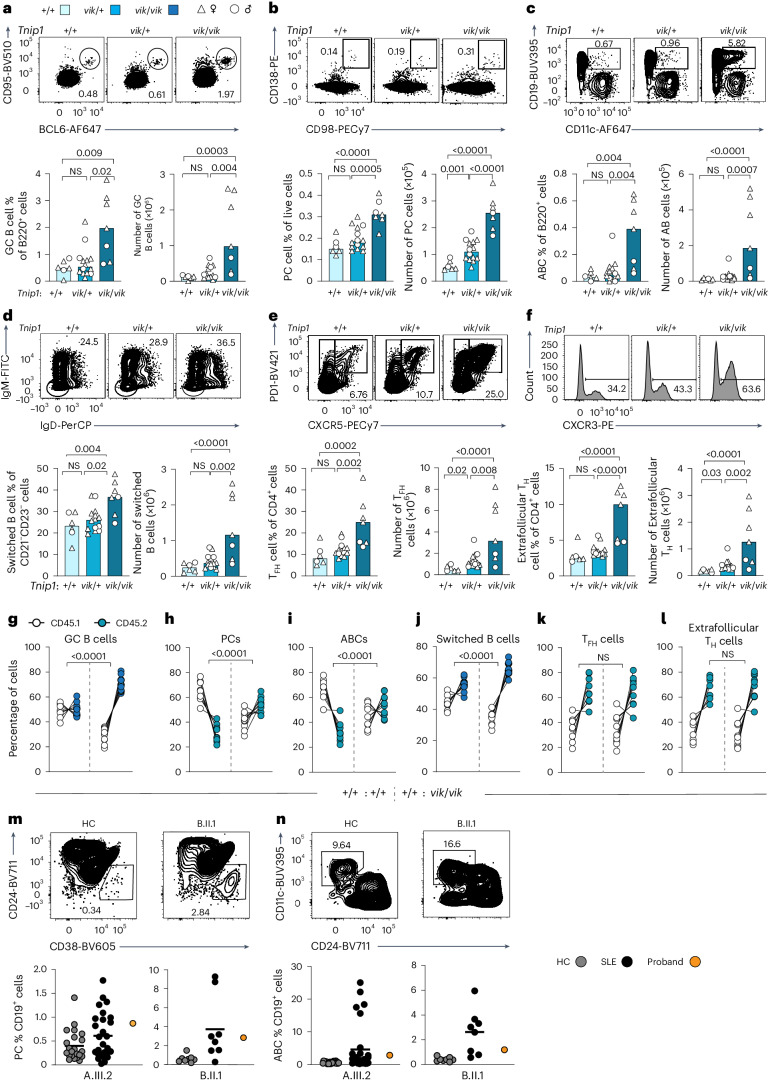
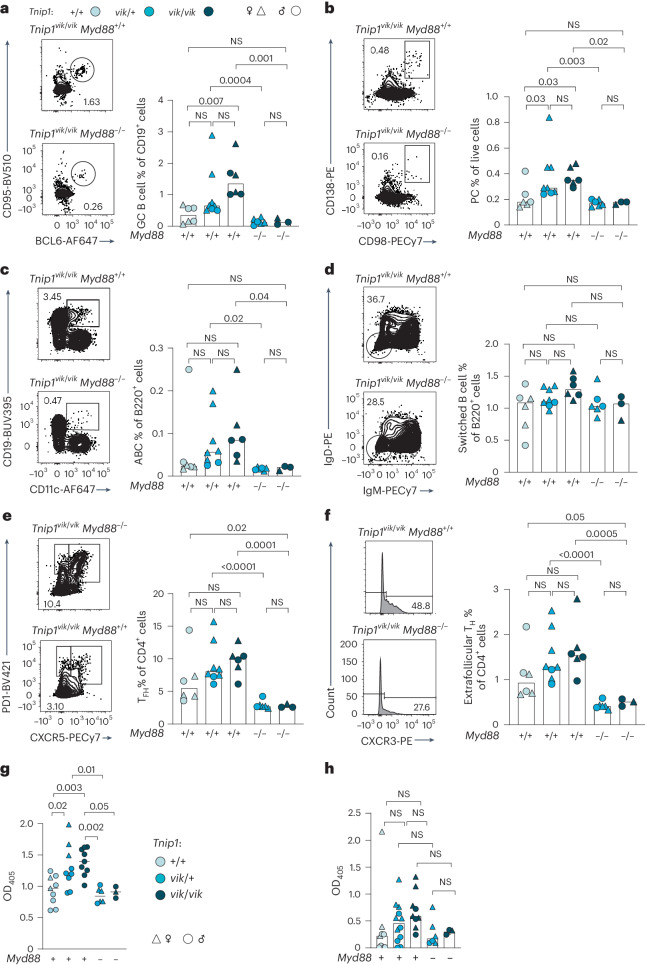
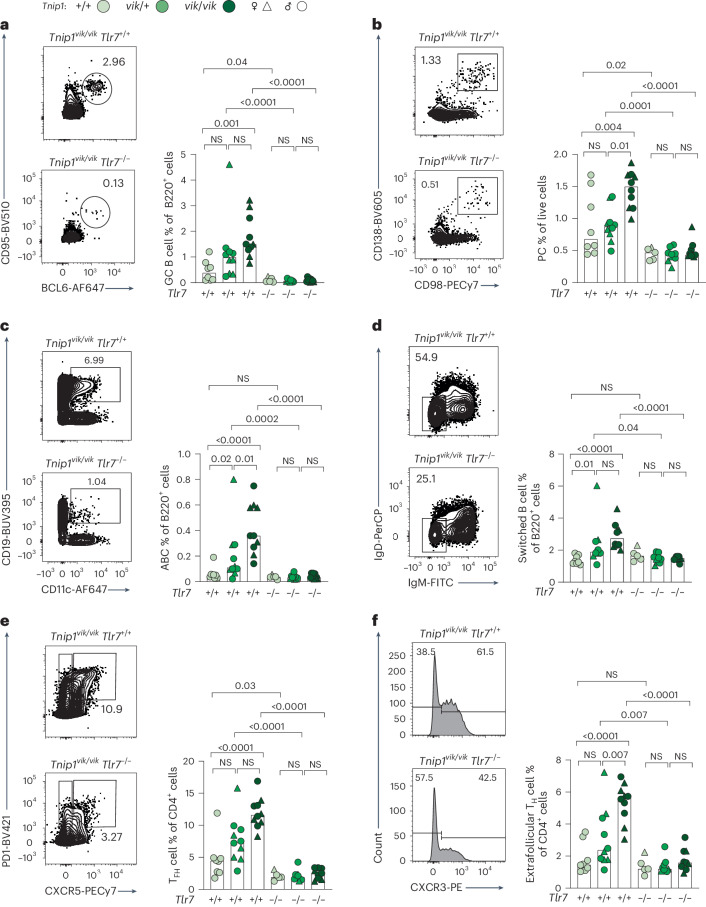
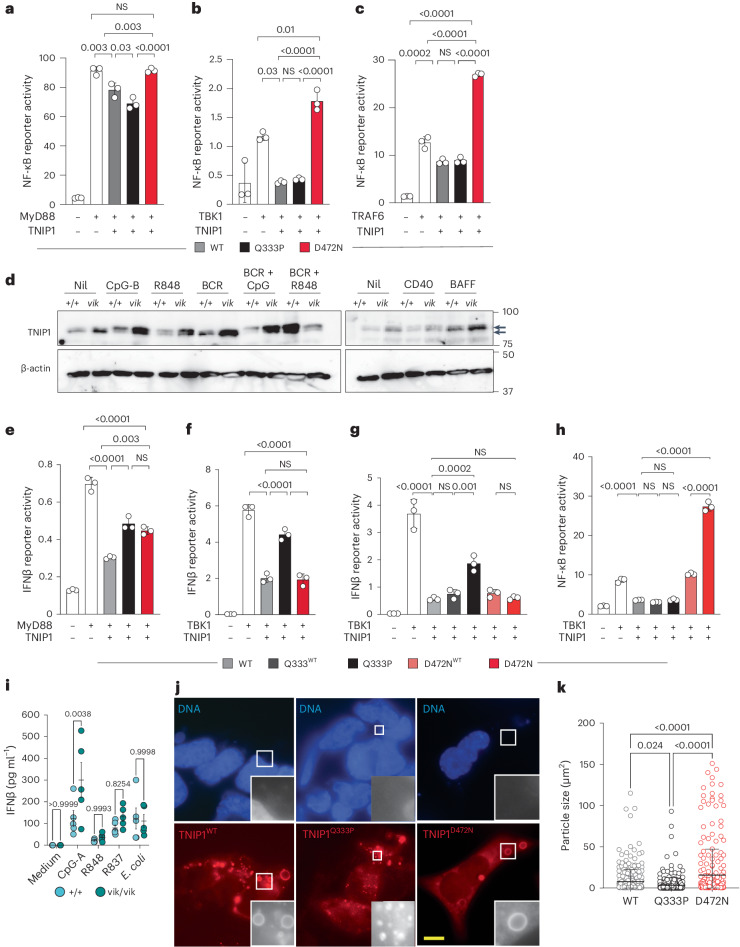
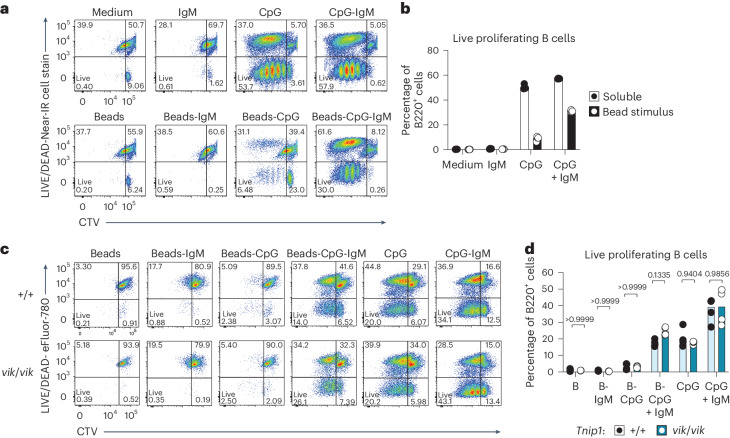
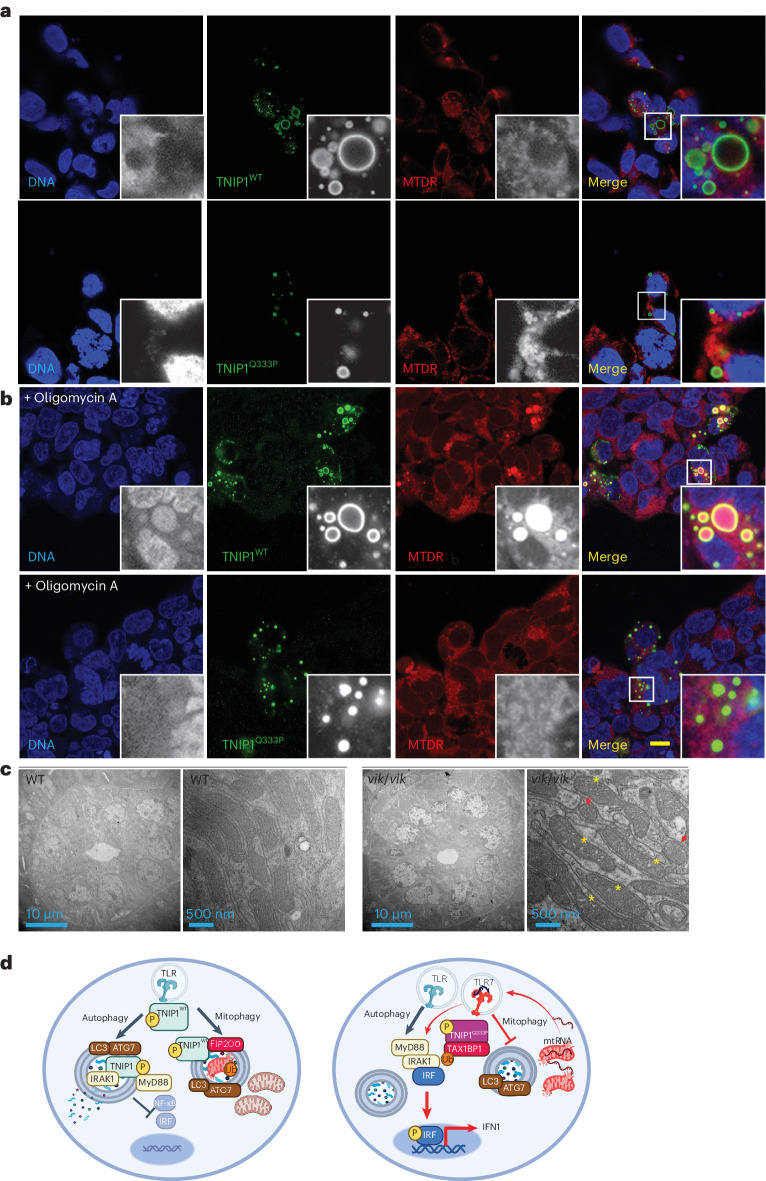
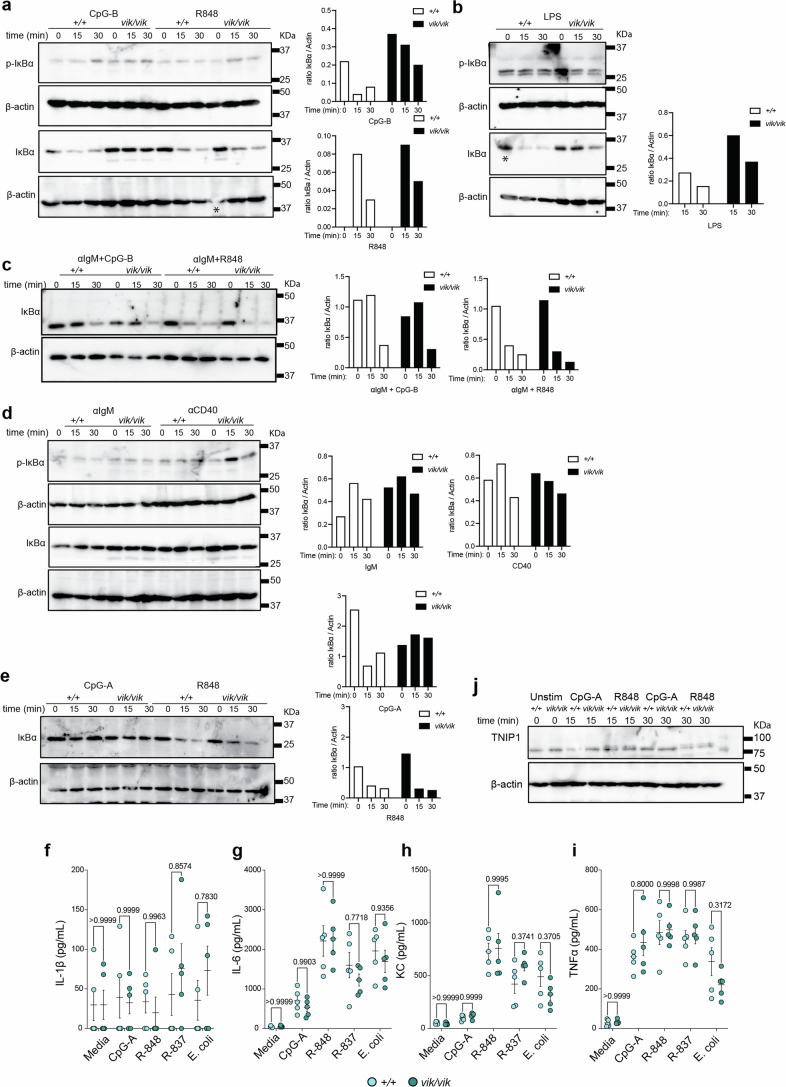
Whole-exome sequencing of two unrelated kindreds with systemic autoimmune disease featuring antinuclear antibodies with IgG4 elevation uncovered an identical ultrarare heterozygous TNIP1Q333P variant segregating with disease. Mice with the orthologous Q346P variant developed antinuclear autoantibodies, salivary gland inflammation, elevated IgG2c, spontaneous germinal centers and expansion of age-associated B cells, plasma cells and follicular and extrafollicular helper T cells. B cell phenotypes were cell-autonomous and rescued by ablation of Toll-like receptor 7 (TLR7) or MyD88. The variant increased interferon-β without altering nuclear factor kappa-light-chain-enhancer of activated B cells signaling, and impaired MyD88 and IRAK1 recruitment to autophagosomes. Additionally, the Q333P variant impaired TNIP1 localization to damaged mitochondria and mitophagosome formation. Damaged mitochondria were abundant in the salivary epithelial cells of Tnip1Q346P mice. These findings suggest that TNIP1-mediated autoimmunity may be a consequence of increased TLR7 signaling due to impaired recruitment of downstream signaling molecules and damaged mitochondria to autophagosomes and may thus respond to TLR7-targeted therapeutics.


Conflict of interest statement

The authors declare no competing interests.

Figures

Fig. 1
Fig. 1. Orthologous TNIP1 missense variant in patients and mice with systemic autoimmunity.
a,b, TNIP1Q333P variant in families (a) and results from Sanger sequencing (b). c, Position of the Q333P variant within the TNIP1 protein domains. d, Conservation across species. e, AlphaFold2-generated structure of canonical TNIP1 (AF-Q15025-F1) as modeled in PyMOL. Residue 333 is indicated in blue. The red arrow indicates the P333-disrupted hydrogen bonding in the alpha-helix 4 backbone f, Patient immunoglobulin IgG concentrations compared to the ‘normal’ population ranges (shaded boxes) as defined by the Canberra Hospital (Australia) and Renji Hospital (Shanghai, China) pathology laboratories, respectively. g, Serum antibodies to DNA from 20–28-week-old male (n = 8) and female (n = 19) vikala mice; Tnip1+/+ (n = 6), Tnip1vik/+ (n = 14) and Tnip1vik/vik (n = 7) mice by enzyme-linked immunosorbent assay (ELISA). Optical density at 405 nm (OD405). h, Total serum IgG in 12-week-old male (n = 10) and female (n = 10) vikala mice by ELISA; Tnip1+/+ (n = 7), Tnip1vik/+ (n = 7) and Tnip1vik/vik (n = 6). Each point represents a mouse (biological replicate). i, Meso Scale Discovery readout for IgG subclasses (pg ml−1) in 20–22-week-old male (n = 9) and female (n = 9) vikala mice; Tnip1+/+ (n = 6), Tnip1vik/+ (n = 6) and Tnip1vik/vik (n = 6); each point represents a mouse (biological replicate). j, H&E staining showing lymphocytic infiltrates in the submandibular salivary glands of 20–28-week-old vikala mice; Tnip1+/+ (n = 10), Tnip1vik/+ (n = 11) and Tnip1vik/vik (n = 8). Scale bar, 100 μm. k, Focus score indicating the severity of lymphocytic infiltration per tissue section; each dot represents a mouse (biological replicate). Infiltrates are defined as foci consisting of 50 or more mononuclear cells. Scores: 0, no infiltrates; 1, one focal infiltrate; 2, multiple focal infiltrates. The medians are indicated by the black line, the mouse sex is indicated by the symbol type (gi,k). In g,h,j, data are representative of n = 2 experiments. Data in i was from an experiment performed once; scoring in k was performed once. Statistical significance was calculated using a one-way analysis of variance (ANOVA) with multiple comparisons using a Tukey test after log-transformation of the data. Exact P values are shown. NS, not significant. Source data
Fig. 2
Fig. 2. Vikala mice develop cell-intrinsic expansion of activated B and T immune cell subsets.
af, Flow cytometry plots and quantification of splenocytes from 22–28-weeks-old male (n = 8) and female (n = 19) vikala mice; Tnip1+/+ (n = 6), Tnip1vik/+ (n = 14) and Tnip1vik/vik (n = 7): GC B cells (CD19+CD95+BCL6+) (a); PCs (CD138+CD98+) (b); ABCs (B220+CD21CD23CD19highCD11c+) (c); switched B cells (B220+CD21CD23IgDIgM) (d); TFH cells (CD4+CXCR5+PD1high) (e); and extrafollicular TH cells (CD4+CXCR5PD1+CXCR3+) (f). gl, Splenic phenotypes of 26–30-week-old chimeric mice 16 weeks after reconstitution with a 1:1 ratio of control Tnip1+/+ CD45.1:Tnip1+/+ CD45.2 (n = 7) or Tnip1+/+ CD45.1:Tnip1vik/vik CD45.2 (n = 8) BM cells. All irradiated Rag-/- recipient mice were female. g, GC B cells. h, PCs. i, ABCs. j, Switched B cells. k, TFH cells. l, Extrafollicular TH cells. m,n, Representative flow cytometry plots and quantification of the PC (m) and ABC (n) phenotype in PBMCs from A.III.2 or B.II.1, healthy controls (n = 23, n = 8) and individuals with SLE (n = 27, n = 8), respectively. The bars in af or the black lines in m,n represent the median values; each dot represents an individual mouse or human blood donor (biological replicate). In af, data are representative of n = 2 experiments. In gn, data are from experiments performed once. Statistical analysis was performed using a one-way ANOVA with Tukey’s correction for multiple comparisons (af) and a two-way ANOVA (gl). Exact P values are shown. Source data
Fig. 3
Fig. 3. TNIP1-driven cellular phenotypes are dependent on MyD88 signaling.
a–f, Representative flow cytometry plots and proportions of splenocytes from male (n = 12, dots) and female (n = 17, triangles) vikala mice aged 16–20 weeks: GC B cells (CD19+CD95+BCL6+) (a); PCs (CD138+CD98+) (b); ABCs (B220+CD21CD23CD19highCD11c+) (c); switched B cells (B220+CD21CD23IgDIgM) (d); TFH cells (CD4+CXCR5+PD1high) (e); and extrafollicular TH cells (CD4+CXCR5PD1+CXCR3+) (f), either competent or deficient in Myd88. Tnip1+/+ (n = 6), Tnip1vik/+ (n = 8), Tnip1vik/vik (n = 6), Tnip1vik/+ Myd88−/− (n = 6) and Tnip1vik/vik Myd88−/− (n = 3). The bars represent the median values; each point represents an individual mouse (biological replicate). g, serum IgG2c antibodies in 16–20-week-old vikala mice either competent or deficient in Myd88; Tnip1+/+ (n = 9), Tnip1vik/+ (n = 9), Tnip1vik/vik (n = 9), Tnip1vik/+ Myd88−/− (n = 6) and Tnip1vik/vik Myd88−/− (n = 3). The black lines represents the median; each point represents an individual mouse (biological replicate); sex is indicated by the respective symbol. h, Serum antibodies to DNA (ANAs) in 16–20-week-old vikala mice either competent or deficient in Myd88; Tnip1+/+ (n = 8), Tnip1vik/+ (n = 12), Tnip1vik/vik (n = 9), Tnip1vik/+ Myd88−/−(n = 6) and Tnip1vik/vik Myd88−/− (n = 3). The bars represent the median; each point represents an individual mouse (biological replicate). In af, data are representative of n = 2 independent experiments. In g,h, data are from experiments performed once. Statistical significance was performed using a one-way ANOVA with Tukey’s correction for multiple comparison after log-transformation of data. Exact P values are shown. Source data
Fig. 4
Fig. 4. TNIP1-driven cellular phenotypes are dependent on TLR7 signaling.
af, Representative flow cytometry plots and proportions of splenocytes from male (n = 34, dots) and female (n = 17, triangles) vikala mice aged 20–30 weeks: GC B cells (CD19+CD95+BCL6+) (a); PCs (CD138+CD98+) (b); ABCs (B220+CD21CD23CD19highCD11c+) (c); switched B cells (B220+CD21CD23IgDIgM) (d); TFH cells (CD4+CXCR5+PD1high) (e); and extrafollicular TH cells (CD4+CXCR5PD1+CXCR3+) (f) either competent or deficient in Tlr7; Tnip1+/+ (n = 8), Tnip1vik/+ (n = 10), Tnip1vik/vik (n = 10), Tnip1vik/+ Tlr7−/− (n = 9), Tnip1vik/vik Tlr7−/− (n = 9) and Tnip1+/+ Tlr7−/− (n = 5). The bars represent the median values; each symbol represents an individual mouse (biological replicate). Data are representative of n = 2 independent experiments. Statistical significance was performed using a one-way ANOVA with Tukey’s correction for multiple comparisons after log-transformation of the data. Exact P values are shown. Source data
Fig. 5
Fig. 5. TNIP1Q333P regulates NF-κB signaling but not IFNβ and alters the size of TNIP1 puncta.
ac, NF-κB activity (ratio of NF-κB firefly to Renilla luciferase in relative light units) 24 h after lipofectamine transfection of human TNIP1 plasmids (WT, Q333P and D472N) into HEK 293 cells cotransfected with MyD88 (a), TBK1 (b) and TRAF6 (c). Data are shown as the mean and s.d. of n = 3 biological replicates or transfections, shown as individual dots and representative of three independent experiments (ac). d, Immunoblots (IBs) of splenic B cell lysates from 20-week-old WT (+/+) and vikala homozygote (vik/vik) mice probed for TNIP1 and actin proteins after stimulation with CpG-B, R848, BCR (αIgM), BCR and CpG-B, BCR and R848, CD40 and BAFF. Data are representative of two independent experiments. eh, IFNβ (eg) and NF-κB (h) activity (ratio of IFNβ or NF-κB firefly to Renilla luciferase in relative light units) 24 h after lipofectamine transfection with human TNIP1 plasmids (WT, Q333P and D472N) into HEK 293 cells cotransfected with MyD88 (e) or TBK1 (fh). Data are shown as the mean and s.d. of n = 3 biological replicates or transfections shown as individual dots and representative of three independent experiments (eh). Statistical significance was calculated using a one-way ANOVA with Tukey’s correction for multiple comparisons (ac,eh). Exact P values are shown. i, ELISA-determined serum levels of IFNβ protein from vikala BM-pDCs; Tnip1+/+ (n = 5) and Tnip1vik/vik (n = 5), untreated or stimulated with CpG-A, R848, R837 and Escherichia coli. Data are representative of three experiments. The error bars indicate the mean with the s.e.m.; each dot represents a single mouse (biological replicate). j, Immunofluorescence staining of HEK 293 cells expressing TNIP1WT, TNIP1Q333P or TNIP1D472N. k, Quantification of WT (n = 301), Q333P (n = 305) and TNIP1D472N (n = 268) mean particle size. Scale bar, 10 μm. Data are representative of n = 3 independent experiments. Statistical significance was performed using a two-way ANOVA with Šidák’s correction for multiple comparisons (i) and a one-way ANOVA with Tukey’s correction for multiple comparisons (k). The error bars indicate the mean with the s.d. Exact P values are shown. Source data
Fig. 6
Fig. 6. TNIP1Q333P has impaired colocalization with the autophagosome markers ATG7, MyD88 and IRAK1.
a,b,d, Immunofluorescence staining of HEK 293 cells expressing TNIP1WT, TNIP1Q333P or TNIP1D472N (red) and ATG7 (green) (a), or MyD88 (b) or IRAK1 (d) (green). DNA was stained with 4′,6-diamidino-2-phenylindole (DAPI). Scale bar, 10 μm. Data are representative of n = 3 (a,b) or n = 2 (d) independent experiments. Scale bar, 10 μm. c, Quantification of the percentage of TNIP1WT, TNIP1Q333P and TNIP1D472N-expressing cells showing localization (black bar) or lack of localization (white bar) with MyD88 within puncta. Data are from one experiment of n = 21 (WT), n = 32 (Q333P) and n = 35 (D472N). TNIP1-expressing cells were imaged. In c, data are representative of n = 3 independent experiments. e, Anti-TNIP1 or anti-MyD88 IBs of overexpressed and immunoprecipitated TNIP1WT, TNIP1Q333P or MyD88 in HEK 293T cells. In e, data are representative of n = 2 independent experiments. WCE, whole-cell extract. Source data
Fig. 7
Fig. 7. Vikala B cells do not have a statistically significant survival advantage to synergistic BCR–TLR9 stimulation.
ab, Representative flow cytometry plots (a) and proportions (b) of live purified WT B220+ B cells cultured from 8-week-old Tnip1+/+ (n = 1) mice with soluble or bead-conjugated IgM or CpG (ODN 1826) for 72 h; each dot represents a technical replicate. c,d, Representative flow cytometry plots (c) and proportions (d) of live B220+ B cells from 6–12-week-old Tnip1+/+ (n = 4) and Tnip1vik/vik (n = 4) mice cultured with bead-conjugated IgM or CpG (ODN 1826) for 72 h; each dot represents an individual mouse (biological replicate). Statistical significance was calculated using a two-way ANOVA with Šidák’s crrection for multiple comparisons. Exact P values are shown. In ad, data are representative of n = 2 experiments. Source data
Fig. 8
Fig. 8. TNIP1Q333P mitophagosome recruitment of TNIP1 and mitochondria.
a,b, Immunofluorescence staining of HEK 293 cells overexpressing TNIP1WT or TNIP1Q333P (green) stained with Mitotracker Deep Red without treatment (a) or treated with 10 μM oligomycin A for 2 h (b) (red). Cells treated with oligomycin A for 2 h are labeled. Scale bar, 10 μm. Data are representative of n = 2 experiments. c, Representative electron micrographs of submandibular salivary gland ultrathin sections from n = 1 WT and n = 2 homozygous 16-week-old vikala female mice. The red arrowheads indicate swollen mitochondria and the yellow asterisks disorganized cristae. d, Schematic of the proposed model of the molecular impact of Q333P on TNIP1 function. On TLR ligation, TNIP1WT is activated and recruited to ATG7-LC3B+ autophagosomes where it recruits the Myddosome leading to degradation of some of the components and dampening of the signal. Q333P impairs recruitment to autophagosomes and to MyD88. In addition, mitophagy stimulation activates recruitment of TNIP1WT and selective autophagy receptors, such as TAX1BP1, to sequester damaged and ubiquitinylated mitochondrial components. The interaction probably occurs via the ADH3 domain of TNIP1. Q333P impairs mitophagosome recruitment of TNIP1 and may impact clearance of damaged mitochondria, leading to cytosolic release of mitochondrial damage-associated molecular patterns, mitochondrial RNA or DNA, and activation of the innate TLR7 or TLR9 receptors. The schematic was created with BioRender.com. mtRNA, mitochondrial RNA. Source data
Extended Data Fig. 1
Extended Data Fig. 1. Ultrarare TNIP1Q333P variant absent in unaffected family members and predicted to be damaging to TNIP1 function.
a, GnomAD global frequencies of TNIP1 variant in different populations and sexes. b, Variant pathogenicity prediction outputs for TNIP1Q333P. c, Integrative Genomics Viewer (IGV) image of the TNIP1Q333P missense variant. d, Sequencing chromatogram validating Tnip1Q346P mutation in the CRISPR/Cas9 generated vikala founder mouse.
Extended Data Fig. 2
Extended Data Fig. 2. Anti-DNA antibodies increase with age but do not cause glomerulonephritis or splenomegaly in vikala mice.
a, b, Serum antibodies to DNA from 12 week-old vikala mice. OD405, optical density at 405 nm, bars represent the mean values and each point represents a mouse (a) and comparison of relative optical densities at 10 and 24 week-old mice (b). OD405, optical density at 405 nm. (b). c, Hep-2 immunofluorescence showing ANA staining patterns in 12-week-old Tnip1vik/vik mice. Scale bars represent 50 μm. d, Glomerular and interstitial damage scores assessed from hematoxylin and eosin (H&E) stained kidney sections from vikala mice; Tnip1+/+ (n = 10), Tnip1vik/+(n = 9), Tnip1vik/vik (n = 9) at 20–28 weeks of age. Means indicated by black line, each point represents a mouse. e, Representative H&E stained vikala kidney tissue scored in panel d; upper panel shows one representative image of kidney tissue from Tnip1+/+ (n = 10), Tnip1vik/+(n = 9), Tnip1vik/vik (n = 9); lower panel shows an expanded view of the region enclosed in white, featuring glomeruli. Scale bars represent 50 μm, original magnification 20x. f, g, mean spleen weight and total cellularity of 12 week-old (Tnip1+/+ (n = 5), Tnip1vik/+(n = 6), Tnip1vik/vik (n = 6) (f), and 24 week-old mice Tnip1+/+ (n = 6), Tnip1vik/+(n = 7), Tnip1vik/vik (n = 6) (g), respectively; each dot represents a mouse (biological replicate) and error bars indicate SD. Sexes are indicated by symbol type. Data representative of n = 2 (a, f-g). Data in panel (b-e) are from experiments performed once. Statistical significance was performed using one-way ANOVA with Tukey multiple-comparison test following log-transformation of data (a, d,f-g) and two-way ANOVA with Sidak’s multiple comparison test (b). Exact P values are shown. Source data
Extended Data Fig. 3
Extended Data Fig. 3. Myd88 and Tlr7 deficiency rescues abnormal total splenocyte phenotypes in vikala mice.
a-f, Flow cytometric quantification of proportion and total numbers of activated CD4 T cells (CD3+CD4+CD44+Foxp3-) (a); and T regulatory cells (Treg; CD3+CD4+CD44+Foxp3+) (b) from 20–28 week-old vikala mice Tnip1+/+ (n = 10), Tnip1vik/+(n = 11), Tnip1vik/vik (n = 9); T follicular regulatory cells (Tfr; CD4+PD1+CXCR5+Foxp3+) (c) from 22–28 week-old vikala mice; Tnip1+/+(n = 6), Tnip1vik/+(n = 14) and Tnip1vik/vik (n = 7); plasmacytoid dendritic cells (pDCs; CD3CD19CD8CD11c+CD11b-SiglecH+BST2+) (d) from 20 week-old vikala mice (Tnip1+/+ (n = 8), Tnip1vik/+(n = 8), Tnip1vik/vik (n = 8); and granulocytes (Ly6C+ Ly6G+CD11b+) and monocytes (CD11c-CD11b+Ly6G-) from 20–28 week-old vikala mice (Tnip1+/+ (n = 10), Tnip1vik/+(n = 11), Tnip1vik/vik (n = 9) (e-f). g-h, Flow cytometric quantification of splenic cell subsets (total number) in 16–20 or 20–30 week-old vikala mice either competent or deficient in MyD88 (g) and Tlr7 (h), respectively. Subsets from left to right; germinal center B cells (GCs; CD19+CD95+BCL6+); age associated B cells (ABC; B220+CD21CD23CD19highCD11c+), plasma cells (PC; CD138+CD98+), T follicular helper cells (Tfh; CD4+CXCR5+PD1high), extrafollicular helper T cells (eTH; CD4+CXCR5PD1+CXCR3+), and switched B cells (B220+CD21CD23IgDIgM). Bars represent the median values, and each dot represents an individual mouse (biological replicate) with males and females represented by circles and triangles, respectively (a-h). Data presented in a-b and e-f are all from the same experimental cohort of 20–28 week old vikala mice. Data presented in c and d are each from separate experimental cohorts of 20-week-old and 22–28-week-old vikala mice, respectively. a-h, Results are representative n = 2 experiments. P values were determined by one-way ANOVA with Tukey's test for three-way comparisons following log-transformation of data. ns, not significant. Source data
Extended Data Fig. 4
Extended Data Fig. 4. NF-κB-dependent signaling and cytokine secretion from splenocytes and bone marrow derived pDCs is not increased in vikala mice.
a-d, Immunoblots of splenic B cell lysates from Tnip1+/+ (n=1) and Tnip1vik/vik (n=1) mice probed for TNIP1, IκBα and Actin proteins after stimulation with CpG-B, R848 (a), LPS (b), BCR+CpG-B, BCR+R848 (c), BCR (αIgM) and CD40 (d). B cells from 40-week (a, d), 10–12-week (b), and 28–29-week old mice (c). (Densitometric ratio of IκBα to Actin loading control in stimulated wildtype (+/+) and vikala homozygote (vik/vik) B cells shown (right) (a-d). Asterisks indicate poor quality bands that were prohibitive to accurate quantification. e, j, Immunoblots of bone marrow derived pDCs from 16–20 week-old Tnip1+/+ (n=1) and Tnip1vik/vik (n=1) mice probed for IκBα (e), TNIP1 (j) and Actin proteins after stimulation with CpG-A and R848. Densitometric ratio of IκBα to Actin loading control shown (e). f-i, Bone marrow derived pDCs from 16–20 week-old Tnip1+/+ (n=1) and Tnip1vik/vik (n=1) mice were seeded in 96 well plates and treated with either CpG-A, R848, R837 or infected with E.coli. Supernatants were harvested for quantification by ELISA at 6 h (f-i) post treatment. Bars represent means with standard error of the mean (SEM) and each dot a single mouse (biological replicate). Two-way ANOVA with Sidak’s multiple comparisons; ns, not significant. Data in panels (a-e, j) are representative of experiments performed twice and (f-i) from experiments performed three times. Source data
Extended Data Fig. 5
Extended Data Fig. 5. TNIP1Q333P localization with signaling partners and Myddosome component turnover.
a–h, Immunofluorescence on HEK293 cells for TNIP1 and p62 (green; a), TRAF6 (red; b), A20 (red; c), TAX1BP1 (red, d), LAMP1 (green; e) EEA1 (green; f), RAB7 (green; g) and LC3B (red; h). Scale bars represent 10 μm. Images are representative of n = 3 (b), n = 2 (a, c-f, h) and n = 1 (g) independent experiments. i-j, Immunoblotting of TNIP1 (i), IRAK1 and MYD88 (j) protein in Tnip1+/+ and Tnip1vik/vik BMDMs treated with LPS (100 ng/mL) and Bafilomycin A1 (100 nM) for 2 h. Densitometric plots showing levels of each protein relative to the loading control are shown (right). Data representative of n = 2 (i-j) experiments. Source data
Extended Data Fig. 6
Extended Data Fig. 6. Q333P impairs mitophagosome recruitment of TNIP1 with TOM20+ mitochondria.
a, Immunofluorescence staining of HEK293 cells overexpressing TAX1BP1, TOM20 (green) and TNIP1 (red). b, Immunofluorescence staining of HEK293 cells overexpressing TNIP1 (red) and IRGM1 (green). DNA is stained with DAPI in blue. Panels showing cells treated with 10 μM oligomycin A for 2 h are indicated (a). Scale bars represent 10 μm. Images are representative of n = 3 (a) and n = 2 (b) independent experiments with >20 transfected cells per experiment for (a) and 10–15 transfected cells per experiment for (b). Source data
Extended Data Fig. 7
Extended Data Fig. 7. Salivary gland epithelial cells from homozygous vikala mice develop damaged mitochondria.
a, Representative electron micrographs of submandibular salivary gland ultrathin sections from Tnip1+/+ (n = 1) and Tnip1vik/vik (n = 2) 16-week-old vikala female mice. White asterisks indicate clearings indicative of mitochondrial membrane damage. Scale bars represent 1 μm. Source data

References

    1. Ellyard, J. I. et al. Identification of a pathogenic variant in TREX1 in early-onset cerebral systemic lupus erythematosus by whole-exome sequencing. Arthritis Rheumatol.66, 3382–3386 (2014). 10.1002/art.38824 - DOI - PubMed
    1. Brown, G. J. et al. TLR7 gain-of-function genetic variation causes human lupus. Nature605, 349–356 (2022). 10.1038/s41586-022-04642-z - DOI - PMC - PubMed
    1. Xu, L. et al. Loss-of-function variants in SAT1 cause X-linked childhood-onset systemic lupus erythematosus. Ann. Rheum. Dis.81, 1712–1721 (2022). 10.1136/ard-2022-222795 - DOI - PMC - PubMed
    1. Kawasaki, A. et al. Association of TNFAIP3 interacting protein 1, TNIP1 with systemic lupus erythematosus in a Japanese population: a case-control association study. Arthritis Res. Ther.12, R174 (2010). 10.1186/ar3134 - DOI - PMC - PubMed
    1. Liu, X., Qin, H., Wu, J. & Xu, J. Association of TNFAIP3 and TNIP1 polymorphisms with systemic lupus erythematosus risk: a meta-analysis. Gene668, 155–165 (2018). 10.1016/j.gene.2018.05.062 - DOI - PubMed

MeSH terms

LinkOut - more resources