. 2024 Sep;25(9):1637-1649.
doi: 10.1038/s41590-024-01909-7. Epub 2024 Jul 26.

An intestinal TH17 cell-derived subset can initiate cancer

Affiliations

An intestinal TH17 cell-derived subset can initiate cancer

Olivier Fesneau et al. Nat Immunol. 2024 Sep.

Abstract

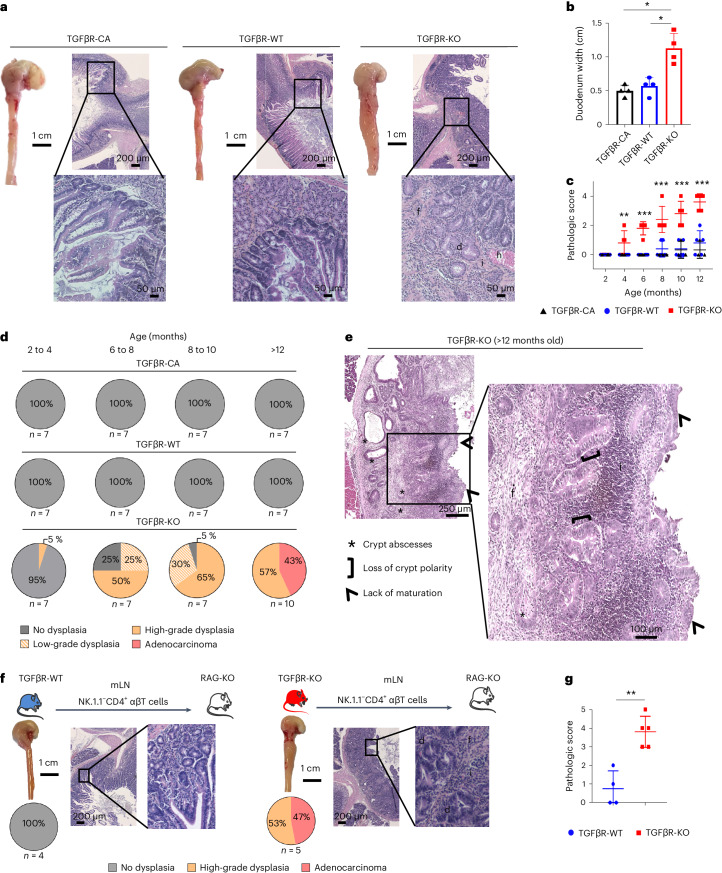
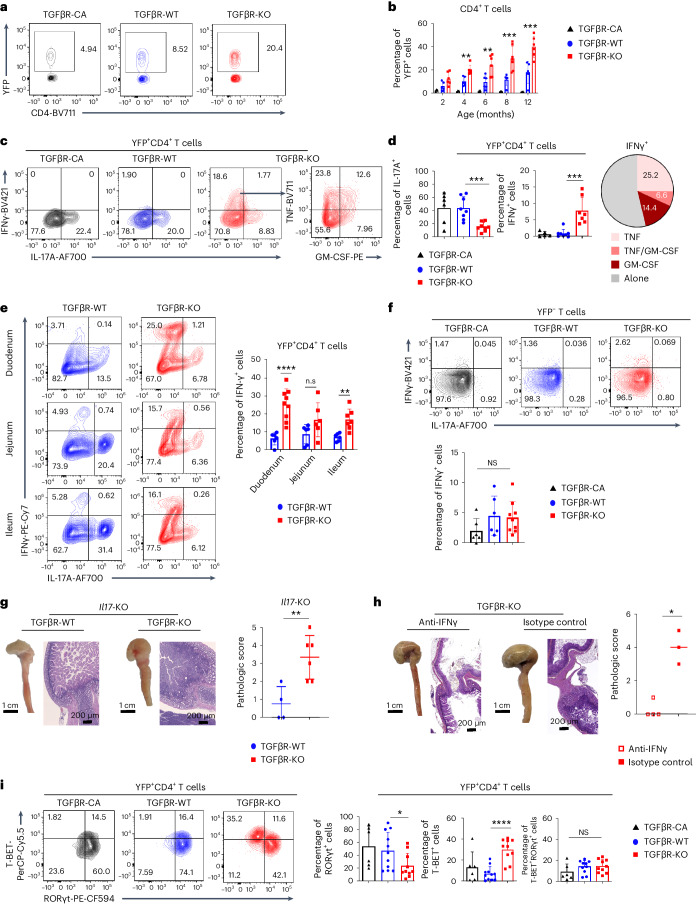
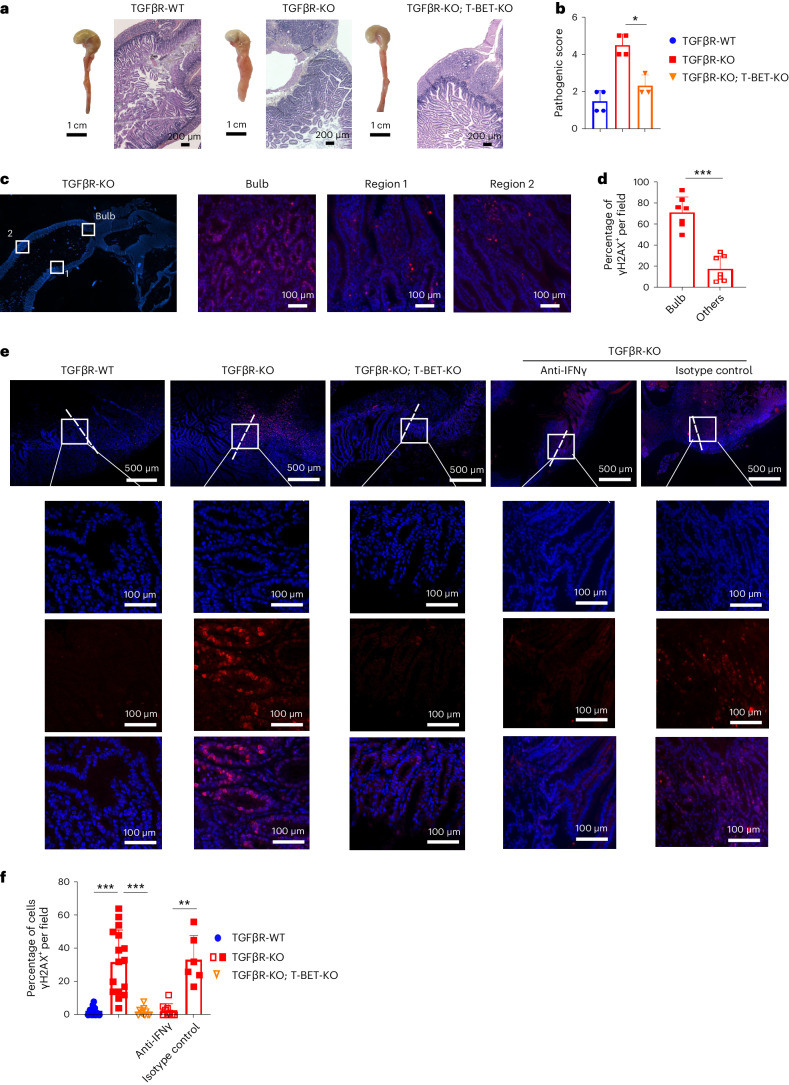
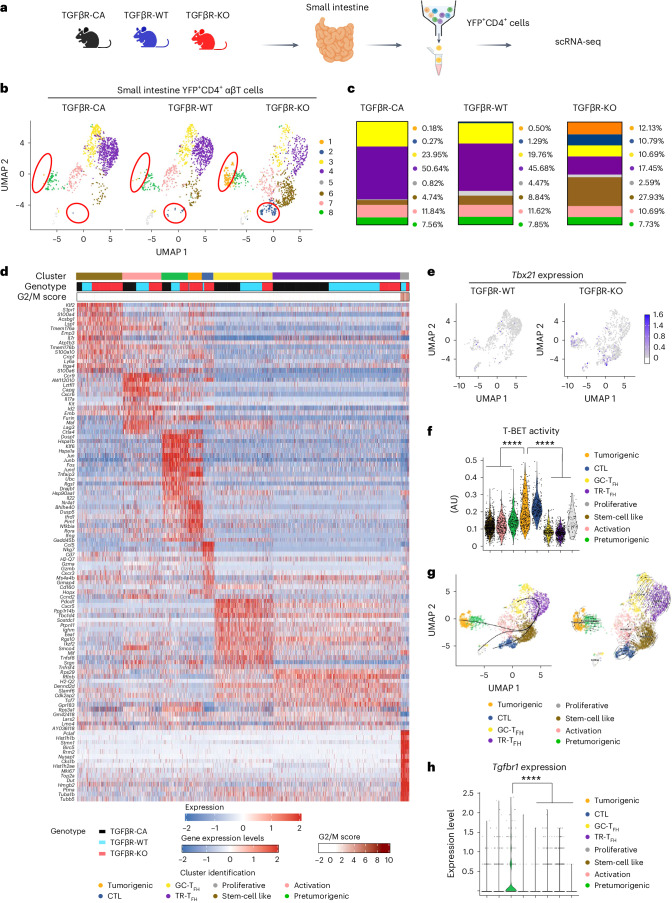
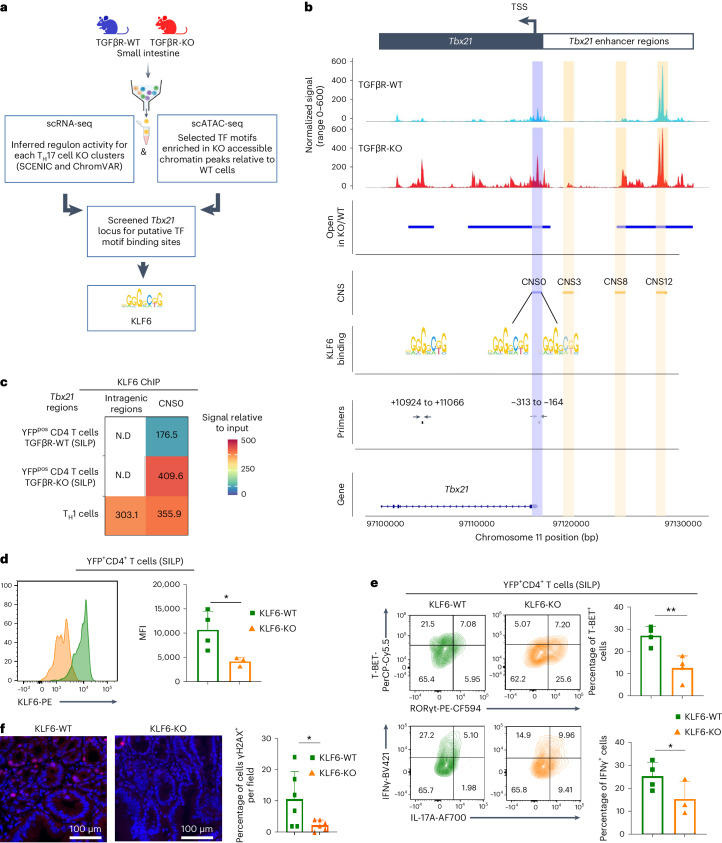
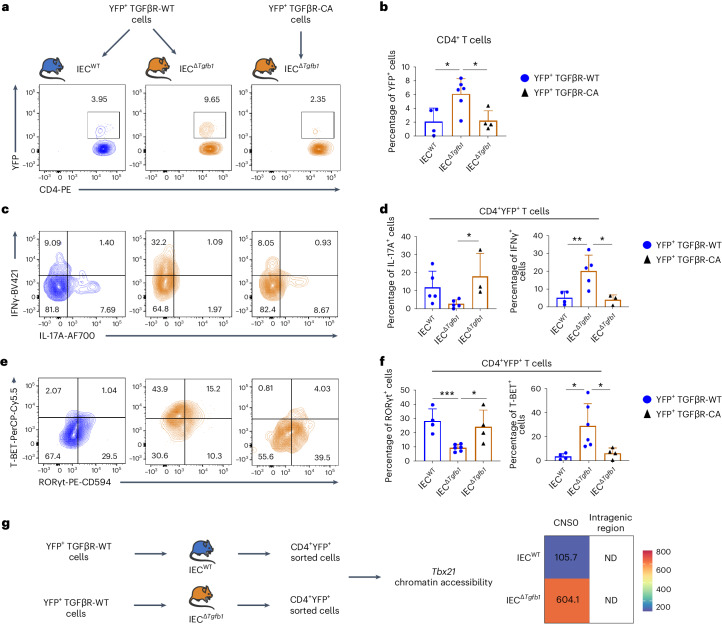
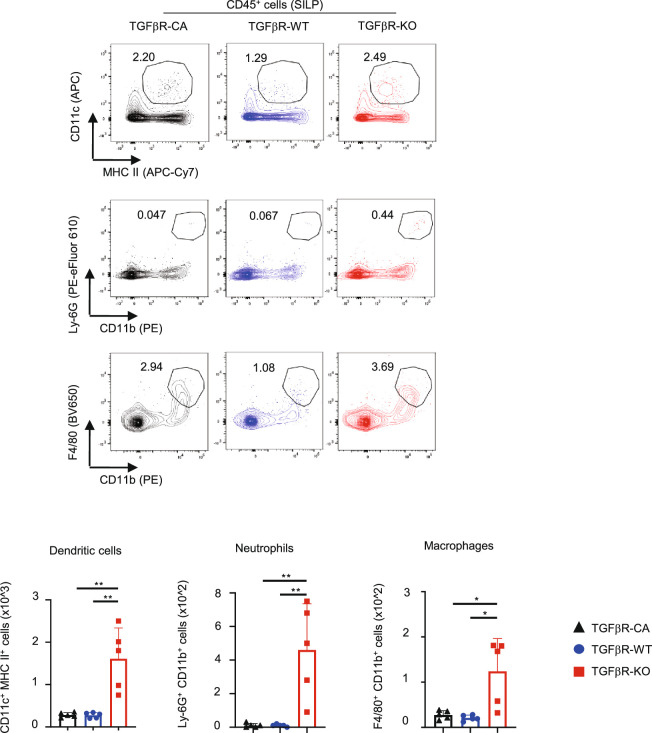
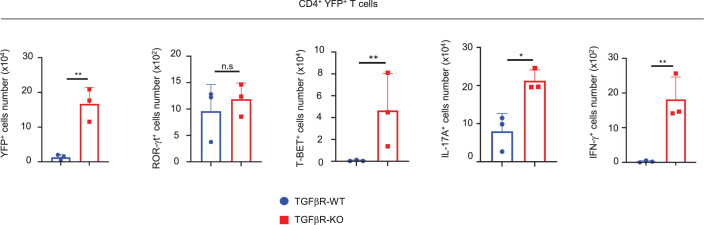
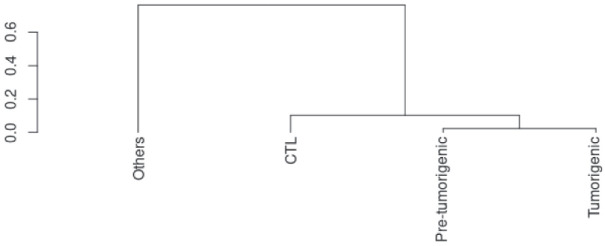
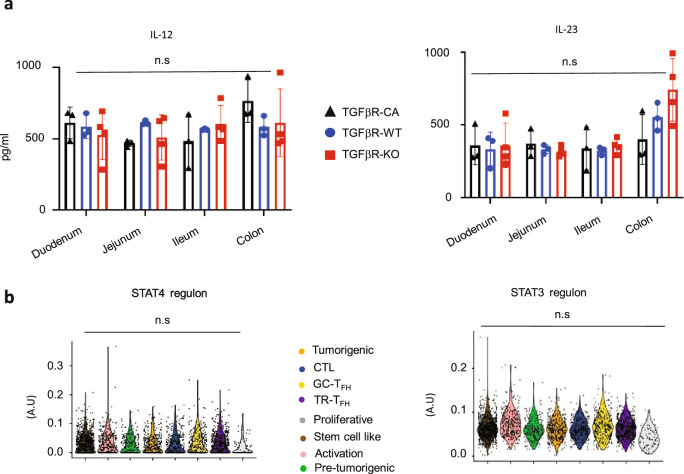
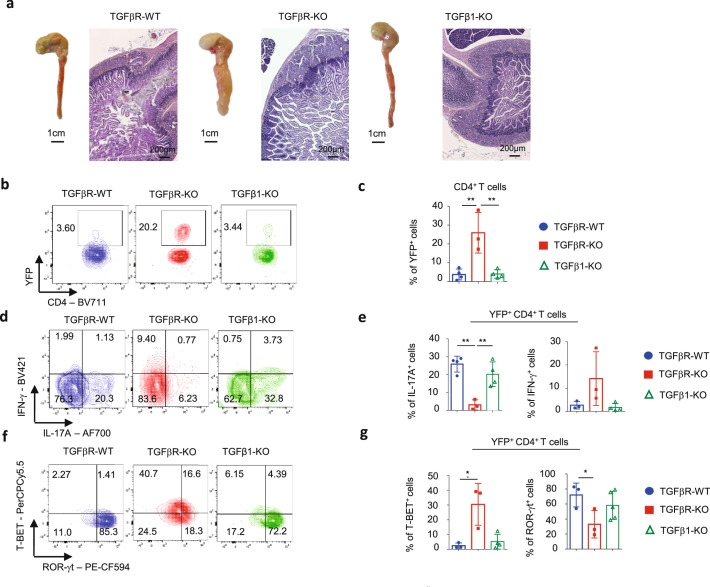
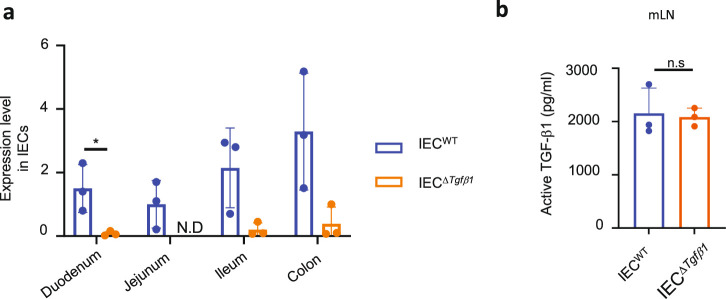
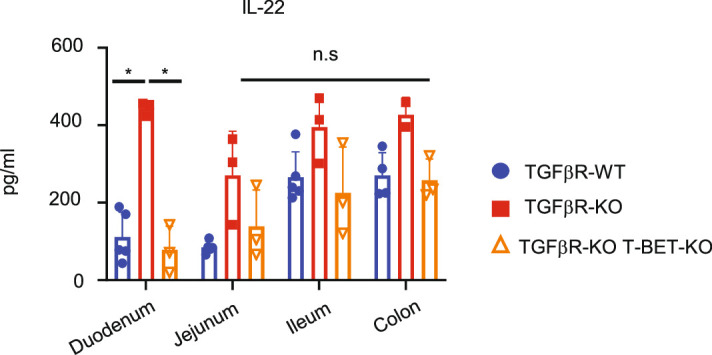
Approximately 25% of cancers are preceded by chronic inflammation that occurs at the site of tumor development. However, whether this multifactorial oncogenic process, which commonly occurs in the intestines, can be initiated by a specific immune cell population is unclear. Here, we show that an intestinal T cell subset, derived from interleukin-17 (IL-17)-producing helper T (TH17) cells, induces the spontaneous transformation of the intestinal epithelium. This subset produces inflammatory cytokines, and its tumorigenic potential is not dependent on IL-17 production but on the transcription factors KLF6 and T-BET and interferon-γ. The development of this cell type is inhibited by transforming growth factor-β1 (TGFβ1) produced by intestinal epithelial cells. TGFβ signaling acts on the pretumorigenic TH17 cell subset, preventing its progression to the tumorigenic stage by inhibiting KLF6-dependent T-BET expression. This study therefore identifies an intestinal T cell subset initiating cancer.


Conflict of interest statement

The authors declare no competing interests.

Figures

Fig. 1
Fig. 1. TGFβ signaling in differentiated TH17 cells prevents spontaneous cancer development.
Spontaneous cancer development was evaluated over time in the duodenum of TGFβR-CA, TGFβR-KO and TGFβR-WT mice. a, Representative gross lesions and hematoxylin and eosin (H&E) histology of the duodenum of 10-month-old mice; d, dysplasia; f, fibrosis, h, hemorrhagia, i, immune cell infiltrates. b, The width of the duodenum of 10-month-old mice was measured (mean ± s.d.). The experiment was repeated four times (P = 0.0286). c, Graph illustrating the pathologic score of the duodenum across the life of the animal (mean ± s.d.). The experiment was repeated four times. d, Percentage of animals with different grades of dysplasia and cancer in the duodenum between 2 and 12 months of age. e, Representative H&E histology of adenocarcinoma observed at the duodenal bulb of TGFβR-KO animals after 12 months of age. f,g, NK1.1CD4+TCRβ+ cells were purified from the mLNs of either TGFβR-KO or TGFβR-WT mice and injected into RAG-KO mice. Eight months later, duodenums of recipient animals were collected and analyzed. The experiment was repeated twice with three and four transfers of TGFβR-WT cells and TGFβR-KO cells, respectively, for each experiment. f, Representative gross lesions, H&E histology staining and percentage of recipient animals with duodenal adenocarcinoma. g, Pathologic scores (mean ± s.d.). The experiment was repeated three times; *P < 0.05; **P < 0.01; ***P < 0.0001. Data were analyzed by two-tailed Student’s t-test (b and c) or two-tailed Mann–Whitney test (g). Source data
Fig. 2
Fig. 2. TGFβ signaling prevents development of TH17 cell-derived tumorigenic cells.
TGFβR-CA, TGFβR-KO and TGFβR-WT mice were crossed with Rosa26-stopfl/fl-yfp reporter mice to map the fate of differentiated intestinal TH17 cells. Cells from the SILP were isolated and analyzed by flow cytometry. a, Representative contour plots of YFP expression in CD4+TCRβ+ cells from 8-month-old animals. b, Percentage of YFP+ cells among CD4+TCRβ+ cells of the SILP across the animal lifespan (mean ± s.d.). Data are representative of seven animals per group for each age analyzed from two independent experiments. c,d, Contour plots showing cytokine expression on YFP+CD4+ T cells from the SILP of 8-month-old mice (c). Quantifications (means ± s.d.) are shown (d). The pie graph in d illustrates the percentage of YFP+CD4+TCRβ+ cells expressing IFNγ either alone or in combination with other inflammatory cytokines. The experiment was repeated five times. e, Contour plots and bar graph (mean ± s.d.) illustrating the percentage of YFP+CD4+ T cells producing IFNγ and IL-17A in the lamina propria of different intestinal segments. The experiment was repeated four times. f, YFP T cells from the SILP of 8-month-old mice were analyzed by flow cytometry. Representative contour plots for cytokine expression and respective quantifications (mean ± s.d.) are shown. Data are representative of three independent experiments with three mice per group. g, Il17a expression was invalidated in TGFβR-KO and TGFβR-WT mice homozygous for Il17a-cre. Representative gross lesions, duodenum H&E histology staining and pathology scores (mean ± s.d.) of 11-month-old animals are illustrated. The experiment was repeated five times. h, Neutralizing antibodies to IFNγ were injected in 4-month-old TGFβR-KO mice for 4 months. Representative gross lesions, duodenum H&E histology staining and pathology scores (mean ± s.d.) are illustrated. The experiment was repeated twice. i, Contour plots (left) showing the expression of TFs in YFP+CD4+ T cells from the SILP of 8-month-old mice and the respective quantifications (right; mean ± s.d.). Data are representative of three independent experiments with three mice per group. For all experiments, statistical significance was evaluated using two-tailed Student’s t-tests; *P < 0.05; **P < 0.01; ***P < 0.001; ****P < 0.0001; NS, not statistically significant. Source data
Fig. 3
Fig. 3. TH1 polarization of differentiated TH17 cells escaping TGFβ signaling initiates cancer.
a, Representative gross lesions and H&E histology staining of the duodenum. b, Pathology score (mean ± s.d.). The experiment was repeated three times. c,d, Duodenums collected from 8-month-old TGFβR-KO mice were analyzed by immunostaining for γH2AX (red). d, Quantification of the percentage of γH2AX+ IECs per field in the duodenal bulb (mean ± s.d.). e,f, TGFβR-KO mice were treated with either neutralizing anti-IFNγ antibodies or isotope control. The duodenums of the different age-matched animals were analyzed by immunostaining for γH2AX (red). f, Quantification of the percentage of γH2AX+ IECs per field in the duodenal bulb (mean ± s.d.). The dashed line represents the limit between the duodenum and pyloric epithelium. Magnifications of the areas highlighted in white boxes are shown on the right. d, Quantification of the percentage of γH2AX+ IECs per field in the duodenal bulb (mean ± s.d.). Data are representative of three mice per group from two independent experiments. The experiment was repeated three times. Statistical significance was evaluated using a two-tailed Student’s t-test, except for b in which a two-tailed Mann–Whitney test was used; *P < 0.05; **P < 0.01; ***P < 0.001. Source data
Fig. 4
Fig. 4. Characterization and origin of TH17 cell-derived tumorigenic cells.
a, scRNA-seq analysis was performed on sorted YFP+CD4+ T cells isolated from the small intestines of 7- to 8-month-old TGFβR-CA, TGFβR-KO and TGFβR-WT mice as illustrated. b, Uniform manifold approximation and projection (UMAP) representation of the repartition of 1,000 cells per group. c, Proportion of each cluster identified among YFP+CD4+ αβT cells. d, Gene expression heat map representation of the top 15 genes increased and decreased in expression in each cluster from TGFβR-CA, TGFβR-KO and TGFβR-WT mice. e, UMAP representation of Tbx21 expression in TGFβR-KO and TGFβR-WT mice. f, Violin plots illustrating T-BET regulon activity in the different clusters identified in TGFβR-KO mice; AU, arbitrary units; GC-TFH, germinal center-localized TFH cells; TR-TFH, tissue-resident TFH cells. g, Two different algorithms were used to evaluate the hierarchy between the single-cell clusters identified in intestinal YFP+CD4+ αβT cells isolated from TGFβR-KO mice. The slingshot package was used to infer pseudotime trajectories, depicted as three smoothed lines joining the different previously identified Seurat clusters (left). CellRank combines pseudotime and RNA velocity to provide streams of directionality (as shown by the arrows) across single-cell clusters (right). h, Violin plots demonstrating Tgfbr1 expression in the different clusters identified in TGFβR-WT mice. For all experiments, statistical significance was evaluated using a two-sided Mann–Whitney test; ****P < 0.0001. Source data
Fig. 5
Fig. 5. KLF6 promotes a tumorigenic state of TH17 cells.
YFP+CD4+ T cells isolated from the small intestines of 7- to 8-month-old TGFβR-KO (KO) and TGFβR-WT (WT) mice were used for scRNA-seq, scATAC-seq, ChIP or CRISPR–Cas9 gene deletion. a, Workflow for the selection of TFs with Tbx21 transactivation potential. After meeting two criteria (that is, significant regulon activity from scRNA-seq and motif enrichment from scATAC-seq), the final shortlist of TFs was based on the presence of putative Tbx21 binding sites. b, scATAC-seq coverage plot neighboring the Tbx21 transcription start site. The top two tracks indicate chromatin accessibility signals for TGFβR-WT and TGFβR-KO cells, with the ‘Open’ track representing the regions with differential chromatin accessibility between the two. Known CNSs and the newly described CNS0 are highlighted in orange and blue, respectively. Approximate locations of KLF6 binding motifs and primers are depicted with arrows; TSS, transcription start site. c, A ChIP assay for KLF6 binding on dedicated DNA regions of Tbx21 was performed. The heat map represents the fold enriched signal compared to the input fraction. In vitro-differentiated TH1 cells from TGFβR-WT mice were used as a control; ND, not detectable. df, Klf6 was deleted by CRISPR–Cas9 in purified YFP+CD4+TCRβ+ cells isolated from TGFβR-KO mice (KLF6-KO). Validation of the deletion was performed by flow cytometry (d). Cells were then adoptively transferred into C57BL/6 recipient mice. Representative contour plots of YFP+CD4+TCRβ+ cells (left) and bar graphs illustrating the percentage of T-BET+ and IFNγ+ cells 3 days after transfer (mean ± s.d.) are shown (e); MFI, mean fluorescence intensity. f, Representative γH2AX (red) and DAPI (blue) staining of the recipient bulb and histogram of the quantification of γH2AX+ IECs per field (mean ± s.d.). Data are representative of two independent experiments with three to four animals per experiment. For all experiments, statistical analyses were performed using unpaired t-tests; **P < 0.01; *P < 0.05. Source data
Fig. 6
Fig. 6. IEC-produced TGFβ1 prevents differentiated TH17 cells from becoming tumorigenic.
YFP+ T cells from TGFβR-WT or TGFβR-CA mice were transferred into either IECΔTgfb1 or Villin-cre, Tgfb1WT (IECWT) recipient mice. Recipients were then treated with tamoxifen, and CD4+TCRβ+ cells from the SILP were analyzed 3 weeks after transfer. a,b, Representative flow cytometry contour plots (a) and percentages of YFP+ cells among CD4+ T cells (b). cf, Representative flow cytometry contour plots of cytokine production and IFNγ and TF factor expression (c and e) as well as quantifications (mean ± s.d.; d and f). g, DNA from YFP+CD4+ T cells purified from the SILP of either IECΔTgfb1 or IECWT recipient mice were analyzed for chromatin accessibility of both KLF6 binding regions (CNS0 and the intragenic regions) of the Tbx21 locus. The heat map demonstrates the fold enriched signal compared to the input fraction. Data are representative of three to six mice from three independent experiments. For all experiments, statistical analyses were performed using a two-tailed Student’s t-test; *P < 0.05; **P < 0.01; ***P < 0.001. Source data
Extended Data Fig. 1
Extended Data Fig. 1. Analysis of the small intestine infiltrating innate immune cells.
CD45Pos cells isolated from the SLIP of the duodenum of 6 month-old TGFβR-KO and TGFβR-WT and TGFβR-CA mice were analyzed by flow cytometry. Counter plots represent the staining strategies and histogram graphs illustrate the numbers of cells per gramme of fresh tissues (mean + SD). Data are representative of 5 animals per groups in 3 independent experiments. Statistical analysis were performed using a two-tailed Student’s t test.*P<0.05; **P<0.01; ***P<0.001. Source data
Extended Data Fig. 2
Extended Data Fig. 2. Gating strategy used for YFPpos cells analysis and cell-sorting by flow cytometry.
(a) Representative gating strategy used to select YFPpos CD4 TCRβ cells after eliminating doublet cells and dead cells for adoptive transfer of cells from the mLN (b) Cells were analyzed after isolation from the LP. Gating strategy used for YFP CD4 T cell analysis is illustrated (c) Gating strategy used to cell-sort the YFPpos CD4 TCRβ cells subjected to scRNAseq, scATACseq, sc TCR seq and other chromatin analyses. Representative post sort purity efficacy is illustrated.
Extended Data Fig. 3
Extended Data Fig. 3. Absolute number of YFPpos CD4 T cells.
SILP of 8-month-old animals was analyzed by flow cytometry. Graph illustrates (mean +SD) the absolute numbers of YFPpos cells expressing the indicated makers. Absolute numbers were normalized on tissue weight. Data are representative of 3 animals per group and 2 independent experiments. Statistical analysis was performed using a two-tailed Student’s t test * p<0.05, ** p<0.001 n.s no statistically different. Source data
Extended Data Fig. 4
Extended Data Fig. 4. Comparison of TCR repertoire between pre-tumorigenic and tumorigenic cells.
Sorted YFPpos CD4 T cells isolated from the small intestine of 7-8-month-old, TGFβR-KO were analyzed by for TCR sequencing by scRNA. scRepertoire was used to assign clonotypes based on TCR chains, quantify and study clonotype dynamics, and integrate with gene expression data in combination with the Seurat package to redefine the cell subsets. Graph illustrates the hierarchical clustering on clonotype size and Jensen-Shannon divergence.
Extended Data Fig. 5
Extended Data Fig. 5. IL-23/12 levels in the intestine and IL-23/12 signature in tumorigenic T cells and pre-tumorigenic cells.
(a) Graphs represent the concentrations (mean + SD) of cytokines in different intestinal segments of 7-8 month-old TGFβR-CA, TGFβR-KO and TGFβR-WT mice measured by ELISA. Concentrations were normalized per grams of tissue. ELISA data are representative of 2 experiments with 3–5 mice per group. (b) Sorted YFPpos CD4 T cells isolated from the small intestine of 7-8 month-old TGFβR-KO mice were analyzed by scRNAseq as described in Fig. 4a. Violin plots representing STAT4 regulon and STAT3regulon in the different subsets. Statistical analysis was performed using a Mann-Whitney for the regulon and paired t test for ELISAs. n.s = non significatively different. Source data
Extended Data Fig. 6
Extended Data Fig. 6. Analysis of TGF-β1 autocrine production by TH17 cells on tumorigenic state development.
Experiments were performed using Il17a-Cre; Rosa stopfl/fl Yfp -TGFβR-KO and TGFβR-WT mice invalidated for Tgfb1. (a) Representative gross lesions and H&E histology staining of the duodenum (b, c) Representative counter plots and quantification (mean +SD) of the percentage of YFPpos CD4 T cell population in the SILP. (d-g) YFPpos CD4 T cells were analyzed for cytokine production and TF expression. Representative counter plots are illustrated as well as graphs illustrating the percentage of cells (mean +SD) expressing the mentioned proteins. Data are representative of 2 experiments 3 to 5 mice per group. Statistical analysis was performed using a two-tailed Student’s t test. *P<0.05; **P<0.01. Source data
Extended Data Fig. 7
Extended Data Fig. 7. Confirmation of Tgfb1 deletion without effect on TGF-β activity in mLN.
VillinCREERT2, Tgfb1fl/fl (IECΔTgfb1) mice with tamoxifen inducible deletion of Tgfb1 in IECs were used. (a)mRNA was extracted from purified of IEC isolated from IECΔTgfb1and IECWT mice isolated from different intestinal segments. Tgfb1 expression IECs was evaluated by qRT-PCR normalized on Gapdh expression. (b) mLN were harvested and the levels of TGF-b1 was measured by ELISA. Data are representative of 3 animals per group from two independent experiments. Source data
Extended Data Fig. 8
Extended Data Fig. 8. Analysis of the IL-22 levels in the intestine.
Graph demonstrates the concentration of IL-22 in different intestinal segments of TGFβR-WT, TGFβR-KO, TGFβR-KO T-BET-KO mice (mean + SD). Data are representative of 2 experiments with 4 mice per group. Statistical analysis was performed using unpaired Student’s t test * p<0.05. n.s no statistically different. Source data

References

    1. Grivennikov, S. I., Greten, F. R. & Karin, M. Immunity, inflammation, and cancer. Cell140, 883–899 (2010). 10.1016/j.cell.2010.01.025 - DOI - PMC - PubMed
    1. Grivennikov, S. I. Inflammation and colorectal cancer: colitis-associated neoplasia. Semin. Immunopathol.35, 229–244 (2013). 10.1007/s00281-012-0352-6 - DOI - PMC - PubMed
    1. Korn, T., Bettelli, E., Oukka, M. & Kuchroo, V. K. IL-17 and TH17 cells. Annu. Rev. Immunol.27, 485–517 (2009). 10.1146/annurev.immunol.021908.132710 - DOI - PubMed
    1. Opejin, A. et al. A two-step process of effector programming governs CD4+ T cell fate determination induced by antigenic activation in the steady state. Cell Rep.33, 108424 (2020). 10.1016/j.celrep.2020.108424 - DOI - PMC - PubMed
    1. Bettelli, E. et al. Reciprocal developmental pathways for the generation of pathogenic effector TH17 and regulatory T cells. Nature441, 235–238 (2006). 10.1038/nature04753 - DOI - PubMed

MeSH terms