. 2024 Jul 25;25(1):287.
doi: 10.1186/s12931-024-02869-0.

Novel hypoxia-induced HIF-1αactivation in asthma pathogenesis

Affiliations

Novel hypoxia-induced HIF-1αactivation in asthma pathogenesis

Mengzhi Wan et al. Respir Res. .

Abstract

Background: Asthma's complexity, marked by airway inflammation and remodeling, is influenced by hypoxic conditions. This study focuses on the role of Hypoxia-Inducible Factor-1 Alpha (HIF-1α) and P53 ubiquitination in asthma exacerbation.

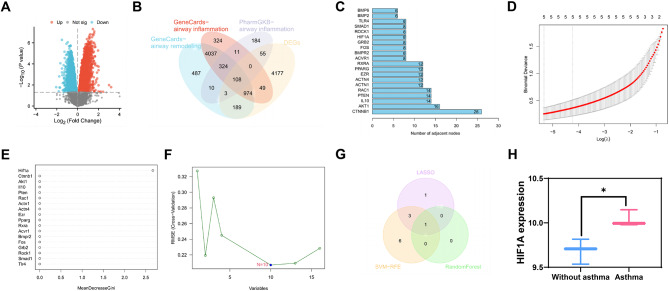
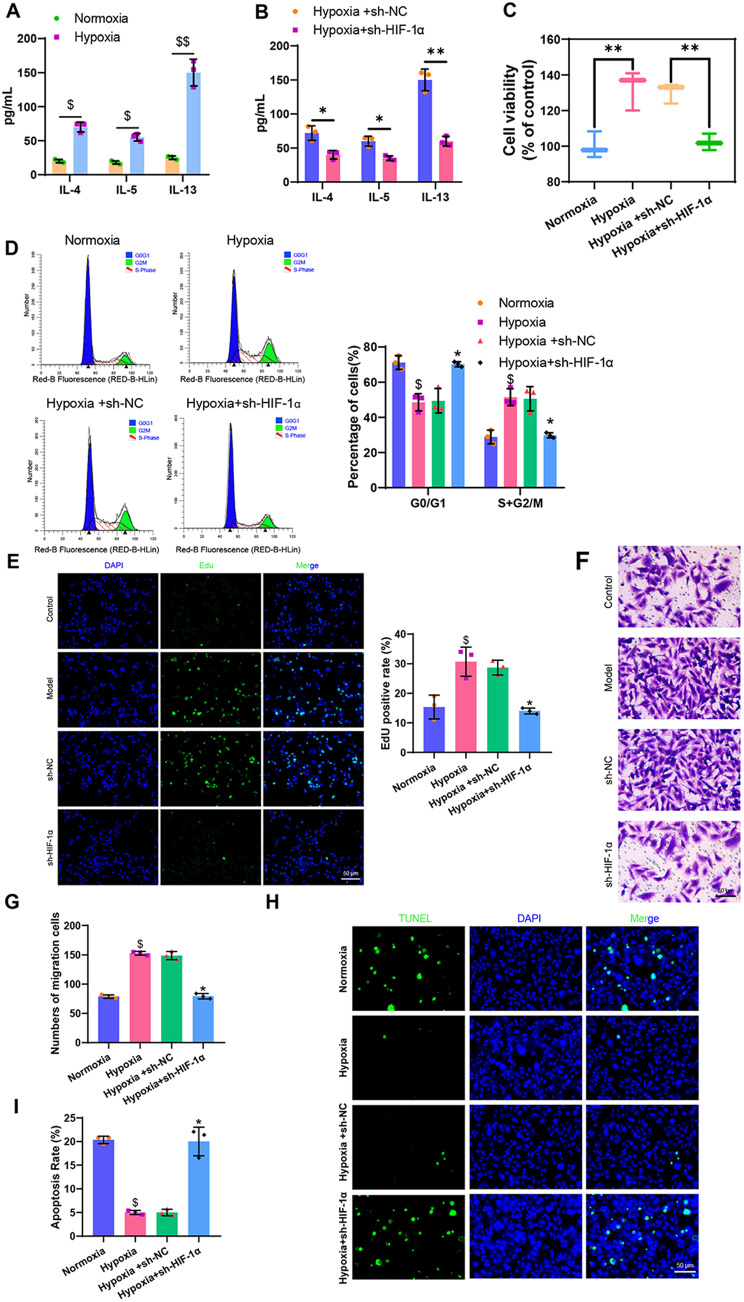
Methods: High-throughput sequencing and bioinformatics were used to identify genes associated with asthma progression, with an emphasis on GO and KEGG pathway analyses. An asthma mouse model was developed, and airway smooth muscle cells (ASMCs) were isolated to create an in vitro hypoxia model. Cell viability, proliferation, migration, and apoptosis were assessed, along with ELISA and Hematoxylin and Eosin (H&E) staining.

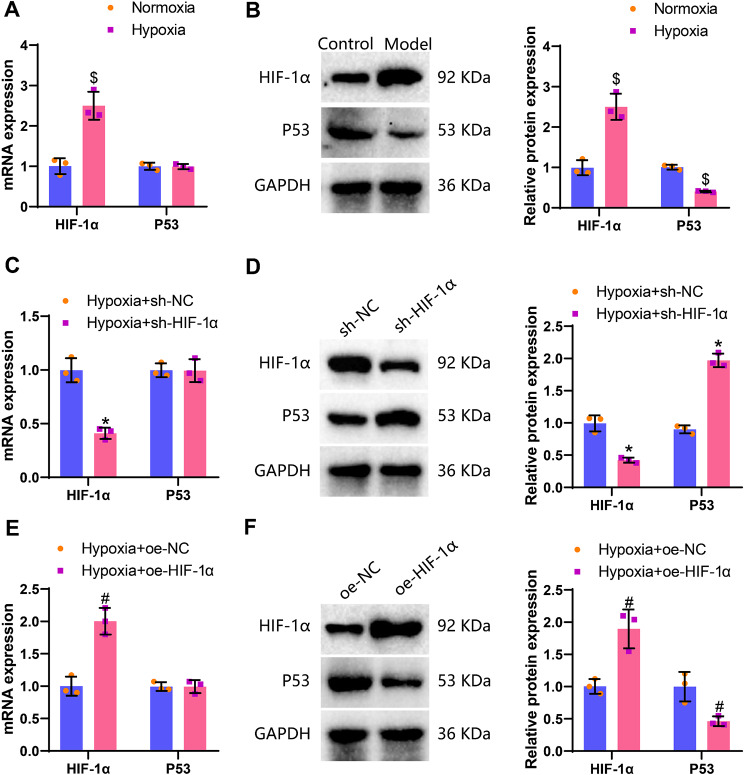
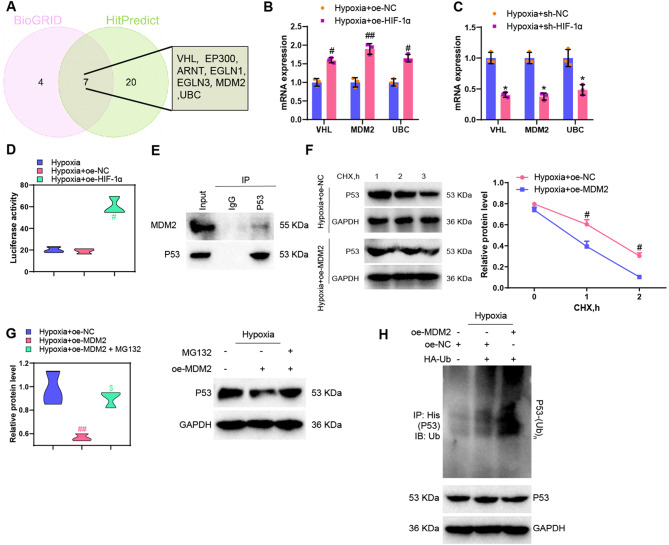
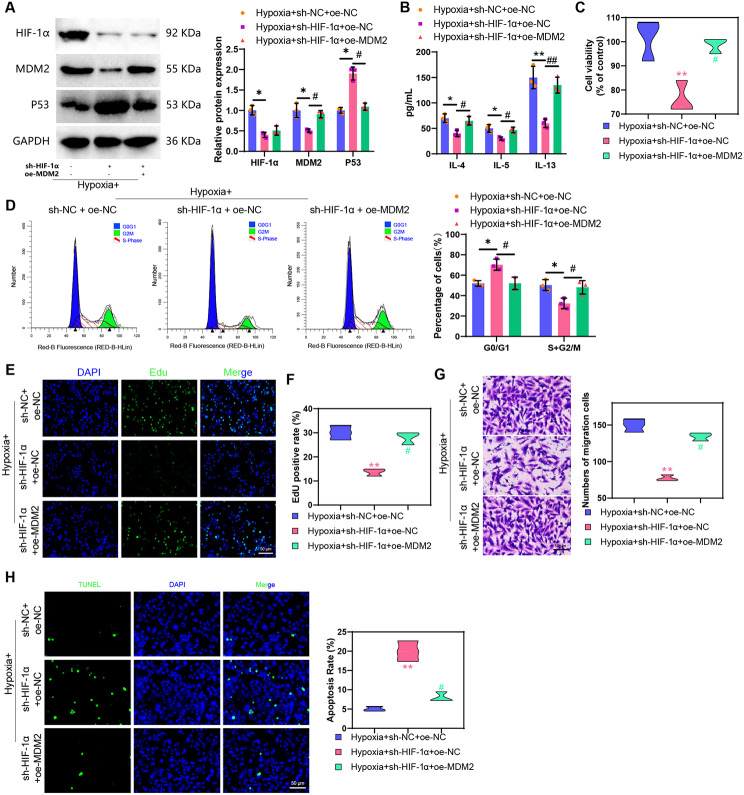
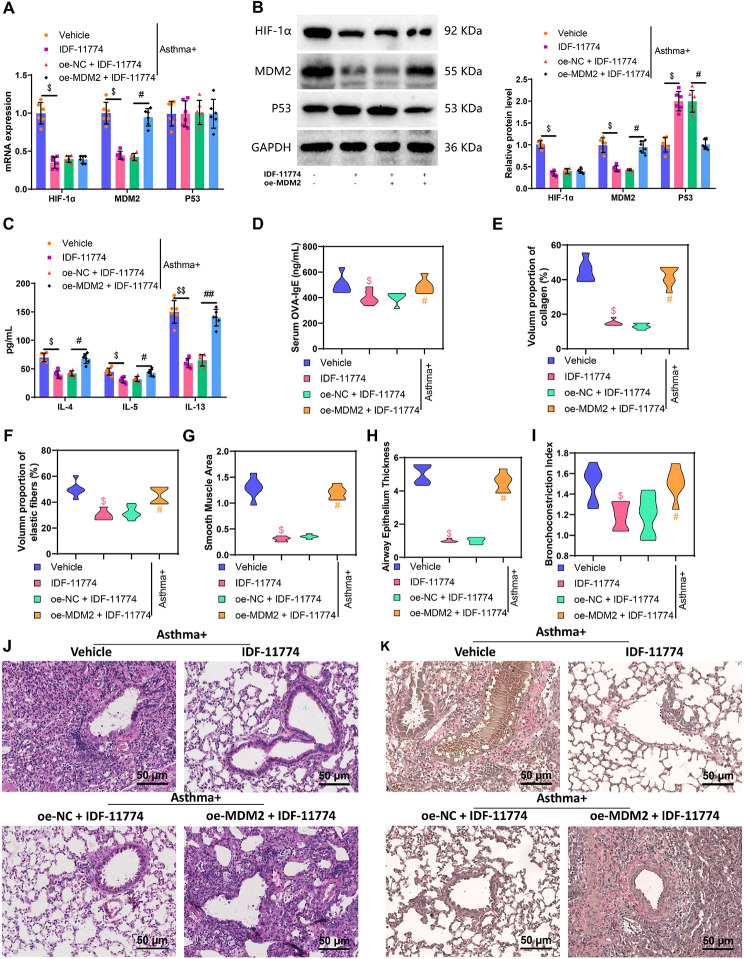
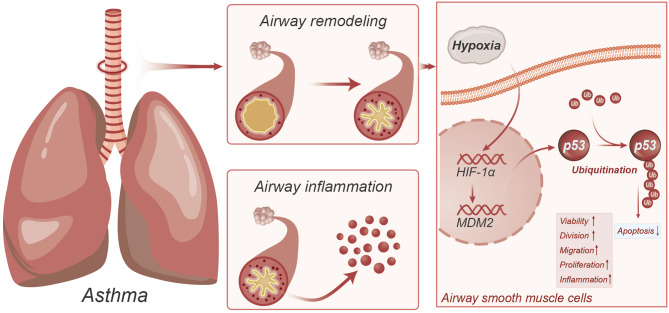
Results: A notable increase in HIF-1α was observed in both in vivo and in vitro asthma models. HIF-1α upregulation enhanced ASMCs' viability, proliferation, and migration, while reducing apoptosis, primarily via the promotion of P53 ubiquitination through MDM2. In vivo studies showed increased inflammatory cell infiltration and airway structural changes, which were mitigated by the inhibitor IDF-11,774.

Conclusion: The study highlights the critical role of the HIF-1α-MDM2-P53 axis in asthma, suggesting its potential as a target for therapeutic interventions. The findings indicate that modulating this pathway could offer new avenues for treating the complex respiratory disorder of asthma.

Keywords: Airway Remodeling; Asthma; HIF-1α; Hypoxia; P53 ubiquitination.


Conflict of interest statement

The authors declare no competing interests.

Figures

Fig. 1
Fig. 1
A machine learning algorithm for screening mRNA related to airway remodeling and inflammation. Note (A) Volcano plot of differentially expressed mRNA between Asthma group and Without asthma group in high-throughput sequencing data of mouse lung tissues; (B) Venn diagram showing the intersection of significantly differentially expressed mRNA in Asthma mouse lung tissues in sequencing data, mRNA related to airway remodeling and inflammation in the Genecards database, and mRNA related to airway inflammation in the PharmGKB database; (C) Statistics of the number of adjacent nodes of core genes in the gene interaction network graph, where the x-axis represents the number of adjacent nodes and the y-axis represents gene names; (D) LASSO regression coefficient selection plot; (E) Random forest algorithm result plot; (F) SVM-RFE analysis result plot; (G) Venn diagram showing the intersection of Asthma-related mRNA selected by three machine learning algorithms: LASSO regression, random forest algorithm, and SVM-RFE; (H) Expression of HIF-1α in the sequencing data, displaying the results as the logarithmic values of gene expression (with 3 cases without asthma and 3 cases with asthma). In the volcano plot, blue dots represent significantly downregulated mRNA in the Asthma group, red dots represent significantly upregulated mRNA in the Asthma group, and gray dots represent mRNA with no significant difference. Note * indicates P < 0.05 compared to the Without asthma group
Fig. 2
Fig. 2
Effects of HIF-1α on ASMCs’ biological functions. Note (A) ELISA detection of inflammation factor levels in ASMCs before and after modeling; (B) ELISA detection of inflammation factor levels in cells from each group; (C) MTT assay to measure cell viability in each group, “%control” refers to the cell viability of each group compared to the Normoxia group; (D) Flow cytometry analysis of cell cycle changes in each group; (E) EdU experiment to evaluate cell proliferation capacity in each group (scale bar: 20 μm); (F) Transwell assay to assess cell migration ability in each group; (G) Quantification of Transwell assay results; (H) TUNEL assay to measure cell apoptosis rate in each group (scale bar = 50 μm); (I) Quantification of TUNEL assay results. Statistical significance was denoted as follows: * for P < 0.05 compared to the Hypoxia + sh-NC group, ** for P < 0.01 compared to the Hypoxia + sh-NC group, $ for P < 0.05 compared to the Normoxia group, and $$ for P < 0.01 compared to the Normoxia group. Each cell experiment was replicated three times
Fig. 3
Fig. 3
Effects of hypoxia on the expression levels of HIF-1α and P53. Note (A) RT-qPCR detection of HIF-1α and P53 levels in ASMCs of the Normoxia group and Hypoxia group; (B) Western blot detection of HIF-1α and P53 protein expression levels in ASMCs of the Normoxia group and Hypoxia group; (C) RT-qPCR detection of HIF-1α and P53 levels in ASMCs of the Hypoxia + sh-NC group and Hypoxia + sh-HIF-1α group; (D) Western blot detection of HIF-1α and P53 protein expression levels in ASMCs of the Hypoxia + sh-NC group and Hypoxia + sh-HIF-1α group; (E) RT-qPCR detection of HIF-1α and P53 levels in ASMCs of the Hypoxia + oe-NC group and Hypoxia + oe-HIF-1α group; (F) Western blot detection of HIF-1α and P53 protein expression levels in ASMCs of the Hypoxia + oe-NC group and Hypoxia + oe-HIF-1α group. * denotes P < 0.05 compared to the Hypoxia + sh-NC group, # denotes P < 0.05 compared to the Hypoxia + oe-NC group, $ denotes P < 0.05 compared to the Normoxia group; each cell experiment was replicated three times
Fig. 4
Fig. 4
Regulation of MDM2 and P53 protein by HIF-1α. Note (A) Venn diagram showing the intersection of genes predicted to bind to HIF-1α in the BioGRID and HitPredict databases; (B)-(C) RT-qPCR detection of VHL, MDM2, and UBC expression in ASMCs cell models with HIF-1α overexpression or knockdown; (D) Dual-luciferase reporter gene experiment for detecting the binding relationship between HIF-1α and the MDM2 promoter in ASMCs cell models; (E) Co-IP experiment to detect the endogenous binding of MDM2 with P53 in ASMCs cell models; (F) Protein blotting to examine the P53 protein levels in ASMCs cells treated with protein synthesis inhibitor CHX; (G) Protein blotting to evaluate P53 protein expression in ASMCs cell models after treatment with proteasome inhibitor MG132; (H) Analysis of ubiquitination levels of P53 in ASMCs cells. * indicates P < 0.05 compared to the Hypoxia + sh-NC group, ** indicates P < 0.01 compared to the Hypoxia + sh-NC group, # indicates P < 0.05 compared to the Hypoxia + oe-NC group, ## indicates P < 0.01 compared to the Hypoxia + oe-NC group
Fig. 5
Fig. 5
Effects of the HIF-1α/MDM2/P53 axis on ASMCs’ biological functions. Note (A) Western blot detection of HIF-1α, MDM2, and P53 protein expression levels in cells from each group; (B) ELISA detection of inflammation factor levels in cells from each group; (C) MTT assay to measure cell viability in each group, “%control” refers to the cell viability of each group compared to the Normoxia group; (D) Flow cytometry analysis of cell cycle changes in each group; (E) EdU experiment to evaluate cell proliferation capacity in each group (scale bar: 20 μm); (F) Quantification of EdU experiment results; (G) Transwell assay to assess cell migration ability in each group; (H) TUNEL assay to measure cell apoptosis rate in each group (scale bar = 50 μm). Statistical significance was indicated by (*) when comparing with the Hypoxia + sh-NC + oe-NC group where P < 0.05, (**) when compared with the Hypoxia + sh-NC + oe-NC group where P < 0.01, (#) when compared with the Hypoxia + sh-HIF-1α + oe-NC group where P < 0.05, and (##) when compared with the Hypoxia + sh-HIF-1α + oe-NC group where P < 0.01. The cell experiments were repeated three times for reliability
Fig. 6
Fig. 6
Effects of HIF-1α-regulated MDM2/P53 signaling axis on airway inflammation and remodeling in mice. Note (A) RT-qPCR detection of HIF-1α, MDM2, and P53 expression levels in mouse lung tissues from each group; (B) Western blot detection of HIF-1α, MDM2, and P53 protein expression levels in mouse lung tissues from each group; (C)-(D) ELISA detection of inflammation factors in bronchoalveolar lavage fluid (BALF) and IgE levels in serum from each group; (E) Statistical analysis of collagen protein volume ratio in airway walls; (F) Statistical analysis of elastic fiber volume ratio in airway walls; (G) Statistical analysis of airway smooth muscle area; (H) Statistical analysis of airway epithelial thickness; (I) Statistical analysis of bronchoconstriction index; (J) H&E evaluation of lung tissue pathology in each group (scale bar: 50 μm); (K) Airway pathological changes in the groups of mice were assessed using Elastica van Gieson (scale: 50 μm), with red representing collagen protein and elastic fiber in the bronchial wall. The symbols # and ## denoted significance when comparing with the Asthma + oe-NC + IDF-11,774 group, where P < 0.05 and P < 0.01, respectively. Similarly, $ and $$ indicated significance when comparing with the Asthma + Vehicle group, where P < 0.05 and P < 0.01, respectively. Each group included six mice for the analysis
Fig. 7
Fig. 7
Molecular mechanism diagram illustrating the upregulation of HIF-1α induced by hypoxia, promoting P53 ubiquitination through the regulation of MDM2, exacerbating airway inflammation and inducing airway remodeling

Similar articles

Cited by

References

    1. Wechsler ME, Munitz A, Ackerman SJ, et al. Eosinophils in Health and Disease: a state-of-the-art review. Mayo Clin Proc. 2021;96(10):2694–707. 10.1016/j.mayocp.2021.04.025. - PubMed
    1. Guo M, Yu JJ, Perl AK, et al. Single-cell transcriptomic analysis identifies a unique pulmonary lymphangioleiomyomatosis cell. Am J Respir Crit Care Med. 2020;202(10):1373–87. 10.1164/rccm.201912-2445OC. - PMC - PubMed
    1. Banno A, Reddy AT, Lakshmi SP, Reddy RC. Bidirectional interaction of airway epithelial remodeling and inflammation in asthma. Clin Sci (Lond). 2020;134(9):1063–79. 10.1042/CS20191309. - PubMed
    1. Elieh Ali Komi D, Bjermer L. Mast cell-mediated Orchestration of the Immune responses in human allergic asthma: current insights. Clin Rev Allergy Immunol. 2019;56(2):234–47. 10.1007/s12016-018-8720-1. - PubMed
    1. Zhu Y, Esnault S, Ge Y, Jarjour NN, Brasier AR. Airway fibrin formation cascade in allergic asthma exacerbation: implications for inflammation and remodeling. Clin Proteom. 2022;19(1):15. 10.1186/s12014-022-09351-3. Published 2022 May 19. - PMC - PubMed

MeSH terms

Substances