. 2024 Jul 26;22(1):377.
doi: 10.1186/s12964-024-01742-3.

Signaling dynamics in coexisting monoclonal cell subpopulations unveil mechanisms of resistance to anti-cancer compounds

Affiliations

Signaling dynamics in coexisting monoclonal cell subpopulations unveil mechanisms of resistance to anti-cancer compounds

Claire E Blanchard et al. Cell Commun Signal. .

Abstract

Background: Tumor heterogeneity is a main contributor of resistance to anti-cancer targeted agents though it has proven difficult to study. Unfortunately, model systems to functionally characterize and mechanistically study dynamic responses to treatment across coexisting subpopulations of cancer cells remain a missing need in oncology.

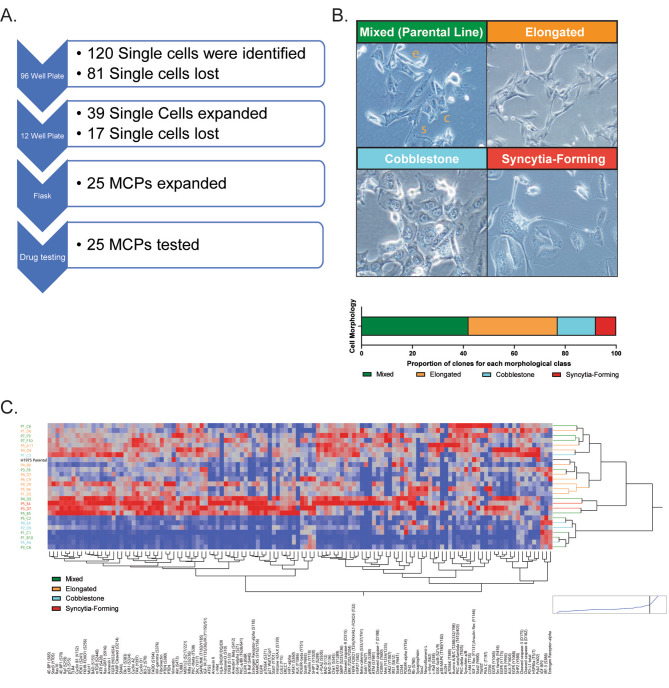
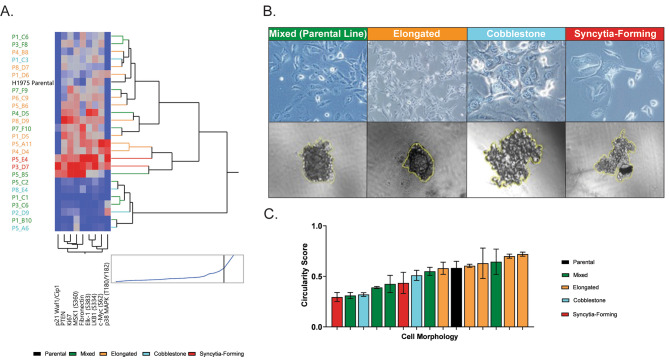
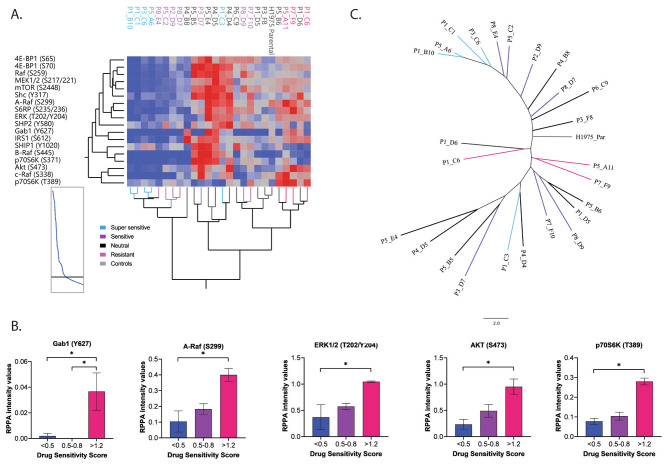
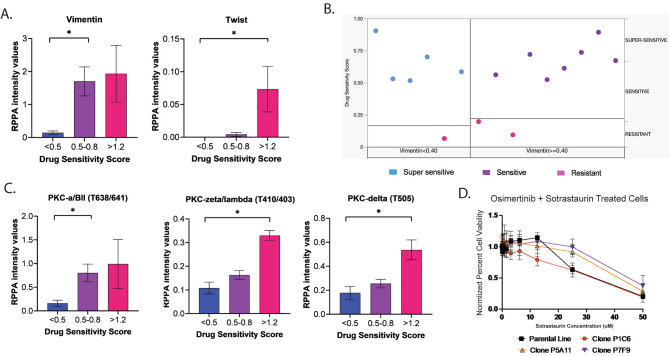
Methods: Using single cell cloning and expansion techniques, we established monoclonal cell subpopulations (MCPs) from a commercially available epidermal growth factor receptor (EGFR)-mutant non-small cell lung cancer cell line. We then used this model sensitivity to the EGFR inhibitor osimertinib across coexisting cell populations within the same tumor. Pathway-centered signaling dynamics associated with response to treatment and morphological characteristics of the MCPs were assessed using Reverse Phase Protein Microarray. Signaling nodes differentially activated in MCPs less sensitive to treatment were then pharmacologically inhibited to identify target signaling proteins putatively implicated in promoting drug resistance.

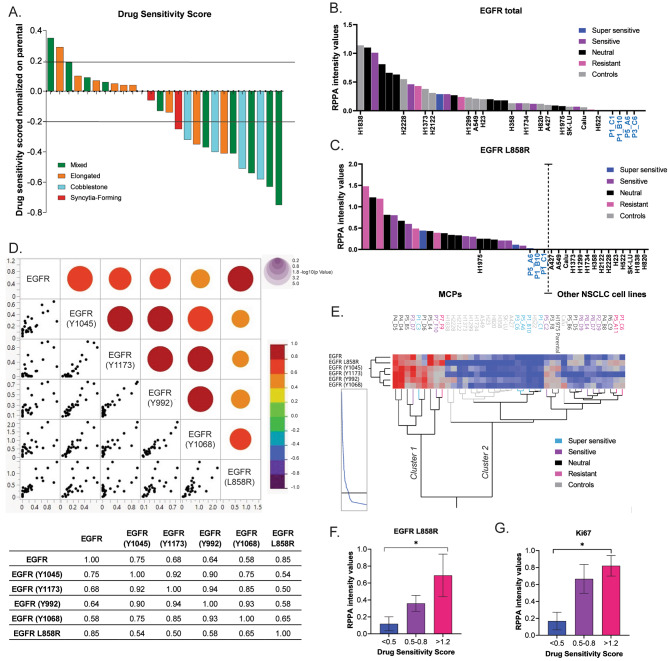
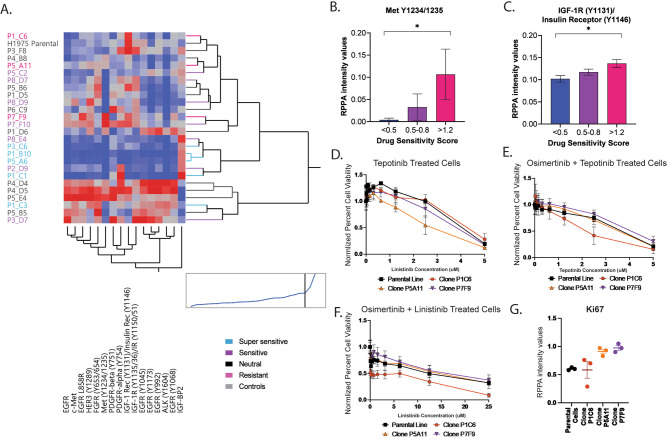
Results: MCPs demonstrated highly heterogeneous sensitivities to osimertinib. Cell viability after treatment increased > 20% compared to the parental line in selected MCPs, whereas viability decreased by 75% in other MCPs. Reduced treatment response was detected in MCPs with higher proliferation rates, EGFR L858R expression, activation of EGFR binding partners and downstream signaling molecules, and expression of epithelial-to-mesenchymal transition markers. Levels of activation of EGFR binding partners and MCPs' proliferation rates were also associated with response to c-MET and IGFR inhibitors.

Conclusions: MCPs represent a suitable model system to characterize heterogeneous biomolecular behaviors in preclinical studies and identify and functionally test biological mechanisms associated with resistance to targeted therapeutics.


Conflict of interest statement

The authors are inventors on US Government and University assigned patents and patent applications that cover aspects of the technologies. As inventors, they are entitled to receive royalties as provided by US Law and George Mason University policy. MP, VE, and EP receive royalties from TheraLink Technologies, Inc. MP, VE, and EP are consultants to and/or shareholders of TheraLink Technologies, Inc; EP is shareholder and consultant of Perthera, Inc.

Figures

Fig. 1
Fig. 1
Establishment of MCPs from the H1975 commercially available NSCLC cell line. Workflow describing the different steps of the single cell cloning and expansion process with the number of individual cells or MCPs detected at each stage (Panel A). Brightfield images showing cellular morphology in selected clones with distinct morphological features. The parental line is shown as a reference and coexisting morphological, namely elongated (e), cobblestone (c), and syncytia-forming cells (s) are highlighted in the parental line (Panel B). Unsupervised hierarchical clustering analysis capturing expression or activation levels of 125 signaling molecules across MCPs. All measured proteins (x-axis) and the 25 MCPs color-coded based on their morphological characteristics (y-axis) are listed (Panel C)
Fig. 2
Fig. 2
Phenotypic and morphological characteristics of the 25 MCPs established from the H1975 cell line. Unsupervised clustering analysis capturing expression or activation levels of 10 signaling molecules that reached statistical significance (p < 0.05) when MCPs with different morphological characteristics were compared (Panel A). Examples of 3D structure formed by MCPs grown in low attachment plates along with their morphological characteristics (Panel B) and circularity score (Panel C)
Fig. 3
Fig. 3
Response of MCPs to the anti-EGFR compound osimertinib compared to the parental line from which they were established. Waterfall plot illustrating the percentage change in cell viability in the MCPs after 72 h of treatment with osimertinib; values for MCPs are normalized to matched vehicle control-treated samples and subsequently to post-treatment cell viability values of the parental line (Panel A). Dynamic range of expression of the EGFR receptor (Panel B) and its L858R mutant variant (Panel C) by RPPA intensity values (y-axis) across the 25 MCPs and 14 NSCLC control cell lines (x-axis), which are delineated with a dotted vertical line to signify low vs. high expression of EGFR. Correlation matrix and correlation coefficients (ρ) capturing levels of association between expression and activation of the EGFR receptor. Red dots indicate positive correlations; the dimension of the dots is proportional to the strength of the association (Panel D). Unsupervised hierarchical clustering analysis displaying changes in the EGFR receptor expression and activation across 25 MCPs and 14 NSCLC control cell lines (Panel E). Bar graph with mean and standard error of the mean (SEM) of expression levels of EGFR L858R in MCPs based on their levels of sensitivity to osimertinib (Panel F). Bar graph with mean and SEM capturing expression levels of Ki67 in MCPs with different levels of sensitivity to treatment (Panel G)
Fig. 4
Fig. 4
Activation levels of RTKs across MCPs with different levels of susceptibility to osimertinib. Unsupervised hierarchical clustering analysis capturing activation levels of RTKs in MCPs and parental line. MCPs are color-coded based on their levels of response to osimertinib on the x-axis; measured analytes are listed on the y-axis (Panel A). Bar graphs with mean and SEM capturing levels of phosphorylated of Met and IGF-1R/insulin receptor in clones with different levels of sensitivity to osimertinib (Panel B and C, respectively; p = 0.03 for both comparisons). Dose-response plots capturing response in selected clones treated to the Met inhibitor tepotinib as single agent (Panel D) and in combination with osimertinib (Panel E) and to the IGF-1R inhibitor linsitinib in combination with osimertinib (Panel F). Bar-graphs with mean and SEM capturing Ki67 levels across MCPs treated with the Met and IGF-1R inhibitors (Panel G)
Fig. 5
Fig. 5
Signaling dynamics of the MAPK and AKT pathway across MCPs with different susceptibility to osimertinib. Unsupervised hierarchical clustering analysis capturing activation levels of 17 signaling proteins known to be downstream substrates of EGFR with MCPs color-coded based on their osimertinib response (Panel A). Bar graphs with mean and SEM for proteins whose activation or expression reached statistical significance (p < 0.05) after post hoc analysis across MCPs with different levels of sensitivity to osimertinib (Panel B). Unrooted phylogenetic neighbor joining tree depicting relatedness across models including MCPs and the parental line. MCPs were color-coded based on their levels of response to treatment with osimertinib (Panel C)
Fig. 6
Fig. 6
Expression and activation of proteins involved in EMT in MCPs with different levels of sensitivity to treatment with osimertinib. Bar graphs with mean and SEM for vimentin and TWIST (p = 0.02 and p = 0.01, respectively), two main EMT effectors, in MCPs with different levels of susceptibility to treatment (Panel A). Among the 125 proteins measured by RPPA, a partition tree analysis identified vimentin as the best predictor of response to treatment with osimertinib across MCPs belonging to different response classes (Panel B). Bar graphs with mean and SEM for different PKC isoforms (PKC α/β II (T638/641), p = 0.03; PKC ζ/λ (T410/403), p = 0.01; and PKC δ (T505), p = 0.01) (Panel C). Drug-response curve for selected clones treated with osimertinib in combination with the pan-PKC inhibitor sotrastaurin (Panel D)

Similar articles

Cited by

References

    1. Dagogo-Jack I, Shaw AT. Tumour heterogeneity and resistance to cancer therapies. Nat Rev Clin Oncol. 2018;15(2):81–94. 10.1038/nrclinonc.2017.166 - DOI - PubMed
    1. Zhang A, Miao K, Sun H, Deng CX. Tumor heterogeneity reshapes the tumor microenvironment to influence drug resistance. Int J Biol Sci. 2022;18(7):3019–33. 10.7150/ijbs.72534 - DOI - PMC - PubMed
    1. Lim ZF, Ma PC. Emerging insights of tumor heterogeneity and drug resistance mechanisms in lung cancer targeted therapy. J Hematol OncolJ Hematol Oncol. 2019;12(1):134. 10.1186/s13045-019-0818-2 - DOI - PMC - PubMed
    1. Turke AB, Zejnullahu K, Wu YL, Song Y, Dias-Santagata D, Lifshits E, et al. Preexistence and Clonal Selection of MET amplification in EGFR Mutant NSCLC. Cancer Cell. 2010;17(1):77–88. 10.1016/j.ccr.2009.11.022 - DOI - PMC - PubMed
    1. Zhang Z, Lee JC, Lin L, Olivas V, Au V, LaFramboise T, et al. Activation of the AXL kinase causes resistance to EGFR-targeted therapy in lung cancer. Nat Genet. 2012;44(8):852–60. 10.1038/ng.2330 - DOI - PMC - PubMed

MeSH terms

LinkOut - more resources